Abstract
High-resolution three-dimensional (3-D) microscopy combined with multiplexing of fluorescent labels allows high-content analysis of large numbers of cell nuclei. The full automation of 3-D screening platforms necessitates image processing algorithms that can accurately and robustly delineate nuclei in images with little to no human intervention. Imaging-based high-content screening was originally developed as a powerful tool for drug discovery. However, cell confluency, complexity of nuclear staining as well as poor contrast between nuclei and background result in slow and unreliable 3-D image processing and therefore negatively affect the performance of studying a drug response.
Here, we propose a new method, 3D-RSD, to delineate nuclei by means of 3-D radial symmetries and test it on high-resolution image data of human cancer cells treated by drugs. The nuclei detection performance was evaluated by means of manually generated ground truth from 2351 nuclei (27 confocal stacks). When compared to three other nuclei segmentation methods, 3D-RSD possessed a better true positive rate of 83.3% and F-score of 0.895+/-0.045 (p- value=0.047). Altogether, 3D-RSD is a method with a very good overall segmentation performance. Furthermore, implementation of radial symmetries offers good processing speed, and makes 3D-RSD less sensitive to staining patterns. In particular the 3D-RSG method performs well in cell lines, which are often used in imaging-based HCS platforms and are afflicted by nuclear crowding and overlaps that hinder feature extraction.
Keywords: 3-D segmentation of nuclei, image processing, high-content screening, bio-image informatics
Introduction
This is a PDF file of an unedited manuscript that has been accepted for publication. As a service to our customers we are providing this early version of the manuscript. The manuscript will undergo copyediting, typesetting, and review of the resulting proof before it is published in its final citable form. Please note that during the production process errors may be discovered which could affect the content, and all legal disclaimers that apply to the journal pertain.
The objective and quantitative analysis of images from cells labeled with immunofluorescent probes takes microscopy from being purely visual, qualitative and subjective to a higher level. Quantitative analysis of fluorescently labeled molecular targets in cells can provide information of their spatial distribution, amounts and topology. The advantage of quantitative microscopy in cellular studies is further enhanced by the addition of automation. High-content screening (HCS) - or the automated acquisition of fluorescently labeled cellular images followed by an automated analysis enables the quantitative assessment of large numbers of images, thereby paving the way for large scale experiments in which multiple conditions are examined simultaneously [1-3].
HCS platforms have primarily evolved as powerful approaches for drug discovery. Due to the involvement of high-resolution three-dimensional (3-D) confocal microscopy and multiplexing of fluorescent labels cell nuclei can be outlined and nuclear targets measured, rendering the cell nucleus the most frequently studied compartment. The 3-D screening turned out as a powerful tool for measurements of nuclear deformation, chromatin organization and cellular heterogeneity and essential in deriving deep, functional information involving spatial and temporal domains from single cells during response to drugs and assessment of cytotoxicity [4, 5].
The high automation of 3-D HCS necessitates image processing algorithms that can accurately and robustly analyze large numbers of images with little to no human intervention. In the automated processing pipelines the image segmentation is a front-end, yet most vulnerable numerical procedure. As a hardware and experimentally independent component, the image segmentation steps should be able to reliably separate nuclei from background and from each other. It is known that rapidly proliferating and overlapping cells provide a challenge for nuclei segmentation procedures. Variable nuclear shapes, chromatin texture, uneven image contrast and background noise increase the difficulty of delineating individual nuclei [6]. A simple intensity based thresholding approach can often separate nuclei from background, unless they contact each other or are closely spaced. To achieve a reliable segmentation of nuclei numerous semi- automated segmentation techniques have been published. However, many of them are tailored to a specific image analysis or screening method, or require the setting of multiple parameters [7]. Fully automated methods are frequently restricted by the morphological variability of specimens, and thus allow only the analysis of regular or pre-selected patterns. Three larger groups for 3-D segmentation techniques can be distinguished and consist of: watershed-based, hybrid and deformable model-based segmentation techniques [8-11]. The latter is most reliable and requires little to no post-processing to refine the segmentation results. However, manual initializations and computational burden make them less practical for HCS analyses. Watershed-based techniques - especially those controlled by markers (seeds) – are computationally less intense, and hence generally faster. Yet, post-processing procedures tailored to the specimen’s morphology are often necessary to determine if splitting or merging of closely positioned, clustered or contacting nuclei is required to correct over- and under-segmentations [12-14]. Another family of nuclear segmentation advances utilizes geometric active contour approaches based on level-sets [15-17]. The level set method was originally used as numerical technique for tracking shapes based on a variant of the geometric heat equation [18], and it is meant to detect contours connecting pixels of the same intensity in an image. In the level set method, contours in 2-D or surfaces in 3-D can be represented by curves and surfaces on a Cartesian grid without the need to parameterize. The level set is able to represent the shapes even if their topology is complex. They are widely used since they do not require explicit parameterization. Yet, their main disadvantage is the computational cost. To separate objects (cells or nuclei), each object has to be represented by a level set function. In addition, a coupling constraint inhibits overlapping of neighboring contours. For N nuclei in the image, N level sets and N2 coupling constraints are determined. These requirements dramatically increase the computational cost in highly confluent specimens. The method proposed by Dzubachyk et al. to segment and track cells by means of a coupled-active-surfaces framework [9] can be used as an example of a level- set based technique. In their approach connected objects determined in the first image frame are segmented with one level-set function using a modified Chan and Vese algorithm [19]. One level-set is assigned to each object. Each level-set function is iteratively evolved until convergence criteria are satisfied. Next, watersheds are used to perform rough splitting of level-set functions in connected components. The algorithm determines whether existing level-set functions need to be terminated or new functions introduced. In the final step, the Radon transform is applied to separate level-set functions of closely positioned nuclei. Tracking of cells is possible by propagating the final position of the level-sets from one image frame to another and adjusting the separation of the level-set functions accordingly.
Hybrid techniques for 2-D and 3-D nuclear segmentations such as those involving h-minima, h- maxima, or Laplacian-of-Gaussian filtering gradient or curvature analysis are better optimized for speed, automation and adaptability to new applications. A known example is the algorithm developed by Al-Kofahi and colleagues [20]. It this method the foreground-background separation through graph-cuts algorithm is subjected to seed detection using the scale normalized response of Laplacian-of-Gaussian constrained by the range of predefined scales. An initial segmentation of nuclei is obtained by the seed-based local-maximum clustering algorithm that allows separating the majority of clustered nuclei. The final segmentation is obtained through a α-expansion and graph coloring. This method is built into FARSIGHT [21] - a free platform for image analysis. In [22] Cheng et al geometric active contours were used to initially segment 2-D images, and then an adaptive H-minima-based algorithm was used to find shape markers that served as seeds for watershed-based splitting of closely spaced nuclei. Another published method involves a cascade of geometric filters insensitive to spatial non-uniformity coupled with geodesic level-sets [23]. It can partition clumped nuclei based on the grouping of points of maximum curvature that were combined according on their spatial properties to define planes dissecting clustered nuclei. Lastly, gradient methods published in [24, 25] employed a diffusion of gradients followed by tracking of their flow and grouping to identify individual nuclei in Zebrafish embryos.
Numerous other algorithms for 3-D image segmentation of cells and nuclei have been developed. While the majority is readily available for the analysis of non-complex cell images, there remains a deficiency of methods for imaging-based high-content screening that can deal with heterogeneity of nuclear texture and high confluency of cells. Such a method could enable screening and exploration of in-depth complex changes in nuclear morphology, signal topology, and signal co-localizations [26-28]. Thus, the main objective of this work is to introduce and evaluate a new approach for rapid delineation of nuclei in high-resolution images. According to the recent research, certain shape priors can be derived directly from the non-segmented image and funneled as features ahead of the actual nuclear segmentation routines. The core idea presented in this paper employs a 3-D radial symmetry transform followed by an adaptive post- processing of symmetry images to arrive at a mask of seeds that can guide a watershed-based segmentation. The output of 3-D radial symmetry transform can quantitatively approximate the circularity of nuclei without an explicit knowledge about their localization. It can therefore serve as an input for guiding image segmentation processes. In comparison to existing methods, the proposed approach requires only a small set of shape descriptors such as circularity and radius upfront. This concept was developed and tested with synthetic images. High-resolution 3-D confocal images of human cells exposed to anticancer drugs were used to validate the effectiveness of the technique and its applicability to HCS. Performance was validated by comparing three state-of-the-art nuclear segmentation methods.
Materials
Image data was repurposed from an imaging-based high-content screening project [28, 29] to characterize the potency of DNA methylation inhibitors in cancer cell lines. The material consisted of treated and untreated DU145 human prostate carcinoma cells, and HuH-7 liver carcinoma cells. Nuclei were immunolabeled with a 5-methylcytosine antibody and 4',6- diamidino-2-phenylindole (DAPI) – a common blue-fluorescent dye that intercalates into double stranded DNA. Staining was followed by confocal imaging. High-resolution optical sections with 1576×1576 pixels, voxel size of 120 nm×120 nm×250 nm (x-, y-, and z-axis) and 12 bits/pixel intensity depth were acquired to form 3-D stacks for each stain. 27 DAPI stacks that were generated on average from 35 slides (Tab.1) and represent a high variability of nuclear staining patterns and cell confluencies (Fig.1) were selected from a large set of pre-existing image data to test the proposed methodology. More details related to specimens, drug treatment schedules, staining protocol and imaging can be found in [28, 29]. Stacks were divided into three groups: low confluency with up to 40 nuclei per stack, moderate confluency (41-65 nuclei) and high confluency (73-190 nuclei). A cell biologist from our team manually identified and delineated 2351 nuclei (ground truth) in mid sections of the 27 stacks as for segmentation performance assessment purposes.
Figure 1.
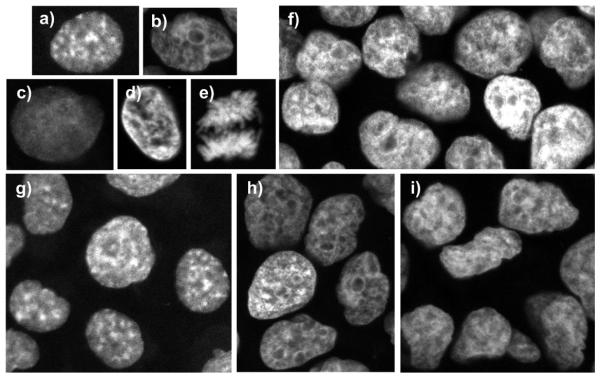
Patterns of nuclear staining, confluency and cell types encountered in our datasets: a) speckled, b) nucleolar, c) low intensity, d) high intensity, e) mitotic, f) high confluency area (about 65%), and g) DU145 untreated cells in a low confluency area (about 27%), h) DU145 treated cells, and i) HuH-7 treated cells. All cells were prepared using the same staining protocol, and all images were acquired using the same microscope settings, and were recorded in 3-D using a 63x objective. Note changes in nuclear patterns and shape in a) vs. b) and c) induced by drug treatment.
Methods
Workflow overview
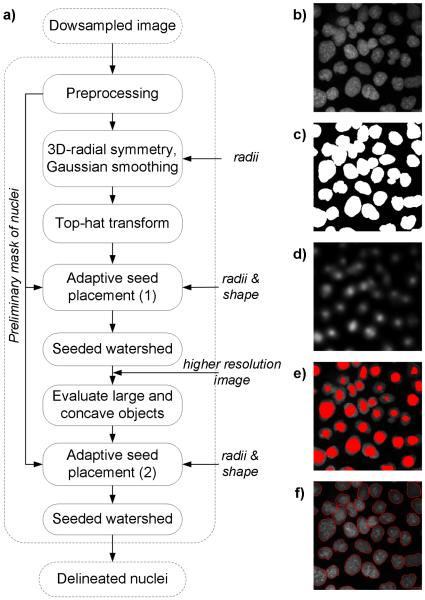
This section outlines the proposed nuclei segmentation method (Fig.2). Briefly, images were analyzed by sequentially executed processing modules: a) preprocessing with background removal, b) 3-D radial symmetry detector followed by refinement of the symmetry signal, and c) adaptive seed placement with seed-controlled watershed segmentation of nuclei. A preliminary mask after the background removal (Fig. 2c) served as a guide for seed placement. 3-D radial symmetry transform followed by post-processing with Gaussian smoothing and top-hat transform yielded radial symmetry images with high intensities localized at or near the centers of nuclei (Fig. 3d). The adaptive seed placement was run twice: in coarse (1) and fine (2) modes (Fig. 3e), and was responsible for probing the radial symmetry images and returning a single seed for each nucleus. User-specified morphometry features were entered to the algorithm to selectively screen and retain seeds with desired shape and volume. Seeds found within the preliminary mask were used by marker-controlled watershed segmentation. The coarse seed placement was run over the entire image, and was expected to detect seeds in closely adjacent nuclei. The fine seed placement was designed to find seeds of nuclei in a very closer proximity or forming clusters. An example output is shown in Figure 3f. The 3-D radial symmetry detector and the adaptive seed placement are newly proposed techniques.
Figure 2.
Rapid 3-D delineation of nuclei in DAPI stained human cancer cells. Workflow in a) refers to example output images at mid-optical section of a z-stack: b) original image, c) preliminary mask of nuclei after background removal, d) output of 3-D radial symmetry transform obtained from the original image, e) seeds superimposed onto the original image, and f) delineated nuclei after final seed placement followed by seeded watershed segmentation.
Figure 3.
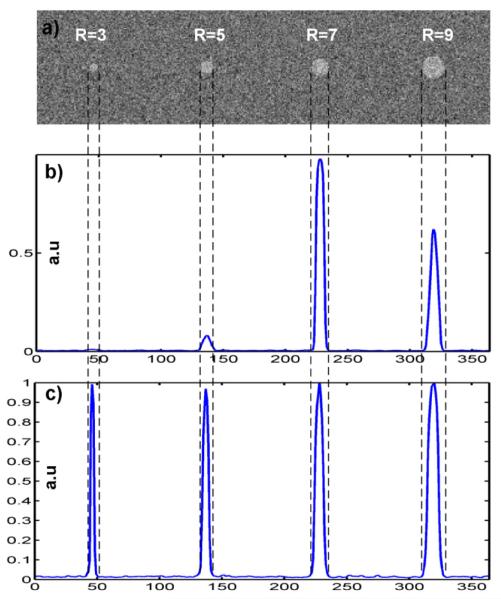
Example 3-D radial symmetry signals in an image with binary spheres with radii set to R=[3, 5, 7, 9] added to a noisy background with noise variance a = 0.25: a) view of the mid- section with 3 equiplanar spheres of different radii, b) profile through Sr (with arbitrarily selected radial distance r=7 ), c) profile through S- obtained via weighted aggregation of Sr=3, Sr=S, Sr=7, and Sr=9.
Preprocessing with background removal
Preprocessing (Fig.2a) was applied to remove the background and to suppress fluctuations of nonspecific DAPI staining seen as low-amplitude and low-frequency extra-nuclear signals. First, low-frequency components in the spectrum matrix obtained by the 3-D fast Fourier transform were shifted to the center, and coefficients inside an isotropic cube of size 3 in x, y and z direction superimposed onto the matrix center were turned to 0. Next, an intensity histogram was derived from the image reconstructed by the inverse 3-D fast Fourier transform. A parameter- free histogram thresholding described in [30] was used to separate background (a narrow histogram peak) from nuclei staining (flat histogram tail). A preliminary mask P obtained in this manner (Fig.2c) provided rough delineation of clustered and separated nuclei. P was then used to guide the detection of seeds and to further split nuclear clusters. To reduce the computational expense in the preprocessing step, the input image was down-sampled by a factor of four. P originating from the down-sampled image was then up-sampled to match the original size as shown in Fig.2a.
3-D radial symmetry for seed detection
The concept of 3-D radial symmetry transform originates from the 2-D radial symmetry transform introduced as a context-free attentional operator to detect points of interest in facial images [31] and from its modified implementations for an automated detection of cell nuclei in images of cytological smears [32, 33]. The 3-D radial symmetry can be obtained from image gradients after gradient magnitudes and orientations are accumulated in two separate matrices. For the 3-D application described here, the Sobel operator with a mask size of 3 × 3 × 3 was applied to provide image gradients in x, y and z direction. The depth related mask GZ was defined as: whereas the two planar masks GX and GY were respectively obtained by rotating GZ by 90 degree around x and y axes traversing the center of the GZ mask. Gradients obtained through the masks’ convolution with the original image were evaluated at each pixel p and its proximity defined by radius r. The contribution of image gradients pointing at p(∘)(p) was accumulated in orientation projection Or and magnitude projection Mr images. The voting-like technique [31] which is a function of r, mapped the degree of object roundness at p considered as object centers. For bright objects overlaid on a dark background the corresponding pixels were evaluated as follows: , , , where: round is the nearest integer rounding operator, is the absolute gradient magnitude, and is the unit gradient at p.
In 2-D images analyzed in [31, 32] the magnitudes in Mr were approximately two orders higher than those in Or . In 3-D images analyzed here, the degree of discrepancy between Mr and Or turned out to be much more prominent due to gradient components evaluated in all three dimensions. In order to balance the effect of the extent of discrepancy and the inherited nonlinearity of Mr and Or , a resulting radial voting image Fr was formed as a weighted sum of the magnitude and projection images as follows:
| (1) |
where: k is the normalizing constant, and a serves as the scaling parameter. Low amplitude gradients attributed to non-round objects, line segments and noise in Or (p) were suppressed by normalizing Or (p) using k = 10, and the radial strictness α = 2 as described in [31].
Next, the 3-D voting image Fr was smoothened by a Gaussian filter to obtain a 3-D radial symmetry image:
| (2) |
where: is the Gaussian kernel, and i, j, k are the distances from the kernel origin along x, y and z axes respectively. Components of Gr controlling the degree of smoothing were adjusted according to the voxel anisotropy of confocal sections, in which the ratio of planar resolution to the depth resolution was approximately 1:2. Hence, the smoothing coefficients were set as: and respectively. r is the radial distance, or simply the radius at which the gradients are evaluated. For isotropic voxels in synthetic images the respective settings were equal for all three dimensions.
An artificial image was synthesized in order to demonstrate how the concept of the 3-D radial symmetry (2) can benefit the automated detection of nuclei. Four binary spheres with incrementally increasing radii Ri ∈ R = [3,5,7,9] with sphere centers aligned on the same z-plane (Fig. 3a) were added to a noisy background. For an arbitrarily chosen radial distance r ∈ R an output image Sr was calculated. An intensity profile (Fig. 3b) along a line passing through Sr where the sphere centers were located demonstrates the shape and dynamics of symmetry signals. In this brief numerical experiment particular attention was paid to the shape, amplitude and location of peaks in Sr defined here as local maxima: max (Sr(r, R)). In particular: a) Sr had high-amplitude and sharp peaks, b) all local maxima in Sr corresponded to the location sphere centers, c) the magnitude of maxima in Sr depended on the relationship between r and R: max (Sr (r = Ri, R)) > max (Sr(r ≠ Ri , R)) (Fig.3b). In other words, the closer r was to R the higher magnitude was observed, d) for any two spheres with radii Ri ≠ Rj and radial distances r matching the radii: max (Sr (r = Ri, {Ri, Rj })) ≠ max (Sr (r = Rj , {Ri, Rj })). As consequence of a)-e) if r was selected so that it closely corresponded to the radius of the target sphere, the local maximum was strong enough to be easily separated from background symmetries originating from noise.
In the above context, r can be considered as a key parameter controlling magnitudes in Sr, and the way its peaks can be detected. Thus, by utilizing 3-D radial symmetries and some knowledge pertinent to the size of objects of interest it is possible to indicate the object’s location. Our next goal was to extend the above technique and calculate a series of Sr - one for each r from a priori given set of radii R, and analyze aggregated Sr s as a combined 3-D radial symmetry image in the following way:
| (3) |
where: wr is the weight corresponding to single r, and c is the normalizing constant. Both wr and c can be derived from artificial images as in Fig.3a-b to normalize the output for various r.
Profiles traced throughout 3-D symmetry images aggregated in this manner are shown in Figure 3c. For implementation in real images the weights wr were fixed as described in the ‘Seed detector properties and parameter settings for real images’ section.
Top-hat transform
In contrast to ideal spheres evaluated in the artificial image shown in Fig.1, the cell nuclei in confocal images have more arbitrary shapes and less definite centers. Moreover, nuclear texture can negatively contribute to orientation and magnitude of gradients related to the object’s circularity, and collectively alter the shape of S . Hence, the output of radial symmetry transform can be prone to coinciding shifts as well as widening and flattening of the radial symmetry peaks. 3-D top-hat transform [34] was implemented to alleviate this degradation, suppress local nonuniformities outside of main peaks in S̄ , and to better preserve the steepness of S̄:
| (4) |
where: ∘ is the gray-scale opening operator and B is the structuring element.
B was chosen to match the shape and volume of the largest object to be preserved. For anisotropic voxels an ellipsoidal neighborhood with size (r, r, r/2) along x, y and z-direction was set. For isotropic voxels the neighborhood size can be equal to r.
Adaptive seed placement (ASP) and segmentation of nuclei
Top-hat enhanced 3-D radial symmetry image Ŝ served as an input for the ASP to arrive at a mask of seeds. In contrast to other seed placement techniques in which a seed was considered a spot that is significantly smaller than the object to be segmented, in this approach an ideal seed is meant to mark nearly the entire nuclear volume and follow as closely as possible the boundary of nuclear envelope. A systematic thresholding of Ŝ was implemented for this purpose. Thresholds t were determined between the min(Ŝ) and max(Ŝ) found in the radial symmetry image, and the range [min(Ŝ) , max(Ŝ)] was split into a number of intervals that differed by a small constant Δ. The application of a single threshold t yielded a binary image Ŝb with multiple 3-D seed candidates that were automatically retained or rejected according to the following pseudo code:
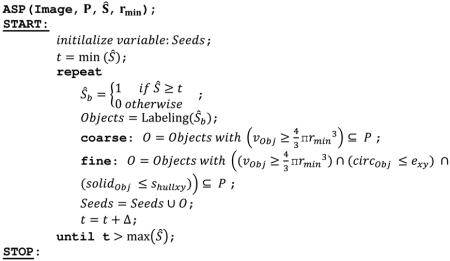
where : coarse and fine modes refer to the main workflow (Fig. 1), P is the preliminary mask of nuclei obtained during the preprocessing, Ŝ is the top-hat transform enhanced image, Objects is the variable storing seed candidates, vObj is the volume of a seed candidate, and are the 2-D circularity and solidity features of a seed candidate calculated from the maximum intensity projection on the z-plane. rmin – is the smallest of the radii substituted to (2, 3), exy and shullxy are thresholds, ∩ and ∪ are the set intersection and sum, ⊆ is the set inclusion operator, and Image is the input 3-D image.
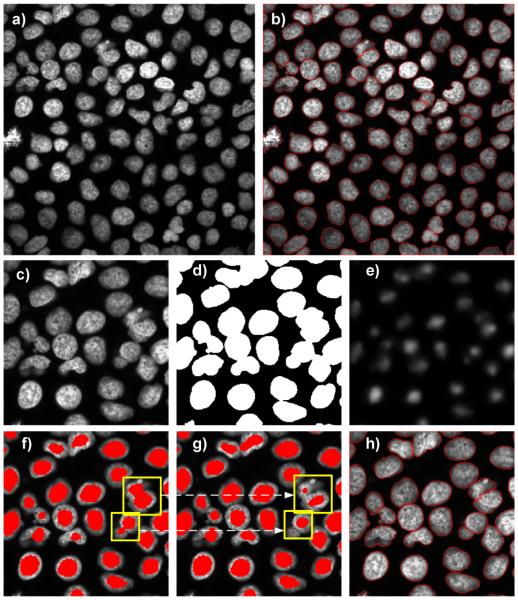
Figure 4 illustrates in detail all processing steps including ASP (Fig.4 f,g) along with example outputs obtained for a 3-D stack passing the whole workflow in Fig.2. Binary seeds detected in the coarse mode were used in the marker-controlled watershed segmentation to delineate nuclei and nuclear clusters. Isolated nuclei and nuclear clusters segmented in this way were inspected to separate nuclei from clusters that were parsed to the fine mode. If the solidity of a cluster was lower than a predefined threshold shullxy, then a 3-D bounding box containing this cluster was extracted from a higher resolution image and pushed through the fine seed detection. If no more clusters meeting this criterion were found, the segmentation was completed.
Figure 4.
Illustration of 3-D nuclei segmentation with subsequent processing steps: a) mid optical section of a 3-D image cube and b) final segmentation results. c) shows a close-up view of the upper-left quarter of a). Binary mask separating nuclei from background is shown in d), and the respective top-hat enhanced radial symmetry Ŝ in e). Seeds are marked in red. f) shows seed placement after the coarse step, and g) shows seeds detected in the fine mode. Bounding boxes (yellow) in f) indicate areas with clustered or in-close-proximity nuclei that were not separated by the seeded watershed segmentation. Clustered nuclei were recognized by shape and volume features and then pushed through the fine stage of seeds placement g). Seeds detected in g) replace seeds detected in f). Final nuclei delineation by the seeded watershed using seeds from g) is presented in h).
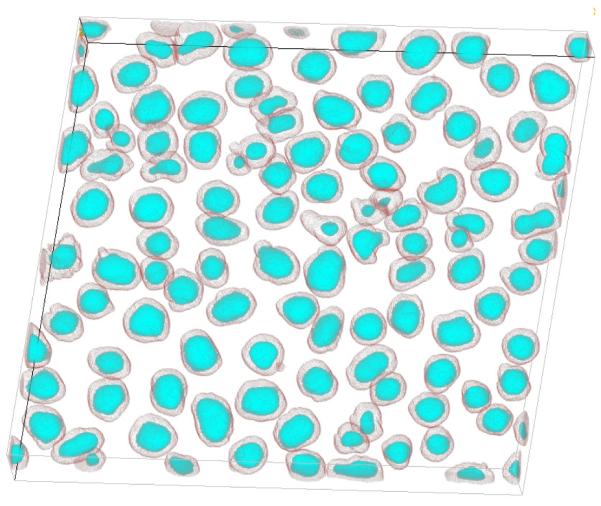
The 3-D bounding box with clustered nuclei was subjected to fine analysis in which both the circularity and the solidity of seeds were checked in addition to the minimal seed volume. Any seed candidate with circularity and solidity smaller than exy and shullxy was rejected. Residual seeds replaced those determined in the coarse mode, and the 3-D bounding box was re- segmented by the seeded-watershed. Updated segmentation results were substituted to the final seed mask that was returned after all binary objects were examined (Fig. 3 b,h). Prior to running the ASP, the parameters such as radii, shullxy and exy were derived from randomly selected nuclei (as described in Seed detector properties and parameter settings for real images section) and embedded to the above pseudo code. An example final 3-D delineation of nuclei rendered using ImageJ plugin [35] is shown in Figure 5.
Figure 5.
3D rendering of nuclei from Fig.3: cyan - detected seeds, and gray - segmented nuclei. The rendering was obtained by means of an ImageJ volume rendering plugin [35].
Seed detector properties and parameter settings for real images
Some prior knowledge related to nuclear morphology is required in order to properly utilize the proposed segmentation workflow. This includes nuclear radii and nuclear shapes. For that, manual delineation of 25 randomly selected nuclei from our image data (Fig.1, Tab.1) was performed. Images with delineated nuclei were down-sampled to the two planar resolutions: 256×256 and 512×512 to reflect processing conditions in the coarse and fine modes. For each manually delineated nucleus and approximate radius was found. Radii from all nuclei (after rounding to nearest odd integers) were [3, 5, 7, 9, 11] and [9, 11, 13, 15] respectively for the two planar resolutions. Maximal values of solidity and circularity parameters were shullxy=0.95 and exy=1.5 as determined from 2-D maximum intensity projections of the manually delineated nuclei. shullxy and exy were same for both image resolutions. The radii and shape parameters were permanently embedded into the analytical workflow (Fig.2).
Table 1.
3-D image data characteristics.
| Cell line | Number of 3-D stacks |
Confluency of nuclei (nuclear area/image area) |
Average number of nuclei/stack |
|---|---|---|---|
| DU145 untreated | 10 | 20%-40% | 68 |
| DU145 treated | 9 | 18%-45% | 72 |
| HuH-7 treated | 8 | 55%-72% | 129 |
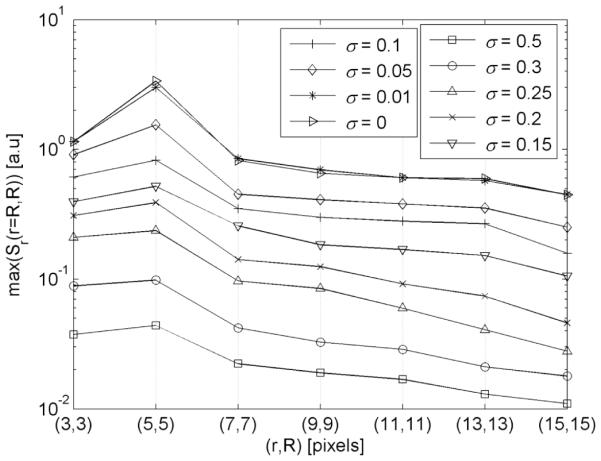
In addition, the involvement of multiple radii required weights wr (Equ.3) to be set to normalize amplitudes of radial symmetry images. These weights were analytically determined. We extended the idea outlined in Figure 3 and used a synthetic binary image containing seven spheres with radii R ∈ [3,15] – the same radii as those found in manually selected nuclei. The binary image was degraded by additive Gaussian noise with variance a that was gradually increased from 0 to 0.75. Radial symmetry images Sr (Equ.2) were calculated and values max were recorded. Highest magnitudes max (Sr (: )) were observed in the center of each sphere consequently for every noise variance, and the increase of noise caused a progressive decline of max (Sr(: )) (Fig 6). However, the decline characteristics in the whole range of r = Ri pairs of were similar regardless of the noise variance. This observation was essential for the entire concept of 3-D radial symmetry based segmentation, because it allowed weights wr in (3) to be kept constant regardless of image degradation. For a > 0.5 and R, r = 3 the max (Sr(: )) was found outside of the sphere. Thus a > 0.5 and R, r = 3 determine the theoretical limit of detection of 3D-RSD. For an uncorrupted image amplitude µ =1 and a > 0.5 the lowest SNR = µ/a at which the detection is possible is equivalent to SNR > 2 (Fig.6).
Figure 6.
3-D radial symmetry response max(Sr(r=Ri, Ri)) in an artificial image containing binary spheres with radii R ∈ [3,15]. Images were corrupted by additive Gaussian noise a ∈ [0,0.5].
Ultimately, for the combined set of radii R=[5, 7, 9, 11, 13, 15] and an arbitrary selected noise level of a = 0.05 , the following weights wr = 1/[1.1, 0.8, 0.75, 0.55, 0.50, 0.44] were derived from Figure 6. One can note that since the characteristics max (Sr(r, Ri, : )) in Figure 6 are similar there is a possibility to derive other sets of weights. Yet, their values will be proportional to those that were already selected. Thus, we assumed that choosing the weights should have no impact on the segmentation as long as the ratios between the weights are preserved. The above selected weights were permanently embedded into the workflow.
Method evaluation
The ground truth tracings were converted to binary masks. Following a commonly used segmentation evaluation methods in [36-38] the precision = TP/(TP + FP), recall = TP/(TP + FN) (sensitivity), and F-measure: F=2*(precision*recall)/(precision+recall) were calculated to assess the performance. If the outline included < 50% of the ground truth nuclear area, the result was counted as a FN (a miss), otherwise it was considered a TP. A lack of overlap with any ground truth was counted as a FP (an additional detection). In addition, the nuclear area agreement between the computed mask (C) and manual ground truth tracings (G) of all TP detections was evaluated by the Jaccard index: ; where ∩ and ∪ represent the intersection and union of binary images, with the summation of involved pixels. Then, Jaccard indices from all nuclei in a 3-D image stack were averaged.
Four segmentation methods: Level Set Cell Tracker (LSetCellTracker) [9], Farsight [21] ver. 0.4.4-win64 downloaded from www.farsight-toolkit.org/, 2-D H-minima shape marking method [22] that we adapted to process images in 3-D, and 3D-RSD were evaluated in this manner. Nuclei segmentation routines in Farsight are parameter-free, whereas the LSetCellTracker is equipped with a graphical user interface through which seven settings controlling the level set evolution namely α0, µ0, t0 and H-minima for the initial segmentation step and α, µ, and t, for the main segmentation step can be manually adjusted. Since there are no guidelines on how to arrive at the most optimal set of parameters for this tool, we tuned H-minima (that is used to initially separate contacting objects) to 2 for which best results were obtained. The other parameters were kept default as we did not notice any significant change in the segmentation performance after their adjustments. The 3-D H-minima shape marking method requires the gap parameter Δ to be set. Similarly to [22], we empirically determined its value and set it permanently to Δ=2 in the processing workflow that comprised background de-trending and removal from our processing pipeline and seeded-watersheds. A single set of parameters for 3D-RSD including radii, solidity and circularity was kept fixed permanently for all data sets. All stacks were downsampled to 512x512 pixels in the planar resolution to standardize processing and evaluation conditions for all three methods. 3D-RSD and LSetCellTracker and H-minima shape marking were coded in Matlab (Mathworks, Natick, MA). Farsight is a standalone application. All tests were run and timed on a PC-based 64-bit workstation computer.
Results
A performance evaluation was conducted utilizing 27 image 3-D stacks from two human cancer cell lines with highly variable nuclear staining patterns caused by drug treatment (Tab 1). Since nuclear confluence in image stacks varied (23 to 190 nuclei per stack), we split our testing set into three groups of low, moderate and high confluency and tested the performance of the three methodologies considering confluency as a variable. High confluency stacks constituted approximately 50% of all the data.
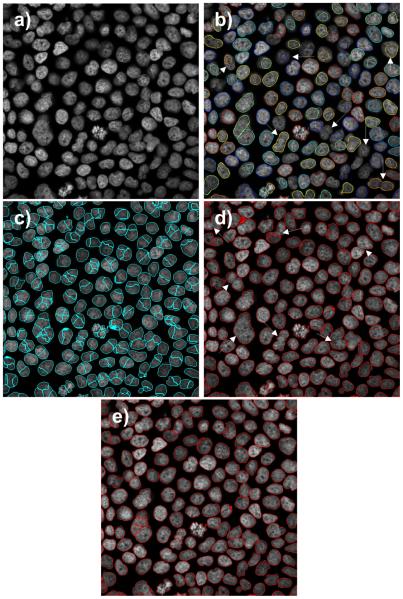
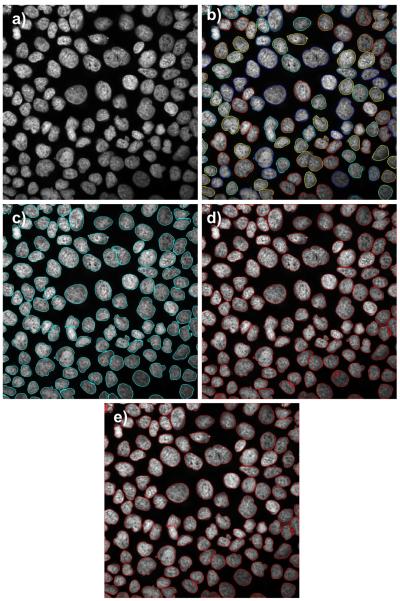
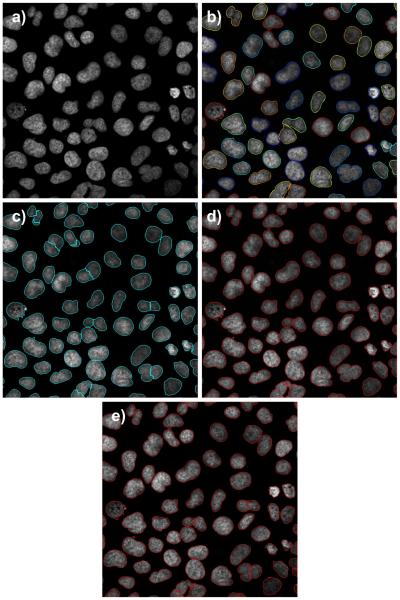
Quantitative evaluations pertinent to the TP, FP, and FN detection rates are shown in Table 2. The method we developed, named 3D-RSD, was the most sensitive across all the specimens (highest recall values) and yielded highest F-scores for data sets of low and high confluency. The paired two-sample t-test for F-scores was used to determine whether LSetCellTracker (µFscore=0.857, σFscore=0.075), H-minima shape marking (µFscore=0.861, σFscore=0.058) and 3D- RSD (µFscore=0.895, σFscore=0.045) F-scores come from independent random samples (H0). The null hypothesis was rejected (p=0.035) and (p=0.047) at α=0.05 suggesting that 3D-RSD detected nuclei with significantly greater accuracy than LSetCellTracker and H-minima shape marking respectively. Farsight-based detections (µFscore=0.7412, σFscore=0.267) were much worse compared to the other three methods. We also evaluated the area overlap metrics for all TP detections (Tab.3). TPs constituted 83.3%, 79,4%, 76.4% and 77.3% of the ground truth for 3D- FRST, H-minima shape marking, LSetCellTracker and Farsight, respectively. One-way ANOVA analysis of Jaccard indices showed no significant difference in contour delineation performance between Farsight, H-minima shape marking, and 3D-RSD, yet it indicted a statistical difference between these three methods and LSetCellTracker (which was best, p<0.0001). However, Farsight, H-minima shape marking and 3D-RSD analyzed stacks significantly faster than LSetCellTracker. FP detections by 3D-RSD were the lowest (75), compared to H-minima shape, LSetCellTracker, and Farsight, which respectively detected 119, 157 and 1724 additional false objects. In general, the segmentation rates were worse in low-contrast and highly confluent specimens. Example results for different cell confluencies are shown in Figures 7, 8 and 9 that were directly exported from the three tested methods as tiff files.
Table 2.
Precision, recall and F-score for the four methods tested on 27 3-D stacks with variable nuclear confluence. Best rates are bolded.
| Precision | Recall | F-score | ||||
|---|---|---|---|---|---|---|
| Confluency | low - moderate |
high | low - moderate |
high | low - moderate |
high |
| 3D-RSD | 0.942 | 0.963 | 0.830 | 0.864 | 0.880 | 0.909 |
| LSetCelTrk | 0.936 | 0.908 | 0.862 | 0.763 | 0.893 | 0.824 |
| Farsight | 0.751 | 0.643 | 0.825 | 0.771 | 0.778 | 0.686 |
| H-minima shape marking |
0.898 | 0.931 | 0.795 | 0.836 | 0.838 | 0.878 |
Figure 7.
A comparison of nuclei segmentation in a high confluency cell set from HuH-7 cell line treated with a high drug dose: a) original image, b) LSetCellTracker, c) Farsight, d) H- minima shape marking, and e) 3D-RSD method. Note over-segmentations in c) and under- segmentations and lack of detections (white arrows) in b) and d). The contrast inside of nuclei is weak. A large diversity of shape, degree of adjacency and staining intensity are prominent.
Figure 8.
A comparison of nuclei segmentation by different methods in moderate-to-high confluency cells set from Huh-7 cell line treated with a low drug dose: a) original image, b) LSetCelTrk, c), Farsight, and d) H-minima shape marking, and e) 3D-RSD method. Note heterogeneity of nuclear shape Image contrast is slightly stronger when compared to that in Figure 7.
Figure 9.
A comparison of nuclei segmentation by different methods in low-to-moderate confluency cells set from untreated DU145 cell line: a) original image, b) LSetCellTracker, c) Farsight, d) H-minima shape marking, and e) 3D-RSD method. Note that some nuclei have more and some less intense staining.
Discussion
As speed and throughput of confocal imaging technology advance, reliable 3-D high-content analysis platforms are often sought to investigate cell phenotypes in cultures and tissue scaffolds. Particularly attractive is the opportunity to quantitatively characterize nuclear phenotypes in a high-content manner. Yet, image processing pipelines that can reliably quantify various cellular phenotypes are rare because developing a one-fits-all tool represents a significant challenge. For instance, CellProfiler [39] – a commonly known platform can segment nuclei in a pseudo 3-D mode. Basically, in Cellprofiler’s workflow a 3-D stack is considered as a series of 2-D images and therefore the segmentation of 2-D images one-by-one from top to bottom of the 3-D stack is performed. This approach necessitates the 3-D nuclear mask to be reconstructed from individual 2-D segmentations and may fail if either over-, under- or lack of segmentations in individual images occur.
Thus, many existing 3-D HCS solutions still fall short in terms of image analysis and speed and lack what is required to robustly navigate through multi-dimensional images. The majority of existing methods are adjusted to meet the parameters of a particular screening scenario and a more unified methodology to reliably segment nuclei in a variety of cellular specimens is one of the major goals in the bioimage informatics field [40-43].
Specimens that consist of highly confluent cells and crowded nuclei with heterogeneous textures in a background that is non-uniform and noisy are particularly difficult to analyze when they are imaged in 3-D at high-resolution. Published methods for their analysis are scarce. Our work is based on 3-D image data from an epigenetic drug evaluation study [28, 29] used to design and test a new nuclear segmentation procedure. Since some of the existing tools may not always perform well we implemented 3-D radial symmetries to pinpoint nuclear regions of interest and to address the problem of nuclear segmentation in highly confluent and phenotype-dense image stacks. The proposed method, 3D-RSD, was guided by the morphology of nuclei and arrived at a mask of seeds for watershed-based segmentation. Granted that the majority of cell nuclei were quasi spherical, the 3D-RSD successfully detected the circularity as the main feature in the image. In nuclear areas, 3D-RSD yielded a strong and high-affinity radial symmetry signal that was converted to large seeds and fitted into the boundary of the binary nuclear mask that was generated in the preprocessing step. Hence, the 3-D radial symmetries with selective characteristics can offer a new way to intuitively control seeded watershed segmentations. The concept of seeds derived from radial votes shown in [43] is different from ours. The technique proposed here technique follows the early work by Loy et al [31] and our own developments of radial symmetries for cervical smears [32, 33]. In [43] the final landscape of iterative voting comes down to the localization of a center of mass – a small seed that constitutes a tiny fraction of the nuclear volume that is placed in the nucleus center. In our case (Fig.4) the seeds are obtained through a radial symmetry image that is a weighted sum of orientation projection and magnitude projection images derived from local image gradients. Seeds obtained the way we propose are much larger and by average occupy 50% of the nuclear volume. Finally, the detected seeds are differently utilized for separation of nuclei in close contact or clusters. In [43] the partitioning of touching nuclei is based on Radon transform and Voronoi tessellation. Our methodology employs watersheds. As we mentioned, large seeds significantly reduce the number of over segmented nuclei – an unwanted effect frequently observed in seeded-watershed algorithms that use punctate or small seeds.
The need for selection of image analysis parameters often prevents the implementation of full automation. User interactions are indispensable to adjust parameters that control image segmentation [42], and it is challenging to develop setting-free methodologies that provide reliable outputs for all 3-D images. The 3D-RSD method required a small set of pre-specified parameters as an input to guide the segmentation, which include radii, circularity and solidity, and are derived from a training sample of different nuclei. Unlike for the LevelSetCellTracker, the parameters for 3D-RSD were related to crude morphological features that are more intuitive to optimize for a less experienced user. More than 75% of nuclei were correctly segmented in the coarse pass of 3D-RSD. To improve the rates of segmentation in areas of high cell confluency, a fine mode was automatically used. The approach not only increased the TP detection rate to 83.3%, but also showed to be computationally efficient. Interestingly, the coarse and fine steps were involved solely the detection and splitting of binary objects.
Our numerical experiments involving 2351 human cells confirmed that the phenotype-dense specimens that exist in high-content screening studies [26, 28] can negatively affect the segmentation performances. Although the 3D-RSD was very robust in determining seeds for individual nuclei, the threshold-based background cutoff seems to be a weak component in the proposed workflow. In stacks with poor nucleus-to-background contrast such as those from experiments involving high levels of drug, this kind of preprocessing resulted in lower Jaccard index due to rougher nuclear contours versus the smooth ones yielded by LSetCellTracker. However, the two other methodologies which involved fundamentally different preprocessing algorithms were more compromised. Both Farsight and LSetCellTracker detected at least 6% fewer TP nuclei than 3D-RSD and had at least twice as high FP rates. Average performance of the H-minima shape marking that we directly adapted for 3-D processing was inferior to our technique. Yet, it outperformed other methods in highly confluent specimens, and thus it seems that its modifications can further improve its seed detection capability.
Our tests indicated that Farsight’s detection rates varied while those from LSetCellTracker were more consistent. Since Farsight’s nuclei segmentation algorithm is parameter free (parameters are fixed) we were not able to investigate the exact cause of Farsight’s low performance in images in question. A possible reason for Farsight’s over-segmentations in our image data could be the low contrast in nuclei pertinent to chromatin organization changes and the diversity of nuclear phenotypes in treated cells. Inferior performance of Farsight seems to be in line with three other studies. In [44] a slight over-segmentation due to spatial clustering of condensed chromatin in Drosophila embryos, and 85% detection accuracy in 2D/3D images of mouse embryos were respectively reported in . Nuclear segmentations in 3-D microscopic images of brain tissue [45] yielded TP rates between 38 and 99%.
Collectively, we assume that our algorithm is less sensitive to different experimental conditions such as: a) different cell lines, b) different treatment schedules, and c) different nuclear size and morphology than other methods tested. Specifically, 3D-RSD performed better in specimens in highly confluent specimens, including those that are affected by fluctuations of local contrast and local staining intensity induced by drugs. 3D-RSD is a method than can offer a very good overall segmentation performance without compromising processing speed – which is in high demand as a feature in imaging-based HCS platforms. Most importantly, the 3D-RSD utilizes local image gradients and provides an approximate localization of the target objects which other methods can utilize, and we are confident that this important image feature can further be developed for analysis of other 3-D and 2-D nuclear and cell segmentation applications.
Conclusions
In this paper we address the issue of a rapid segmentation of nuclei towards fast and reliable phenotyping of large amount cells in 3-D cultures. As a user friendly - scalable and a relatively low complexity method the 3D-RSD achieved remarkable performances in cells lines treated by drugs. Thus, it is conceivable that the 3D-RSD can be used for high-content screening tasks particularly for preclinical compound screening or image cytometry for cancer research.
Table 3.
Jaccard indices and processing times of the four methods tested on 27 stacks.
| Jaccard index | Average processing time | |||
|---|---|---|---|---|
| Confluency | low | moderate | high | [min] |
| 3D-RSD | 0.879 | 0.784 | 0.836 | 3.5 |
| LSetCelTrk | 0.958 | 0.954 | 0.891 | 153.2 |
| Farsight | 0.853 | 0.904 | 0.825 | 0.8 |
| H-minima shape marking |
0.851 | 0.773 | 0.827 | 2.0 |
Acknowledgement
This work was supported in part by a grant 5R21CA143618-02 (to AG) from the National Cancer Institute and in part by grants from the Department of Surgery at Cedars-Sinai Medical Center.
References
- 1.Cox KL, Devanarayan V, Kriauciunas A, Manetta J, Montrose C, Sittampalam S. Immunoassay Methods. In: Sittampalam GS, Gal-Edd N, Arkin M, Auld D, Austin C, Bejcek B, Glicksman M, Inglese J, Lemmon V, Li Z, et al., editors. Assay Guidance Manual. Bethesda (MD): 2004. [PubMed] [Google Scholar]
- 2.Buchser W, Collins M, Garyantes T, Guha R, Haney S, Lemmon V, Li Z, Trask OJ. Assay Development Guidelines for Image-Based High Content Screening, High Content Analysis and High Content Imaging. In: Sittampalam GS, Gal-Edd N, Arkin M, Auld D, Austin C, Bejcek B, Glicksman M, Inglese J, Lemmon V, Li Z, et al., editors. Assay Guidance Manual. Bethesda (MD): 2004. [Google Scholar]
- 3.Glory E, Murphy RF. Automated subcellular location determination and high-throughput microscopy. Dev Cell. 2007;12(1):7–16. doi: 10.1016/j.devcel.2006.12.007. [DOI] [PubMed] [Google Scholar]
- 4.Bogusz AM, Baxter RH, Currie T, Sinha P, Sohani AR, Kutok JL, Rodig SJ. Quantitative Immunofluorescence Reveals the Signature of Active B-cell Receptor Signaling in Diffuse Large B-cell Lymphoma. Clin Cancer Res. 2012;18(22):6122–6135. doi: 10.1158/1078-0432.CCR-12-0397. [DOI] [PMC free article] [PubMed] [Google Scholar]
- 5.Kamykowski J, Carlton P, Sehgal S, Storrie B. Quantitative immunofluorescence mapping reveals little functional coclustering of proteins within platelet alpha-granules. Blood. 2011;118(5):1370–1373. doi: 10.1182/blood-2011-01-330910. [DOI] [PubMed] [Google Scholar]
- 6.Arslan S, Ersahin T, Cetin-Atalay R, Gunduz-Demir C. Attributed relational graphs for cell nucleus segmentation in fluorescence microscopy images. IEEE Trans Med Imaging. 2013;32(6):1121–1131. doi: 10.1109/TMI.2013.2255309. [DOI] [PubMed] [Google Scholar]
- 7.Dima AA, Elliott JT, Filliben JJ, Halter M, Peskin A, Bernal J, Kociolek M, Brady MC, Tang HC, Plant AL. Comparison of segmentation algorithms for fluorescence microscopy images of cells. Cytometry A. 2011;79(7):545–559. doi: 10.1002/cyto.a.21079. [DOI] [PubMed] [Google Scholar]
- 8.Harder N, Mora-Bermudez F, Godinez WJ, Wunsche A, Eils R, Ellenberg J, Rohr K. Automatic analysis of dividing cells in live cell movies to detect mitotic delays and correlate phenotypes in time. Genome Res. 2009;19(11):2113–2124. doi: 10.1101/gr.092494.109. [DOI] [PMC free article] [PubMed] [Google Scholar]
- 9.Dzyubachyk O, van Cappellen WA, Essers J, Niessen WJ, Meijering E. Advanced level-set-based cell tracking in time-lapse fluorescence microscopy. IEEE Trans Med Imaging. 2010;29(3):852–867. doi: 10.1109/TMI.2009.2038693. [DOI] [PubMed] [Google Scholar]
- 10.Lin G, Chawla MK, Olson K, Barnes CA, Guzowski JF, Bjornsson C, Shain W, Roysam B. A multi-model approach to simultaneous segmentation and classification of heterogeneous populations of cell nuclei in 3D confocal microscope images. Cytometry A. 2007;71(9):724–736. doi: 10.1002/cyto.a.20430. [DOI] [PubMed] [Google Scholar]
- 11.Wang M, Zhou X, King RW, Wong ST. Context based mixture model for cell phase identification in automated fluorescence microscopy. BMC Bioinformatics. 2007;8:32. doi: 10.1186/1471-2105-8-32. [DOI] [PMC free article] [PubMed] [Google Scholar]
- 12.Koyuncu CF, Arslan S, Durmaz I, Cetin-Atalay R, Gunduz-Demir C. Smart markers for watershed-based cell segmentation. PloS one. 2012;7(11):e48664. doi: 10.1371/journal.pone.0048664. [DOI] [PMC free article] [PubMed] [Google Scholar]
- 13.Lin G, Bjornsson CS, Smith KL, Abdul-Karim MA, Turner JN, Shain W, Roysam B. Automated image analysis methods for 3-D quantification of the neurovascular unit from multichannel confocal microscope images. Cytometry A. 2005;66(1):9–23. doi: 10.1002/cyto.a.20149. [DOI] [PubMed] [Google Scholar]
- 14.Wahlby C, Sintorn IM, Erlandsson F, Borgefors G, Bengtsson E. Combining intensity, edge and shape information for 2D and 3D segmentation of cell nuclei in tissue sections. Journal of microscopy. 2004;215:67–76. doi: 10.1111/j.0022-2720.2004.01338.x. Pt 1. [DOI] [PubMed] [Google Scholar]
- 15.Dufour A, Shinin V, Tajbakhsh S, Guillen-Aghion N, Olivo-Marin JC, Zimmer C. Segmenting and tracking fluorescent cells in dynamic 3-D microscopy with coupled active surfaces. IEEE transactions on image processing : a publication of the IEEE Signal Processing Society. 2005;14(9):1396–1410. doi: 10.1109/tip.2005.852790. [DOI] [PubMed] [Google Scholar]
- 16.Padfield D, Rittscher J, Thomas N, Roysam B. Spatio-temporal cell cycle phase analysis using level sets and fast marching methods. Medical image analysis. 2009;13(1):143–155. doi: 10.1016/j.media.2008.06.018. [DOI] [PubMed] [Google Scholar]
- 17.Wang M, Zhou X, Li F, Huckins J, King RW, Wong ST. Novel cell segmentation and online SVM for cell cycle phase identification in automated microscopy. Bioinformatics. 2008;24(1):94–101. doi: 10.1093/bioinformatics/btm530. [DOI] [PubMed] [Google Scholar]
- 18.Malladi R, Sethian JA. Image processing via level set curvature flow. Proc Natl Acad Sci U S A. 1995;92(15):7046–7050. doi: 10.1073/pnas.92.15.7046. [DOI] [PMC free article] [PubMed] [Google Scholar]
- 19.Chan TF, Vese LA. Active contours without edges. Image Processing, IEEE Transactions on. 2001;10(2):266–277. doi: 10.1109/83.902291. [DOI] [PubMed] [Google Scholar]
- 20.Al-Kofahi Y, Lassoued W, Lee W, Roysam B. Improved automatic detection and segmentation of cell nuclei in histopathology images. IEEE Trans Biomed Eng. 2010;57(4):841–852. doi: 10.1109/TBME.2009.2035102. [DOI] [PubMed] [Google Scholar]
- 21.Bjornsson CS, Lin G, Al-Kofahi Y, Narayanaswamy A, Smith KL, Shain W, Roysam B. Associative image analysis: a method for automated quantification of 3D multi-parameter images of brain tissue. J Neurosci Methods. 2008;170(1):165–178. doi: 10.1016/j.jneumeth.2007.12.024. [DOI] [PMC free article] [PubMed] [Google Scholar]
- 22.Jierong C, Rajapakse JC. Segmentation of Clustered Nuclei With Shape Markers and Marking Function. Biomedical Engineering, IEEE Transactions on. 2009;56(3):741–748. doi: 10.1109/TBME.2008.2008635. [DOI] [PubMed] [Google Scholar]
- 23.Bilgin CC, Kim S, Leung E, Chang H, Parvin B. Integrated profiling of three dimensional cell culture models and 3D microscopy. Bioinformatics. 2013;29(23):3087–3093. doi: 10.1093/bioinformatics/btt535. [DOI] [PMC free article] [PubMed] [Google Scholar]
- 24.Li G, Liu T, Tarokh A, Nie J, Guo L, Mara A, Holley S, Wong ST. 3D cell nuclei segmentation based on gradient flow tracking. BMC Cell Biol. 2007;8:40. doi: 10.1186/1471-2121-8-40. [DOI] [PMC free article] [PubMed] [Google Scholar]
- 25.Peng H, Bria A, Zhou Z, Iannello G, Long F. Extensible visualization and analysis for multidimensional images using Vaa3D. Nat Protoc. 2014;9(1):193–208. doi: 10.1038/nprot.2014.011. [DOI] [PubMed] [Google Scholar]
- 26.Zhao H, Darzynkiewicz Z. Biomarkers of cell senescence assessed by imaging cytometry. Methods in molecular biology. 2013;965:83–92. doi: 10.1007/978-1-62703-239-1_5. [DOI] [PMC free article] [PubMed] [Google Scholar]
- 27.Brandhagen BN, Tieszen CR, Ulmer TM, Tracy MS, Goyeneche AA, Telleria CM. Cytostasis and morphological changes induced by mifepristone in human metastatic cancer cells involve cytoskeletal filamentous actin reorganization and impairment of cell adhesion dynamics. BMC cancer. 2013;13:35. doi: 10.1186/1471-2407-13-35. [DOI] [PMC free article] [PubMed] [Google Scholar]
- 28.Gertych A, Farkas DL, Tajbakhsh J. Measuring topology of low-intensity DNA methylation sites for high-throughput assessment of epigenetic drug-induced effects in cancer cells. Exp Cell Res. 2010;316(19):3150–3160. doi: 10.1016/j.yexcr.2010.08.013. [DOI] [PMC free article] [PubMed] [Google Scholar]
- 29.Gertych A, Oh JH, Wawrowsky KA, Weisenberger DJ, Tajbakhsh J. 3-D DNA methylation phenotypes correlate with cytotoxicity levels in prostate and liver cancer cell models. BMC pharmacology & toxicology. 2013;14:11. doi: 10.1186/2050-6511-14-11. [DOI] [PMC free article] [PubMed] [Google Scholar]
- 30.Zack GW, Rogers WE, Latt SA. Automatic measurement of sister chromatid exchange frequency. The journal of histochemistry and cytochemistry : official journal of the Histochemistry Society. 1977;25(7):741–753. doi: 10.1177/25.7.70454. [DOI] [PubMed] [Google Scholar]
- 31.Loy G, Zelinsky A. Fast radial symmetry for detecting points of interest. Ieee T Pattern Anal. 2003;25(8):959–973. [Google Scholar]
- 32.Gertych A, Joseph AO, Walts AE, Bose S. Automated detection of dual p16/Ki67 nuclear immunoreactivity in liquid-based Pap tests for improved cervical cancer risk stratification. Ann Biomed Eng. 2012;40(5):1192–1204. doi: 10.1007/s10439-011-0498-8. [DOI] [PMC free article] [PubMed] [Google Scholar]
- 33.Qin Y, Walts AE, Knudsen BS, Gertych A. Computerized delineation of nuclei in liquid-based Pap smears stained with immunohistochemical biomarkers. Cytometry Part B, Clinical cytometry. 2014 doi: 10.1002/cyto.b.21193. [DOI] [PMC free article] [PubMed] [Google Scholar]
- 34.Vincent L. Morphological grayscale reconstruction in image analysis: Applications and efficient algorithms. Ieee T Image Process. 1993;2(2):176–201. doi: 10.1109/83.217222. [DOI] [PubMed] [Google Scholar]
- 35.Schneider CA, Rasband WS, Eliceiri KW. NIH Image to ImageJ: 25 years of image analysis. Nature methods. 2012;9(7):671–675. doi: 10.1038/nmeth.2089. [DOI] [PMC free article] [PubMed] [Google Scholar]
- 36.Coelho LP, Shariff A, Murphy RF. Nuclear Segmentation in Microscope Cell Images: A Hand-Segmented Dataset and Comparison of Algorithms. Proc IEEE Int Symp Biomed Imaging. 2009;5193098:518–521. doi: 10.1109/ISBI.2009.5193098. [DOI] [PMC free article] [PubMed] [Google Scholar]
- 37.Qi J. Dense nuclei segmentation based on graph cut and convexity-concavity analysis. Journal of microscopy. 2013 doi: 10.1111/jmi.12096. [DOI] [PubMed] [Google Scholar]
- 38.Maska M, Ulman V, Svoboda D, Matula P, Matula P, Ederra C, Urbiola A, Espana T, Venkatesan S, Balak DM, et al. A benchmark for comparison of cell tracking algorithms. Bioinformatics. 2014;30(11):1609–1617. doi: 10.1093/bioinformatics/btu080. [DOI] [PMC free article] [PubMed] [Google Scholar]
- 39.Kamentsky L, Jones TR, Fraser A, Bray MA, Logan DJ, Madden KL, Ljosa V, Rueden C, Eliceiri KW, Carpenter AE. Improved structure, function and compatibility for CellProfiler: modular high-throughput image analysis software. Bioinformatics. 2011;27(8):1179–1180. doi: 10.1093/bioinformatics/btr095. [DOI] [PMC free article] [PubMed] [Google Scholar]
- 40.Peng H, Bateman A, Valencia A, Wren JD. Bioimage informatics: a new category in Bioinformatics. Bioinformatics. 2012;28(8):1057. doi: 10.1093/bioinformatics/bts111. [DOI] [PMC free article] [PubMed] [Google Scholar]
- 41.Peng H. Bioimage informatics: a new area of engineering biology. Bioinformatics. 2008;24(17):1827–1836. doi: 10.1093/bioinformatics/btn346. [DOI] [PMC free article] [PubMed] [Google Scholar]
- 42.Meijering E. Cell Segmentation: 50 Years Down the Road [Life Sciences] Signal Processing Magazine, IEEE. 2012;29(5):140–145. [Google Scholar]
- 43.Han J, Chang H, Yang Q, Fontenay G, Groesser T, Barcellos-Hoff MH, Parvin B. Multiscale iterative voting for differential analysis of stress response for 2D and 3D cell culture models. Journal of microscopy. 2011;241(3):315–326. doi: 10.1111/j.1365-2818.2010.03442.x. [DOI] [PubMed] [Google Scholar]
- 44.Chinta R, Wasser M. Three-dimensional segmentation of nuclei and mitotic chromosomes for the study of cell divisions in live Drosophila embryos. Cytometry A. 2012;81(1):52–64. doi: 10.1002/cyto.a.21164. [DOI] [PubMed] [Google Scholar]
- 45.Schmitz C, Eastwood BS, Tappan SJ, Glaser JR, Peterson DA, Hof PR. Current automated 3D cell detection methods are not a suitable replacement for manual stereologic cell counting. Front Neuroanat. 2014;8:27. doi: 10.3389/fnana.2014.00027. [DOI] [PMC free article] [PubMed] [Google Scholar]


