

Abstract
The accurate determination of mass isotopomer distributions (MID) is of great significance for stable isotope-labeling experiments. Most commonly, MIDs are derived from gas chromatography/electron ionization mass spectrometry (GC/EI-MS) measurements. The analysis of fragment ions formed during EI, which contain only specific parts of the original molecule can provide valuable information on the positional distribution of the label. The chemical formula of a fragment ion is usually applied to derive the correction matrix for accurate MID calculation. Hence, the correct assignment of chemical formulas to fragment ions is of crucial importance for correct MIDs. Moreover, the positional distribution of stable isotopes within a fragment ion is of high interest for stable isotope-assisted metabolomics techniques. For example, 13C-metabolic flux analyses (13C-MFA) are dependent on the exact knowledge of the number and position of retained carbon atoms of the unfragmented molecule. Fragment ions containing different carbon atoms are of special interest, since they can carry different flux information. However, the process of mass spectral fragmentation is complex, and identifying the substructures and chemical formulas for these fragment ions is nontrivial. For that reason, we developed an algorithm, based on a systematic bond cleavage, to determine chemical formulas and retained atoms for EI derived fragment ions. Here, we present the fragment formula calculator (FFC) algorithm that can calculate chemical formulas for fragment ions where the chemical bonding (e.g., Lewis structures) of the intact molecule is known. The proposed algorithm is able to cope with general molecular rearrangement reactions occurring during EI in GC/MS measurements. The FFC algorithm is able to integrate stable isotope labeling experiments into the analysis and can automatically exclude candidate formulas that do not fit the observed labeling patterns.1 We applied the FFC algorithm to create a fragment ion repository that contains the chemical formulas and retained carbon atoms of a wide range of trimethylsilyl and tertbutyldimethylsilyl derivatized compounds. In total, we report the chemical formulas and backbone carbon compositions for 160 fragment ions of 43 alkylsilyl-derivatives of primary metabolites. Finally, we implemented the FFC algorithm in an easy-to-use graphical user interface and made it publicly available at http://www.ffc.lu.

Stable isotope labeling experiments (SLE) have emerged as an important tool in metabolic engineering and systems biology.2 Of key concern for SLE is the accurate assessment of isotopomer distributions of cellular metabolites by gas chromatography/mass spectrometry (GC/MS) and nuclear magnetic resonance (NMR).3 While NMR lacks sensitivity, it provides detailed positional information. In contrast, GC/MS allows a sensitive determination of isotopic enrichment but only provides limited positional information. Over the last years, powerful techniques such as metabolic flux analysis (MFA) have been developed to determine metabolic fluxes in biological systems based on the mass isotopomer distributions (MID) of small molecules.4–6 MFA has been applied to many biomedical and biotechnological problems.7–11 Usually, MIDs for mass spectral fragment ions can be calculated only if the chemical formula of the specific fragment ion is known, except if a special experimental setup is used.12 Hence, most often only the information of the molecular ion peaks are used for MID measurements. However, electron ionization (EI)-based mass spectrometry leads to complex mass spectra, caused by the fragmentation of the analyzed compound. The analysis of fragment ions, which contain only specific parts of the original molecule, can provide valuable information on the positional isotopic enrichment within the molecule of interest. This positional distribution of the label is of high interest for 13C-MFA. In addition, based on the applied derivatization method, the molecular ion might not be visible at all and fragment ions have to be analyzed instead. An important consideration is that the process of assigning a chemical structure to a fragment ion from a known molecular ion structure is time-consuming, even for an expert.13
In this work, we propose a novel method for the determination of chemical formulas and retained atoms for EI fragment ions based on the two-dimensional (2D) structure of a compound in combination with the measured mass spectrum. In general, there are two ways to deal with EI-based fragmentation: a rule-based in silico prediction or a combinatorial approach. Rule-based algorithms, such as ACD/MS Fragmenter or Mass Frontier,14 rely on fragmentation mechanisms derived from molecules where the fragmentation is known, assuming that similar structures will fragment the same way. However, small changes in structure can lead to a significantly different fragmentation mechanism.13 Furthermore, the rule-based approach fails for molecules where no similar fragmentation mechanism is known. A combinatorial approach usually is based on a systematic bond cleavage. For that, a cleavage cost is assigned to each bond to find the substructure with minmal costs. Finding the correct cost function, however, is challenging. For example, MetFrag15 uses bond-dissociation energies, whereas FiD16 uses standard bond energies. One drawback of current rule-based and combinatorial approaches is that they can only capture simple hydrogen rearrangements but fail for more complex rearrangements.
Here, we present a universal method to determine chemical formulas for fragment ions without a priori knowledge about the fragmentation mechanisms, taking advantage of the combinatorial aspect of the problem. A method based on a similar idea has been proposed for high-resolution tandem mass spectrometry.16 However, our method is designed for MS data with nominal masses, as produced by most GC/MS instruments with a quadrupole mass analyzer, which are routinely used in many laboratories. In contrast to high-resolution MS data determining chemical formulas for nominal masses is algorithmically more challenging, because there are many possible permutations of elemental compositions that cannot easily be ruled out. In addition, our algorithm is able to cope with molecular rearrangements, which occur frequently in EI measurements.
THEORETICAL BACKGROUND
The fragmentation of gas phase ions is a complex and often hard-to-predict process. A detailed description can be found elsewhere.13 Although the whole fragmentation process can be very complex, there are only a few basic types of reactions that break or form chemical bonds: (1) σ-ionization, immediately breaks a bond (affecting mostly hydrocarbons); (2) α-cleavage, a new bond is formed from a radical site and an adjacent bond is homolytically cleaved; (3) charge-induced heterolytic cleavage, cleavage of a bond next to a charge-site; (4) rearrangements, migrations of atoms or groups of atoms (see Figure 1); (5) displacement of atoms or groups of atoms; and (6) eliminations.
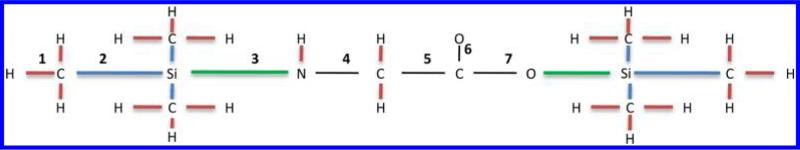
Figure 1.

Proposed fragmentation mechanism of N,O-bis-(trimethylsilyl)-glycine. After expulsion of a methyl radical by alpha cleavage next to the nitrogen, carbon monoxide loss occurs by a retro-Diels–Alder-like reaction.
Graph theory has been extensively used in the fields of biology and chemistry. To model the fragmentation of a molecule, we will apply its graph-theoretical representation to determine chemical formulas of mass spectrometric fragment ions. On the basis of the fragmentation rules described above, a fragment ion is always composed of a subset of atoms of the original molecule. By using graph theory, the problem of assigning a chemical formula to a fragment ion can, therefore, be broken down to finding a subgraph H of G, assuming the graph G represents the structure of the molecular ion.
A graph is an ordered pair G = (V,E) where V is a set of vertices (or nodes) and E a set of edges. Each element of E contains a pair (u,v), elements of V. The term labeled graph refers to a graph G, where a label is assigned to the set of vertices and edges. Formally, this is expressed by the two functions fV: V → A for the set of vertices and fE: V × V → B for the set of edges. If B is an ordered set (e.g., real numbers) then the graph is called weighted and the value fE (u,v) is called the weight of the edge from u to v. A connected component C of a graph G has every pair of vertices joined by a path. A connected graph consists of one connected component. The removal of a set of edges, which disconnects the graph, is called a cut. A subgraph of G = (V,E) is a graph H = (W,F), where W is a subset of V, and F is a subset of E, and all edges in F have their end points in W.
ALGORITHM
We model a molecule as an undirected, connected, and labeled graph G = (V, E, fVA, fVB, fVC, fED), where V is the set of vertices corresponding to the atoms and E is the set of undirected edges corresponding to the bonds between the atoms. The function fVA: V → A assigns each atom an element (e.g., carbon, hydrogen, etc.), fVB: V → B assigns each atom an index, and fVC: V → C assigns each atom the atomic mass according to the chemical element. The function fED: V × V → D assigns each bond an order (single, double, or triple). The mass of the molecular ion corresponds to the sum of the masses of all vertices:
| (1) |
The underlying idea of this algorithm is that the fragmentation process usually only breaks a few bonds within the molecule. This can be simulated by removing a defined number of edges within the molecular graph. In terms of graph theory this means to induce a cut of a certain size in in the graph. This can leave the graph G disconnected. The resulting connected components C = {C1, ..., Cn} of the subgraph H each have a molecular mass:
| (2) |
Since the mass (m) of the fragment ion is determined by mass spectrometry, the chemical formula of this fragment ion corresponds to a combination of connected components of H, in which molecular masses W(Ci) sum up to m. Figure 2 illustrates this process. The resulting subgraph (representing the chemical composition), which can be composed of several connected components, does not necessarily represent the chemical structure because the formation of new bonds (e.g., fragmentation rule 4) is not modeled. However, the number and position of atoms of the intact compound retained in this fragment ion is uncovered.
Figure 2.

Overview of the algorithm. (A) As input FFC needs the 2D structure of the compound together with the mass spectrum of the ion of interest. In this example, we present the molecule N,O-bis-(trimethylsilyl)-glycine (219 Da) and the fragment ion at mass 176. (B) 2D Structure is first converted into a molecular graph. The graph contains 34 vertices and 33 edges. Then all combinations of edge sets of a certain size (in this case 3) are consecutively deleted from the graph, resulting in 5456 disconnected graphs, one for each edge set deleted. The number of resulting subgraphs can be calculated with the binomial coefficient, where n corresponds to the number of edges and k corresponds to the cut size (eq 3). For simplification, only the edge set leading to the correct fragmentation is shown here. (C) For each disconnected graph, the connected components are determined. For every combination of connected components where the molecular masses sum up to the mass of the fragment ion, the atoms of these components are combined to build up a candidate formula. In this example, the connected components shown in green and light blue with the masses 87 and 89 sum up to the target mass of 176. The candidate formula is then C6H18NO2Si2, which is indeed the correct formula for this fragment ion. In addition to the chemical formula, the algorithm also yields positional information about the fate of specific atoms. For example, the carboxyl carbon of the original glycine molecule is lost in this fragment ion. (D) On the basis of the candidate formula, the theoretical mass spectrum is predicted and a spectrum similarity score to the measured spectrum based on the dot product17 is calculated. This is of special importance if more than one sum formula can be derived for the target mass.
So far, we have relied on the assumption that the correct edges are deleted from the graph. There are two unknowns, the number and the position of edges to be deleted. To define the minimal number of edges to delete from the graph (cut size), necessary to model the fragmentation, it is mandatory to take the fragmentation rules (as stated in Theoretical Background) into consideration. Fragmentation types 1–3 cleave one bond without forming new σ-bonds, 4 and 5 cleave one bond while forming a new one, 6 cleaves two bonds while forming a new one. Therefore, to describe an α-cleavage or a σ-ionization, clearly a cut size of one is sufficient. To simulate a simple elimination or a rearrangement, which is equivalent to deleting one edge in the graph, a cut size of one is also necessary. For the combination of a more complex rearrangement and an α-cleavage (as depicted in Figure 1), a cut size of three is necessary. To capture both the single and the combined fragmentations, the algorithm is designed to work with a defined maximum cut size. The cut size starts at one and subsequently increases until it reaches the defined maximum cut size.
One way to find the correct edges to delete from the graph is to select those edges that are most likely to break. For example, low-energy bonds can be assumed to break more easily. Although this is correct, additional rules are needed to describe rearrangements. Another more straightforward way is to delete all possible combinations of edges of a certain cut size. Certainly this includes the correct edges but at the same time increases the number of possible results enormously. If the number of edges is given by n and the cut size by k, then the number of k distinct elements of n is given by the binomial coefficient:
| (3) |
For example, the graph of the molecule N,O-bis-(trimethylsilyl)-glycine with the molecular formula C8H21NO2Si2 has 33 edges. The number of possible distinct edge sets to delete for a cut size of 3 is then 5456.
To find the correct edges, the resulting fragment formulas for each of these possibilities have to be ranked according to a score. At best, this score is linked to the measured mass spectrum. One elegant way to do so is to predict the theoretical mass spectrum of the determined fragment formula and calculate a spectrum similarity score to the measured mass spectrum of this fragment ion. A mass spectrum can be theoretically predicted by using the natural stable isotopic distribution of elements and statistical theory.18 For elements that only have one naturally occurring stable isotope of significant abundance, the distribution of isotopes can be predicted by a binomial distribution:
| (4) |
where n is the total number of atoms, i the number of atoms containing the heavier isotope (e.g., 13C), p0 the natural abundance of the lighter isotope [e.g., p(12C) = 0.989] and p1 the natural abundance of the heavier isotope [e.g., p(13C) = 0.01]. In case an element has several natural occurring isotopes, the distribution of those isotopes within a molecule can be predicted by a multinomial distribution:
| (5) |
where n is the total number of atoms, a0 to ak the number of atoms containing the respective isotope, and p0 to pk the natural abundances of those isotopes.
Reducing Algorithmic Complexity
For GC/MS, compounds are usually derivatized prior to analysis. For example, active protons in functional groups (hydroxyl-, carboxyl-, thiol-, amino groups, etc.) can be replaced with a trimethylsilyl (TMS) or tert-butyldimethylsilyl (TBDMS) group. This makes compounds more volatile and less reactive but at the same time increases the computational complexity of finding the correct chemical formula of a fragment ion. In the case of stable isotope labeling experiments, the interest lies normally only in labeling patterns for atoms of the original (underivatized) molecule. As a consequence, the information obtained from the loss of atoms originating from the derivatization reagent used is often redundant. For example, when TMS derivatization is used, a [M – 15]+ fragment is often present in the mass spectrum, originating from the loss of a methyl group from the derivatized part of the molecule. Depending on the number of TMS groups within the molecule, there are several possibilities for the position of the lost methyl group. With regard to the calculation of chemical formulas, however, the position of this methyl group is not relevant and computational time can thus be saved. For that reason, we divide the molecular graph into atoms belonging to the original molecule (backbone atoms) and atoms originating from the derivatization reagent used. Subsequently, nonbackbone edges (edges that are not connected to at least one backbone atom) are grouped based on the atoms that would be lost if this edge is deleted (Figure 3). For example, all edges are grouped together where their removal would lead to the loss of one hydrogen. This reduces the number of distinct edges significantly, thereby decreasing the combinatorial complexity for the problem of finding the correct chemical formula. Additionally, this allows the user to follow the fate of specific atoms in the molecular ion by selecting them as backbone atoms.
Figure 3.
Graph representation of N,O-bis-(trimethylsilyl)-glycine. The graph contains 33 edges. For a cut size of three, the number of distinct edge pairs to delete is 5456. To reduce the number of distinct edge pairs, non backbone edges (edges that are not connected to at least one backbone atom) are grouped based on their loss pattern. For example, edges shown in red are grouped together because their removal leads to the loss of one hydrogen. The group of edges shown in blue leads to the loss of a methyl group when one of these edges is removed. The group of edges shown in green lead to the loss of a TMS group when one of these edges is removed. After reduction to relevant backbone edges, the graph now contains only 7 distinct edge groups (as illustrated by the numbers above the edges) which reduces the number of distinct edge sets of size 3 from 5456 to 35.
Another advantage which makes the proposed algorithm capable of modeling rearrangements is the use of connected components. Fragment ions resulting from a rearrangement reaction are often composed of two or more disjoint substructures of the molecular ion. Identifying these substructures is computationally challenging, as their number grows enormously with the number of atoms. However, in our algorithm, the number of these substructures is limited by the number of connected components within the molecular graph, making the proposed algorithm also applicable for larger molecules.
Constraining/Weighting the Result Set
One problem of finding a chemical formula through a combinatorial- instead of a rule-based approach is the high number of possible results. One way to remove redundant results is to consider only results where either the molecular formula or the composition of backbone atoms changes. In other words, results with the same chemical formula but different nonbackbone atoms are ignored (as stated above). Although this shrinks the result set considerably, it still leaves a fair amount of candidate formulas. For that reason, the FFC program allows for the addition of a spectrum of a stable isotope labeling experiment to the analysis. Labeled fragments are automatically detected, and MIDs for those fragments are calculated in order to determine the number of labeled atoms within this fragment. Candidate formulas that do not fit the labeling pattern are directly excluded from the result set.
MATERIAL AND METHODS
Details can be found in the Supporting Information.
IMPLEMENTATION
FFC has been developed in C++ and Qt4 and is based on the publicly available MetaboliteDetector,19 NTFD,20 and the ICBM algorithm.21 All graph-based calculations are done using the LEMON graph library,22 available at http://lemon.cs.elte.hu.
RESULTS AND DISCUSSION
We first validated the predictive capabilities of FFC by identifying the chemical formulas for 35 fragment ions of 13 tert-butyldimethylsilyl derivatized amino acids. These manually curated formulas have been published previously by Antoniewicz.1 The mass spectra as well as the 2D structures were obtained from the NIST 08 library. An overview of all fragment ions tested is depicted in Table 1 of the Supporting Information. We tested whether FFC can not only predict the correct formula but also the correct position of retained backbone carbon atoms, which is very important for MFA. We considered a predicted formula as correct when the candidate with the lowest number of broken bonds matched the formula proposed by Antoniewicz. If there were multiple formulas resulting from the same number of broken bonds, we selected the formula with the highest spectrum similarity score. For the composition of backbone carbon atoms, selecting the correct solution is more challenging because candidates with different backbone carbon atoms but the same formula will have the same spectrum similarity score. For this reason, we only considered the prediction of backbone carbon atoms present to be correct if there was a unique solution. Overall, FFC was able to correctly predict 34 out of 35 chemical formulas and 30 out of 35 backbone carbon compositions. In the case of threonine, the formula and the carbon atoms for the fragment ion at m/z 376 were predicted incorrectly. However, when we used a spectrum measured using our Agilent 5975C MSD, both the formulas and the carbon atoms were predicted correctly. Apparently, the spectrum similarity score is dependent on the quality of the spectra used and how close it reflects the theoretical distribution of naturally occurring isotopes. The number of correctly predicted formulas is slightly higher compared to the number of backbone carbon compositions because of similar structural groups within the 2D structure of certain molecules. For example, aspartate 3TBDMS and glutamate 3TBDMS both have two carboxyl groups; for the ions at m/z 390 (Asp) and 330 (Glu), it is not clear which of these two groups is cleaved off. The chemical formula, however, is the same. In case of leucine and isoleucine, the side chains have the same chemical formula (C4H9) as the tert-butyl group and, therefore, have the same mass (m/z 57) and cannot be distinguished by our algorithm. The top two ranked candidate formulas for ions at m/z 200, 274, and 302 of N,O-bis(dimethyl-tert-butylsilyl)-leucine are depicted in Figure 4. For the ion at m/z 302, there are two equally ranked candidate formulas, resulting from either an α-cleavage of the tert-butyl group or the side chain. Interestingly, Antoniewicz showed with a stable isotope labeling experiment that two fragments with the same chemical formula are overlapping for this ion. He found significant M + 2 and M + 6 mass isotopomer abundances when using U–13C-leucine. This suggests that both backbone carbon atom compositions predicted by FFC are legitimate. For the ion at m/z 274, again there are two equally ranked candidate formulas, resulting from either a loss of a tert-butyl and the carbonyl group or the loss of the side chain and the carbonyl group. However, when using U–13C-leucine, only the M + 5 peak is abundant, suggesting that five of the six carbon backbone atoms are still present in this fragment.1 This result can be explained by the rearrangement mechanism depicted in Figure 1. The retro-Diels–Alder-like rearrangement occurs only if the N-terminal tert-butyl is lost in a previous fragmentation step, leading to the loss of the carbonyl group. As these two candidate formulas cannot be distinguished solely from unlabeled spectra (unless an expert in the field is looking at it), a stable isotope labeling experiment should be performed to determine which formula is correct. For ion 200, the correct formula is C11H26NSi, resulting from an α-cleavage between the carbon of the carboxyl group and the adjacent carbon atom. The second best hit with the formula C11H24OSi has a slightly higher spectrum similarity score of 0.999866 (compared to 0.999819) but needs the higher number of broken bonds, which is very unlikely from a chemical point of view. In our analysis, the correct chemical formula for each fragment ion was always present in the list of results. However, as with most prediction algorithms, a critical look at the result is necessary in order to pull out those that are most chemically relevant.
Figure 4.

Chemical formulas for ions 200, 274, and 302 of N,O-bis(dimethyl-tert-butylsilyl)-leucine. The two best-ranked hits, according to the number of broken bonds and spectrum similarity for each ion are shown. Incorrect fragmentations are visualized with a lower opacity, and cleaved atoms are shown in red.
Next, we applied the FFC program to determine the chemical formulas and carbon backbone compositions of a wide range of trimethylsilyl- (Tables 1, 2, and 3) and tert-butyldimethylsilyl- (Table 2 of the Supporting Information) derivatized compounds of central carbon metabolism. In this article, we report a fragment ion repository that includes the chemical formulas and the retained carbon atoms for 160 fragment ions of 43 compounds. The retained carbon backbone compositions of all compounds can be found in the Supporting Information. We manually curated these formulas and verified them with labeled reference spectra. For that, we generated fully 13C-labeled yeast extracts as described in the Materials and Methods section of the Supporting Information. These labeled spectra can be imported in the FFC program, and results that do not fit the labeling pattern are directly removed from the result set. We additionally validated the TMS spectra with deuterated N-methyl-N-(trimethyl-d9-silyl)trifluoroacetamide (MSTFA-d9) as a derivatization reagent. In conclusion, we present a high quality fragment ion repository that can help researchers to analyze stable isotope-labeling experiments. For example, the fragment formulas can be used to calculate MIDs, which in turn can be used in combination with the retained carbon atoms to perform 13C-MFA.
Table 1.
Fragments of TMS-Derivatized Compounds Part 1
| compound | m/z | m/z 13C | m/z d9-TMS | formula |
|---|---|---|---|---|
| adenine 2TMS | 279 | 284 | 297 | C11H21N5Si2 |
| 264 | 269 | 279 | C10H18N5Si2 | |
| 206 | 211 | 215 | C8H12N5Si | |
| alanine 2TMS | 233 | – | – | C9H23NO2Si2 |
| 218 | 220, 221 | 233, 236 | C8H20NO2Si2 | |
| 190 | 192 | 205 | C7H20NOSi2 | |
| 116 | 118 | 125 | C5H14NSi | |
| aspartic acid 2TMS | 277 | 281 | 295 | C10H23NO4Si2 |
| 262 | 266 | 277 | C9H20NO4Si2 | |
| 234 | 237 | 249 | C8H20NO3Si2 | |
| 220 | 222 | 235 | C7H18NO3Si2 | |
| 160 | 163 | 169 | C6H14N1O2Si | |
| aspartic acid 3TMS | 349 | 354 | 376 | C13H31NO4Si3 |
| 334 | 338 | 358 | C12H28NO4Si3 | |
| 306 | 309 | 330 | C11H28NO3Si3 | |
| 292 | 294 | 316 | C10H26NO3Si3 | |
| 232 | 235 | 250 | C9H22NO2Si2 | |
| 218 | 220 | 236 | C8H20NO2Si2 | |
| β-alanine 3TMS | 305 | – | – | C12H31NO2Si3 |
| 290 | – | 314 | C11H28NO2Si3 | |
| 248 | – | 272 | C9H26NOSi3 | |
| 232 | – | 250 | C9H22NO2Si2 | |
| 174 | – | 192 | C7H20NSi | |
| 86 | – | 92 | C3H6OSi | |
| citric acid 4TMS | 480 | – | – | C18H40O7Si4 |
| 465 | 471 | 498 | C17H37O7Si4 | |
| 375 | 381 | 399 | C14H27O6Si3 | |
| 363 | 368 | 390 | C14H31O5Si3 | |
| 347 | 352 | 371 | C13H27O5Si3 | |
| 273 | 278 | 291 | C11H21O4Si2 | |
| 3-phosphoglycerate 4TMS | 474 | C15H39O7PSi4 | ||
| 459 | 462 | 492 | C14H36O7PSi4 | |
| 387 | 387 | 423 | C12H36O4PSi4 | |
| 357 | 359 | 384 | C11H30O5PSi3 | |
| 315 | 315 | 342 | C9H28O4PSi3 | |
| 299 | 299 | 323 | C8H24O4PSi3 | |
| glycerol-3-phosphate 4TMS | 460 | C15H41O6PSi4 | ||
| 445 | 448 | 478 | C14H38O6PSi4 | |
| 387 | 387 | 423 | C12H36O4PSi4 | |
| 357 | 359 | 384 | C11H30O5PSi3 | |
| 341 | 343 | 365 | C10H26O5PSi3 | |
| 299 | 299 | 323 | C8H24O4PSi3 |
Table 2.
Fragments of TMS-Derivatized Compounds Part 2
| compound | m/z | m/z 13C | m/z d9-TMS | formula |
|---|---|---|---|---|
| glutamic acid 3TMS | 363 | 368 | 390 | C14H33NO4Si3 |
| 348 | 353 | 372 | C13H30NO4Si3 | |
| 320 | 324 | 344 | C12H30NO3Si3 | |
| 246 | 250 | 264 | C10H24NO2Si2 | |
| 230 | 234 | 245 | C9H20NO2Si2 | |
| glutamine 3TMS | 362 | 367 | 389 | C14H34N2O3Si3 |
| 347 | 352 | 371 | C13H31N2O3Si3 | |
| 273 | 278 | 291 | C11H25N2O2Si2 | |
| 245 | 249 | 263 | C10H25N2O1Si2 | |
| glycerol 3TMS | 308 | – | – | C12H32O3Si3 |
| 293 | 296 | 317 | C11H29O3Si3 | |
| 218 | 221 | 236 | C9H22O2Si2 | |
| 205 | 207 | 223 | C8H21O2Si2 | |
| glycine 3TMS | 291 | 293 | – | C11H29NO2Si3 |
| 276 | 278 | 300 | C10H26NO2Si3 | |
| 248 | 249 | 274 | C9H26NOSi3 | |
| 174 | 175 | 192 | C7H20NSi2 | |
| isoleucine 2TMS | 275 | – | – | C12H29NO2Si2 |
| 260 | 265, 266 | 275, 278 | C11H26NO2Si2 | |
| 232 | 237 | 247 | C10H26NOSi2 | |
| 218 | 220 | 236 | C8H20NO2Si2 | |
| 158 | 163 | 167 | C8H20NSi | |
| leucine 2TMS | 275 | – | – | C12H29NO2Si2 |
| 260 | 265, 266 | 275, 278 | C11H26NO2Si2 | |
| 232 | 237 | 247 | C10H26NOSi2 | |
| 218 | 220 | 236 | C8H20NO2Si2 | |
| 158 | 163 | 167 | C8H20NSi | |
| lysine 3TMS | 362 | 368 | 389 | C15H38N2O2Si3 |
| 347 | 353 | 371 | C14H35N2O2Si3 | |
| 200 | 206 | 209 | C9H18NO2Si | |
| 174 | 175 | 192 | C7H20NSi2 | |
| 156 | 161 | 165 | C8H18NSi | |
| lysine 4TMS | 434 | 440 | 470 | C18H46N2O2Si4 |
| 419 | 425 | 452 | C17H43N2O2Si4 | |
| 391 | 396 | 324 | C16H43N2OSi4 | |
| 317 | 322 | 344 | C14H37N2Si3 | |
| 174 | 175 | 192 | C17H20NSi2 | |
| malic acid 3TMS | 350 | 354 | 377 | C13H30O5Si3 |
| 335 | 339 | 359 | C12H27O5Si3 | |
| 307 | 311 | 331 | C11H27NO4Si3 | |
| 245 | 249 | 260 | C9H17O4Si2 | |
| 233 | 236 | 251 | C9H21O3Si2 |
Table 3.
Fragments of TMS-Derivatized Compounds Part 3
| compound | m/z | m/z 13C | m/z d9-TMS | formula |
|---|---|---|---|---|
| phenylalanine 2TMS | 309 | – | – | C15H27NO2Si2 |
| 294 | 303 | 309 | C14H24NO2Si2 | |
| 266 | 274 | 281 | C13H24NOSi2 | |
| 218 | 220 | 236 | C8H20NO2Si2 | |
| 192 | 200 | 201 | C11H18NSi | |
| proline 2TMS | 259 | – | – | C11H25NO2Si2 |
| 244 | 249 | 259 | C10H22NO2Si2 | |
| 216 | 220 | 231 | C9H22NOSi2 | |
| 142 | 146 | 151 | C7H16NSi | |
| serine 3TMS | 321 | – | – | C12H31NO3Si3 |
| 306 | 309 | 330 | C11H28NO3Si3 | |
| 278 | 280 | 302 | C10H28NO2Si3 | |
| 218 | 220 | 236 | C8H20NO2Si2 | |
| 204 | 206 | 222 | C8H22NOSi2 | |
| 188 | 190 | 203 | C7H18NOSi2 | |
| succinic acid 2TMS | 262 | 280 | C10H22O4Si2 | |
| 247 | 262 | C9H19O4Si2 | ||
| 172 | 181 | C7H12O3Si | ||
| threonine 3TMS | 335 | – | – | C13H33NO3Si3 |
| 320 | 324 | 344 | C12H30NO3Si3 | |
| 218 | 221 | 236 | C9H24NOSi | |
| tyrosine 2TMS | 325 | – | – | C15H27NO3Si2 |
| 310 | 319 | 325 | C14H24NO3Si2 | |
| 282 | 290 | 297 | C13H24NO2Si2 | |
| 208 | 216 | 217 | C11H18NOSi | |
| 192 | 200 | 198 | C10H14NOSi | |
| tyrosine 3TMS | 397 | – | – | C18H35NO3Si3 |
| 382 | 391 | 406 | C17H32NO3Si3 | |
| 354 | 362 | 378 | C16H32NO2Si3 | |
| 280 | 288 | 298 | C14H26NOSi2 | |
| 218 | 220 | 236 | C8H20NO2Si2 | |
| uracil 2TMS | 256 | 260 | 284 | C10H20N2O2Si2 |
| 241 | 245 | 256 | C9H17N2O2Si2 | |
| valine 2TMS | 261 | – | – | C11H27NO2Si2 |
| 246 | 251 | 261 | C10H24NO2Si2 | |
| 218 | 220, 222 | 233, 236 | C9H24NOSi2 |
The calculation time for this algorithm is dependent on the size of the molecule and the maximum cut size. For small molecules like N,O-bis-(trimethylsilyl)-glycine the run time is in the range of miliseconds, whereas for bigger molecules like (1Z)-O-methyloxime-2,3,4,5,6-pentakis-O-(trimethylsilyl)-glucose the run time is in the range of seconds on a standard PC.
CONCLUSION
In this article, we present FFC as an algorithm to not only calculate chemical formulas but also retained atoms of a compound in its mass spectrometric fragment ions. Knowing the correct number and position of specific atoms present in a fragment ion is of great significance for MFA. Although only carbon atoms were tracked in the validation experiment, in theory any element's fate (e.g., nitrogen, sulfur, and hydrogen) can be followed with this algorithm. We provide an easy to use software with a user-friendly graphical interface. Due to the combinatorial nature of our approach, it is not necessary to model the fragmentation based on a rule set, such as the preferred site of ionization or the bonds most likely to break. This also allows the calculation of chemical formulas for compounds where no similar fragmentation mechanism is known. However, identical structural groups present in the compound of interest can complicate interpretation when there is ambiguity in the results (e.g., alkanes, sugars, or fatty acids). To further filter out incorrect formulas, FFC can integrate results of a stable isotope labeling experiment to exclude results that do not fit the labeling pattern. In this article, we showed that this algorithm can be successfully applied to a wide range of biochemical compounds by identifying the chemical formulas and carbon backbone combinations for a wide range of compounds.
FFC is freely available under http://www.ffc.lu. Currently, installable packages for Linux (Debian, Red Hat packages), Mac OS, and Windows are provided.
Supplementary Material
ACKNOWLEDGMENTS
The authors gratefully thank Kazunori Sawada and Patrick May for their constructive comments. The authors acknowledge financial support from the Fonds National de la Recherche (FNR). Specifically, K.H. and D.W. are funded by the ATTRACT program Metabolomics Junior Group, A.W. is supported by the AFR Grant 1328318, and S.C.S. is supported by the HICE virtual institute.
Footnotes
The authors declare no competing financial interest.
ASSOCIATED CONTENT
Supporting Information
Additional information as noted in text. This material is available free of charge via the Internet at http://pubs.acs.org.
REFERENCES
- 1.Antoniewicz MR. Ph.D. thesis. Massachusetts Institute of Technology; 2006. Comprehensive Analysis of Metabolic Pathways Through the Combined Use of Multiple Isotopic Tracers. [Google Scholar]
- 2.Sauer U. Mol. Syst. Biol. 2006;2:62. doi: 10.1038/msb4100109. [DOI] [PMC free article] [PubMed] [Google Scholar]
- 3.Antoniewicz MR, Kelleher JK, Stephanopoulos G. Anal. Chem. 2007;79:7554–7559. doi: 10.1021/ac0708893. [DOI] [PubMed] [Google Scholar]
- 4.Antoniewicz MR, Kelleher JK, Stephanopoulos G. Metab. Eng. 2007;9:68–86. doi: 10.1016/j.ymben.2006.09.001. [DOI] [PMC free article] [PubMed] [Google Scholar]
- 5.Villas-Boas SG, Moxley JF, Akesson M, Stephanopoulos G, Nielsen J. The Biochemical Journal. 2005;388:669–677. doi: 10.1042/BJ20041162. [DOI] [PMC free article] [PubMed] [Google Scholar]
- 6.Nöh K, Grönke K, Luo B, Takors R, Oldiges M, Wiechert W. Journal of Biotechnology. 2007;129:249–267. doi: 10.1016/j.jbiotec.2006.11.015. [DOI] [PubMed] [Google Scholar]
- 7.Metallo CM, Gameiro P. a., Bell EL, Mattaini KR, Yang J, Hiller K, Jewell CM, Johnson ZR, Irvine DJ, Guarente L, Kelleher JK, Vander Heiden MG, Iliopoulos O, Stephanopoulos G. Nature. 2012;481:380–384. doi: 10.1038/nature10602. [DOI] [PMC free article] [PubMed] [Google Scholar]
- 8.Wegner A, Cordes T, Michelucci A, Hiller K. Current Biotechnology. 2012;1:88–97. [Google Scholar]
- 9.Niklas J, Priesnitz C, Rose T, Sandig V, Heinzle E. Appl. Microbiol. Biotechnol. 2012;93:1637–1650. doi: 10.1007/s00253-011-3526-6. [DOI] [PubMed] [Google Scholar]
- 10.McGuirk S, Gravel S-P, Deblois G, Papadopoli DJ, Faubert B, Wegner A, Hiller K, Avizonis D, Akavia UD, Jones RG, Giguére V, St-Pierre J. Cancer and Metabolism. 2013;1:22. doi: 10.1186/2049-3002-1-22. [DOI] [PMC free article] [PubMed] [Google Scholar]
- 11.Michelucci A, Cordes T, Ghelfi J, Pailot A, Reiling N, Goldmann O, Binz T, Wegner A, Tallam A, Rausell A, Buttini M, Linster CL, Medina E, Balling R, Hiller K. Proc. Natl. Acad. Sci. U.S.A. 2013;110:7820–7825. doi: 10.1073/pnas.1218599110. [DOI] [PMC free article] [PubMed] [Google Scholar]
- 12.Hiller K, Metallo CM, Kelleher JK, Stephanopoulos G. Anal. Chem. 2010;82:6621–6628. doi: 10.1021/ac1011574. [DOI] [PubMed] [Google Scholar]
- 13.McLafferty FW, Turecek FJ. Chem. Educ. 1994;71:A54. [Google Scholar]
- 14.HighChem Mass Frontier 7.0. Highchem; Bratislava, Slovakia: 2011. [Google Scholar]
- 15.Wolf S, Schmidt S, Müller-Hannemann M, Neumann S. BMC Bioinf. 2010;11:148. doi: 10.1186/1471-2105-11-148. [DOI] [PMC free article] [PubMed] [Google Scholar]
- 16.Heinonen M, Rantanen A, Mielikäinen T, Kokkonen J, Kiuru J, Ketola RA, Rousu J. Rapid Commun. Mass Spectrom. 2008;22:3043–3052. doi: 10.1002/rcm.3701. [DOI] [PubMed] [Google Scholar]
- 17.Stein SE, Scott DR. J. Am. Soc. Mass Spectrom. 1994;5:859–866. doi: 10.1016/1044-0305(94)87009-8. [DOI] [PubMed] [Google Scholar]
- 18.Fernandez CA, Des Rosiers C, Previs SF, David F, Brunengraber HJ. Mass Spectrom. 1996;31:255–262. doi: 10.1002/(SICI)1096-9888(199603)31:3<255::AID-JMS290>3.0.CO;2-3. [DOI] [PubMed] [Google Scholar]
- 19.Hiller K, Hangebrauk J, Jäager C, Spura J, Schreiber K, Schomburg D. Anal. Chem. 2009;81:3429–3439. doi: 10.1021/ac802689c. [DOI] [PubMed] [Google Scholar]
- 20.Hiller K, Wegner A, Weindl D, Cordes T, Metallo CM, Kelleher JK, Stephanopoulos G. Bioinformatics (Oxford, England) 2013;29:1226–1228. doi: 10.1093/bioinformatics/btt119. [DOI] [PMC free article] [PubMed] [Google Scholar]
- 21.Wegner A, Sapcariu SC, Weindl D, Hiller K. Anal. Chem. 2013;85:4030–4037. doi: 10.1021/ac303774z. [DOI] [PubMed] [Google Scholar]
- 22.Dezso B, Jüttner A, Kovács P. Electronic Notes in Theoretical Computer Science. 2011;264:23–45. [Google Scholar]
Associated Data
This section collects any data citations, data availability statements, or supplementary materials included in this article.