

Abstract
Objective
To characterize prevalence, incidence and associated correlates of HIV infection among MSM in 12 cities across India.
Design
Cross-sectional sample using respondent-driven sampling (RDS) from September 2012-June 2013
Methods
A total 12,022 MSM (∼1000 per city) were recruited. Participants had to be ≥18 years, self-identify as male and report oral/anal intercourse with a man in the prior year. HIV infection was diagnosed using 3 rapid tests. Cross-sectional HIV incidence was estimated using a multi-assay algorithm. All estimates incorporate RDS-II weights.
Results
Median age was 25 years, 45.0% self-identified as “panthi” (predominantly penetrative anal intercourse) and 30.6% reported being married to a woman. Weighted HIV prevalence was 7.0% (range: 1.7% to 13.1%). In multivariate analysis, significantly higher odds of HIV infection was observed among those who were older, had lower educational attainment, were practicing purely receptive anal sex or both receptive and penetrative sex and those who were HSV-2 positive. Of 1,147 MSM who tested HIV positive, 53 were identified as recent HIV infections (annualized incidence = 0.87%; range = 0 to 2.2%). In multivariate analysis, injecting drugs in the prior 6 months, syphilis, higher number of male partners and fewer female partners were significantly associated with recent HIV infection.
Conclusions
We observed a high burden of HIV among MSM in India with tremendous diversity in prevalence, incidence and risk behaviors. In particular, we observed high incidence in areas with relatively low prevalence suggesting emerging epidemics in areas not previously recognized to have high HIV burden.
Keywords: HIV/AIDS, men who have sex with men, key populations, India, resource-limited setting, prevalence, incidence
Introduction
Limited large-scale epidemiological studies of HIV infection among men who have sex with men (MSM) exist in resource-limited settings (RLS) as these HIV epidemics have been driven predominantly by heterosexual transmission, MSM are stigmatized, and homosexual sex is a punishable offence in 82 countries worldwide[1-3]. Curbing the HIV epidemic among MSM in RLS has been recognized as one of the principal contemporary challenges in HIV prevention[4].
India, similar to other RLS, has made exceptional progress in reducing HIV burden over the past decade, achieving 25% decline in prevalence between 2001 and 2009[5]. However, much of this decline is reflective of declines in heterosexual populations whereas HIV prevalence among MSM remains unchanged[6]. It is estimated that there are 2.35 million high-risk MSM in India[7] – however, estimates suggest the prevalence of same-sex behavior among adult men is as high as 9% - 11% (translating to ∼45 million MSM)[8,9]. Precise community-based estimates of risk behaviors and HIV burden among MSM in India have been challenging because anal intercourse (“sodomy”) is punishable by imprisonment[10] and cultural norms stipulate marriage to women forcing MSM to remain hidden[11].
We characterized prevalence, incidence and associated correlates of HIV infection among MSM from 12 cities in different regions of India, representing one of the largest population-based studies among MSM in India.
Methods
Study setting
This study was conducted in 12 cities (Belgaum, Bengaluru, Bhopal, Chennai, Coimbatore, Delhi, Hyderabad, Lucknow, Madurai, Mangalore, Vijaywada, and Vishakapatnam) across six Indian states as part of the baseline assessment of a cluster-randomized trial (ClinicalTrials.gov Identifier: NCT01686750) (Figure 1)[12]. The cities were selected jointly by study investigators and the National AIDS Control Organization (NACO), India to represent cities with established HIV epidemics among MSM (e.g., Chennai), smaller cities in high-prevalence states (e.g., Vijaywada) and cities with anecdotal evidence of HIV among MSM but no published reports (e.g., Bhopal). In each city, a local organization was identified based on prior history of working with MSM that had, at a minimum, a drop-in center for MSM that provided some HIV prevention services.
Figure 1. HIV prevalence and incidence by site.
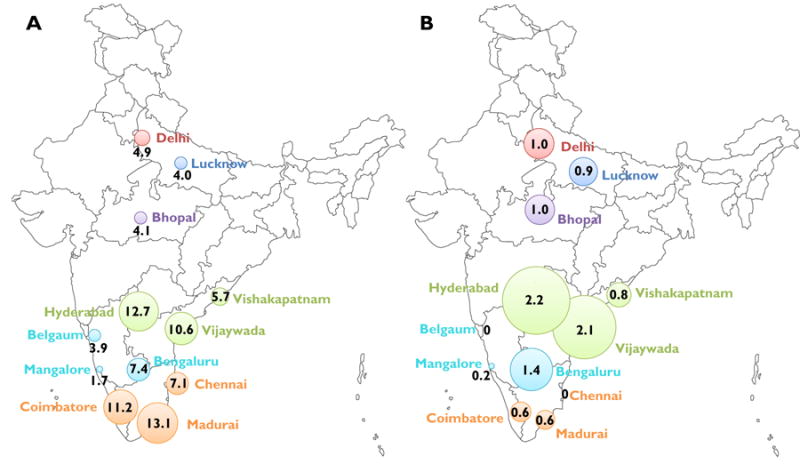
Sites represent cities with established HIV epidemics among MSM (Chennai, Hyderabad, Bengaluru), smaller cities in high-prevalence states (Coimbature, Madurai, Vijaywada, Vishakapatnam, Managlore, Bangalore) and cities with anecdotal reports of HIV among MSM but no published reports (Bhopal, Lucknow, Belgaum). Each color represents a different Indian state.
Study Population
Eligibility criteria included: (1) age ≥ 18 years; (2) self-identify as biologically male; (3) report oral or anal sex with another man in the prior 12 months; (4) provide informed consent; and (5) possess a valid RDS referral coupon (except for “seeds”). Participants who self-identified as female or transgender (“hijra”) were excluded.
Study Procedures
The study population was recruited using respondent-driven sampling (RDS), primarily to accrue a sample considered representative of the target population[12-14]. Detailed information on the implementation of RDS and study procedures are provided in the Supplementary Methods. Briefly, in all sites (except one) 2 “seeds” were used to recruit ∼1000 MSM. Study procedures included informed consent, fingerprint capture to prevent duplicate recruitment within and across sites, a survey and blood draw.
Laboratory Methods
Participants provided a blood sample for HIV, HSV-2 and syphilis testing, and, if HIV-infected, for CD4+ count, HIV-1 RNA, and serologic assays for HIV incidence estimation. HIV infection was diagnosed on-site using three rapid tests as per NACO, India guidelines. HSV-2 infection was diagnosed by presence of antibodies (IgG) to HSV-2. Syphilis was diagnosed using a RPR Test Kit and confirmed using a TPHA test kit (see Supplementary Methods for kit information).
Cross-sectional estimation of HIV incidence was based on a multi-assay algorithm (MAA) validated for HIV Subtype C[15] – the predominant subtype in India[16]. It included four tests – CD4 cell count, HIV-1-RNA level, Aware™ BED™ EIA HIV-1 Incidence Test and an avidity assay. The following criteria (BED-CEIA <1.0 OD-n, avidity index <80%, CD4 cell count >200 cells/mm3 and HIV viral load >400 copies/ml) corresponding to a window period of 0.56 years were used to estimate HIV incidence[15].
Statistical Analyses
RDS process measures were examined to assess RDS assumptions (see Supplementary Methods). Data from “seeds” were excluded from analyses. The RDS-II estimator (Volz-Heckathorn estimator), which weights estimates for network size (number of MSM in the city whom the participant saw in the prior 30 days), was used to calculate site-level proportions[13]. Unweighted estimates are provided in Supplementary Tables. For factors pooled across sites, we used a composite weight accounting for the relative population size of adult men 15-59 years of age in each city [17] (assuming similar proportion of MSM across cities) in addition to the RDS-II weight.
Correlates of prevalent HIV were identified using multi-level logistic regression models (odds ratios [OR]) and correlates of incident HIV using multi-level Poisson regression models (cumulative incidence ratios or risk ratios [RR]) excluding prevalent HIV cases. Both models included random-intercepts for site (to account for clustering) and scaled RDS-II weights. For the prevalence analysis, we considered lifetime risk behaviors and for the incidence analysis we considered risk behaviors in the prior six months, as the window period for the MAA algorithm was 205 days. Factors associated at p<0.10 in univariable models were considered for inclusion in multivariable models. In addition, certain demographic factors (e.g., age, marital status) and behavioral characteristics (e.g., lifetime number of male partners and history of sex work) were considered for inclusion regardless of statistical significance. With the exception of age, which was included regardless of statistical significance, only factors associated with the outcome at p<0.05 in adjusted models were retained in final multivariable models. As sensitivity analyses, regression analyses were performed unweighted and using RDS-I weights (Sanlganik-Heckathorn estimator) – all inferences remained unchanged.
All statistical analyses were performed using the RDS Analyst Software version 0.1 (http://hpmrg.org) and STATA version 12.0 (STATA Corp., College Station, Texas, USA).
Ethical clearances
This study was approved by the Johns Hopkins Bloomberg School of Public Health and the YR Gaitonde Centre for AIDS Research and Education institutional review boards.
Results
Demographics and risk behaviors
A total 12,022 MSM (including 25 “seeds”) were recruited between September 30, 2012 and June 24, 2013. The median age was 25 years (interquartile range [IQR]: 21 - 32 years); 45.0% self-identified as “panthi” (prefer penetrative anal intercourse only), 14.0% as “kothi” (prefer receptive anal intercourse only) and 18.0% as “double deckers” (engage in both).
Overall, 30.6% reported being currently married to a woman. The median age at first sexual act with a man was 18 years (IQR: 16 – 21 years) and the median number of lifetime male partners was 8 (IQR: 3 – 24). Half (50.3%) reported unprotected anal intercourse with a man in the prior 6 months.
Weighted site-level data are in Table 1. The median age across sites ranged from 21 to 30 years and the proportion married to a woman ranged from 15.1% - 57.7%. Across sites, 16.5% - 68.9% were panthi, 4.9% - 29.6% kothi and 5.8% - 41.8% double decker. The median age at first sexual intercourse with a man ranged from 17 to 20 years and the median lifetime male partners ranged from three to 20. History of sex work ranged from 8.5% to 46.9%. See Supplementary Table 2 for unweighted estimates.
Table 1. Demographics and risk behaviors among MSM by site (n=11,997)*.
| Sample Size (seeds) | Andhra Pradesh | Karnataka | Tamil Nadu | Central and North India | ||||||||
|---|---|---|---|---|---|---|---|---|---|---|---|---|
|
| ||||||||||||
| HYD | VJW | VZG | BLR | BGM | MLR | CHE | CMB | MAD | BHO | DEL | LKW | |
| 998 (2) | 1000 (2) | 1000 (2) | 1000 (2) | 1003 (2) | 1000 (2) | 1000 (2) | 1000 (2) | 1001 (2) | 998 (2) | 997 (3) | 1000 (2) | |
| Median age in years (IQR) | 25 (22-31) | 27 (24-32) | 23 (20-28) | 29 (25-37) | 29 (22-40) | 30 (21-39) | 25 (21-31) | 30 (24-39) | 25 (21-32) | 21 (20-24) | 22 (19-27) | 23 (20-29) |
| Median network size (IQR) | 10 (4-20) | 20 (10-30) | 60 (20-100) | 4 (2-10) | 4 (2-8) | 16 (8-36) | 8 (4-15) | 14 (7-25) | 10 (4-20) | 5 (3-10) | 10 (3-20) | 4 (2-9) |
| Marital status | ||||||||||||
| Never married | 60.8 | 56.4 | 66.2 | 61.1 | 41.3 | 49.4 | 75.5 | 30.2 | 64.1 | 73.7 | 66.3 | 63.7 |
| Currently married to a woman | 28.3 | 37.4 | 24.4 | 31.8 | 57.7 | 45.2 | 21.1 | 42.7 | 30.9 | 15.1 | 23.6 | 24.8 |
| Sexual Identity | ||||||||||||
| Panthi | 40.4 | 52.4 | 42.3 | 16.5 | 50.8 | 22.8 | 22.5 | 42.4 | 41.1 | 41.5 | 68.9 | 44.8 |
| Kothi | 17.8 | 15.1 | 19.7 | 11.9 | 8.4 | 10.4 | 14.3 | 29.6 | 13.6 | 6.7 | 12.7 | 4.9 |
| Double Decker | 22.4 | 21.3 | 27.2 | 23.2 | 15.8 | 21.4 | 15.8 | 20.4 | 41.8 | 33.5 | 7.8 | 5.8 |
| Gay/MSM | 2.4 | 0.02 | 0.3 | 4.4 | 15.2 | 12.8 | 44.0 | 3.7 | 2.9 | 4.5 | 1.2 | 17.7 |
| Bisexual | 17.0 | 11.2 | 10.5 | 44.1 | 9.7 | 32.6 | 3.4 | 4.0 | 0.6 | 13.8 | 9.5 | 26.7 |
| Median age at first sexual act with a man in years (IQR) | 19 (17-22) | 20 (18-22) | 18 (17-19) | 20 (18-24) | 20 (18-23) | 18 (17-21) | 19 (17-22) | 18 (17-21) | 19 (18-22) | 17 (15-19) | 17 (15-20) | 18 (15-20) |
| Median number of male partners in lifetime (IQR) | 12 (5-30) | 20 (10-50) | 20 (9-80) | 10 (4-20) | 3 (1-6) | 7 (3-16) | 12 (4-30) | 20 (7-60) | 5 (2-15) | 5 (3-12) | 5 (2-15) | 4 (2-8) |
| Unprotected sex with man in the prior 6 months | 35.8 | 47.0 | 50.5 | 37.1 | 38.2 | 64.4 | 46.3 | 52.2 | 38.6 | 73.7 | 57.7 | 71.3 |
| Ever had sex with a woman | 68.9 | 83.5 | 77.5 | 67.3 | 68.0 | 78.4 | 62.6 | 66.4 | 75.1 | 85.6 | 85.7 | 86.2 |
| Median number of female partners in lifetime (IQR) | 1 (0-4) | 6 (1-20) | 4 (1-12) | 1 (0-4) | 1 (0-3) | 3 (1-6) | 1 (0-5) | 1 (0-3) | 1 (0-5) | 3 (1-8) | 3 (1-8) | 3 (1-6) |
| Alcohol Dependence** | ||||||||||||
| No dependence | 79.6 | 45.9 | 53.1 | 70.6 | 71.6 | 68.2 | 58.1 | 54.0 | 42.4 | 64.5 | 73.1 | 78.4 |
| Mild dependence | 14.2 | 25.9 | 29.3 | 22.3 | 16.4 | 12.8 | 22.4 | 15.3 | 27.8 | 19.6 | 16.0 | 13.8 |
| Harmful/hazardous | 6.2 | 28.2 | 17.6 | 7.0 | 12.0 | 19.0 | 19.5 | 30.7 | 29.7 | 15.9 | 10.9 | 7.8 |
| Lifetime history of sex work | 27.1 | 33.2 | 46.9 | 8.5 | 14.7 | 20.0 | 12.3 | 31.5 | 18.2 | 19.9 | 10.5 | 18.7 |
| Circumcised | 25.4 | 12.5 | 4.8 | 9.6 | 11.2 | 32.3 | 7.5 | 10.4 | 12.6 | 21.1 | 15.1 | 34.5 |
| HIV prevalence | 12.7 | 10.6 | 5.7 | 7.4 | 3.8 | 1.7 | 7.1 | 11.2 | 13.1 | 4.1 | 4.9 | 4.0 |
| HSV-2 prevalence | 30.9 | 27.5 | 20.1 | 24.1 | 16.5 | 16.6 | 15.5 | 22.5 | 17.0 | 7.1 | 16.4 | 12.7 |
| Syphilis prevalence | 3.9 | 4.4 | 2.1 | 4.0 | 0.8 | 1.4 | 1.1 | 3.0 | 1.8 | 1.3 | 3.5 | 4.1 |
| Ever injected drugs | 0.3 | 3.1 | 3.4 | 0.1 | 0.3 | 1.4 | 1.2 | 0.6 | 1.2 | 2.9 | 0.4 | 1.3 |
All estimates presented at RDS-II weighted – refer to supplemental material for unweighted estimates; SITES: HYD – Hyderabad; VJW – Vijaywada; VZG – Vishakapatnam; BLR – Bengaluru; BGM – Belgaum; MLR – Mangalore; CHE – Chennai; CMB – Coimbatore; MAD – Madurai; BHO – Bhopal; DEL – New Delhi; LKW – Lucknow; MSM – men who have sex with men; IQR – interquartile range
Alcohol dependence measured using AUDIT.
Prevalence of HIV and STIs
Weighted HIV prevalence was 7.0% (95% CI: 6.8, 7.3). Across sites, Madurai had the highest weighted HIV prevalence (13.1%) followed by Hyderabad (12.7%) (Figure 1A). Crude HIV prevalence was higher than weighted prevalence in all cities except Madurai, Chennai and Lucknow (Table 2). HSV-2 prevalence ranged from 30.9% in Hyderabad to 7.1% in Bhopal. Syphilis prevalence ranged from 0.8% in Belgaum to 4.4% in Vijaywada.
Table 2. HIV Prevalence and Incidence by site.
| RDS-II weighted Prevalence | Unweighted Prevalence | Annualized Incidence (unweighted) | ||||
|---|---|---|---|---|---|---|
|
| ||||||
| Prevalence (%) | 95% CI | Prevalence (%) | 95% CI | Annualized Incidence (%) | 95% CI | |
| Hyderabad | 12.7 | 9.8, 15.5 | 18.8 | 16.4, 21.3 | 2.2 | 0.8, 3.6 |
| Vijaywada | 10.6 | 8.1, 13.1 | 13.5 | 11.4, 15.6 | 2.1 | 0.8, 3.4 |
| Vishakapatnam | 5.7 | 4.2, 7.2 | 11.6 | 9.6, 13.6 | 0.8 | 0.01, 1.6 |
| Bengaluru | 7.4 | 5.3, 9.4 | 9.1 | 7.3, 10.9 | 1.4 | 0.3, 2.4 |
| Belgaum | 3.9 | 2.4, 5.3 | 5.99 | 4.5, 7.5 | 0.0 | NC |
| Mangalore | 1.7 | 0.02, 3.3 | 2.0 | 1.1, 2.9 | 0.2 | 0, 0.5 |
| Chennai | 7.1 | 5.9, 8.4 | 6.6 | 5.1, 8.1 | 0 | NC |
| Coimbatore | 11.2 | 8.3, 14.2 | 15.9 | 13.6, 18.2 | 0.6 | 0, 1.4 |
| Madurai | 13.1 | 9.8, 16.5 | 13.0 | 10.9, 15.1 | 0.6 | 0, 1.3 |
| Bhopal | 4.1 | 2.5, 5.7 | 6.1 | 4.6, 7.6 | 1.0 | 0.1, 1.8 |
| Lucknow | 4.0 | 2.3, 5.7 | 4.0 | 2.8, 5.2 | 0.9 | 0.1, 1.8 |
| New Delhi | 4.9 | 2.9, 7.0 | 8.2 | 6.3, 9.7 | 1.0 | 0.1, 1.8 |
NC – not calculated
Correlates of prevalent HIV infection
In univariable analyses, older age, being married to a woman, self identifying as kothi or double-decker, practicing purely receptive anal intercourse or both receptive and penetrative sex, more lifetime male partners, lifetime history of sex work, self-reported history of any STI and HSV-2 infection were significantly associated with higher odds of HIV (p<0.05 for all). Higher educational attainment was associated with decreased odds of prevalent HIV (p<0.05).
In multivariable analysis, significantly higher odds of HIV infection were observed among those who were older (odds ratio [OR]: 1.39 per 10 year increase; 95% confidence interval [CI]: 1.10, 1.75), currently married (OR: 1.38; 95% CI: 1.03, 1.86), practicing purely receptive or both receptive and penetrative sex (OR relative to purely penetrative sex: 1.95 and 1.61, respectively), those with more lifetime male partners (OR for >300 partners compared to 1-5 partners: 2.06; 95% CI: 1.03, 4.09), those with a lifetime history of an STI (OR: 2.40; 95% CI: 1.70, 3.39) and those who were HSV-2 positive (OR: 7.43; 95% CI: 5.81, 9.50). Higher educational attainment was negatively associated with HIV (OR for vocational/college/postgraduate vs. primary school or less = 0.47; 95% CI: 0.29, 0.78; Table 3). Supplementary Table 3 reports unweighted estimates.
Table 3. Correlates of prevalent HIV infection among MSM in India.
| Unadjusted | Adjusted | |||
|---|---|---|---|---|
|
| ||||
| Odds Ratio | 95% Confidence Interval |
Odds Ratio | 95% Confidence Interval |
|
| Age (per 10 years) | 2.20 | 1.71, 2.83 | 1.39 | 1.10, 1.75 |
| Marital status | ||||
| Never married | 1 | 1 | ||
| Currently married/Living with partner | 2.91 | 1.87, 4.53 | 1.38 | 1.03, 1.86 |
| Other | 4.24 | 1.65, 10.90 | 1.77 | 0.84, 3.72 |
| Education | ||||
| Primary school or less | 1 | 1 | ||
| Secondary school | 0.61 | 0.44, 0.84 | 0.73 | 0.58, 0.93 |
| High School | 0.28 | 0.15, 0.52 | 0.41 | 0.27, 0.64 |
| Vocational/College/Post-graduate | 0.27 | 0.14, 0.54 | 0.47 | 0.29, 0.78 |
| Sexual identity1 | ||||
| Panthi | 1 | |||
| Kothi | 4.32 | 2.55, 7.34 | -- | -- |
| Double-decker | 1.90 | 1.00, 3.63 | ||
| Gay/MSM | 1.13 | 0.44, 2.90 | ||
| Bisexual | 1.29 | 0.73, 2.28 | ||
| Religion | ||||
| Hinduism | 1 | |||
| Christianity | 0.97 | 0.76, 1.24 | -- | -- |
| Islam | 0.73 | 0.45, 1.18 | ||
| Other | 0.46 | 0.08, 2.79 | ||
| Age at first sex (per 10 years) | 1.18 | 0.82, 1.70 | -- | -- |
| Age at first sex with man (per 10 years) | 1.27 | 0.89, 1.80 | -- | -- |
| Lifetime male sexual partners | ||||
| 1 to 5 | 1 | 1 | ||
| 6 to 15 | 1.28 | 0.85, 1.94 | 0.97 | 0.61, 1.55 |
| 16 to 60 | 2.03 | 1.25, 3.30 | 1.13 | 0.63, 2.05 |
| 61 to 300 | 4.36 | 2.54, 7.48 | 1.55 | 0.82, 2.95 |
| 301 or more | 7.58 | 4.22, 13.6 | 2.06 | 1.03, 4.09 |
| Type of anal sex with man | ||||
| Only penetrative | 1 | 1 | ||
| Only receptive | 3.82 | 2.40, 6.08 | 1.95 | 1.21, 3.14 |
| Both penetrative and receptive | 2.19 | 1.48, 3.24 | 1.61 | 1.23, 2.11 |
| Neither | 1.09 | 0.78, 1.51 | 1.09 | 0.83, 1.44 |
| Ever sex with woman | 0.87 | 0.57, 1.34 | -- | -- |
| Lifetime female sexual partners | ||||
| None | 1 | |||
| 1 to 2 | 1.04 | 0.83, 1.31 | ||
| 3 to 5 | 0.70 | 0.37, 1.34 | -- | -- |
| 6 to 20 | 0.75 | 0.39, 1.46 | ||
| 21 or more | 0.86 | 0.34, 2.19 | ||
| Lifetime history of sex work2 | 1.78 | 1.14, 2.78 | -- | -- |
| Circumcised | 0.82 | 0.54, 1.25 | -- | -- |
| HSV-2 positive | 11.50 | 8.41, 15.7 | 7.43 | 5.81, 9.50 |
| Ever injected drugs | 4.50 | 0.91, 22.35 | -- | -- |
Odds ratios from multi-level logistic regression models with random intercepts to account for clustering by site and scaled RDS-II weights among 11,525 persons with complete data on all covariates
Sexual identity was moderately collinear with type of anal sex; therefore, it was not included in the multivariate model.
Sex work did not remain statistically significant after adjustment for other correlates; therefore, it was not included in the final multivariate model presented.
HIV incidence and correlates
Of 1,146 HIV positive MSM, 53 were identified as recently infected. Overall, the annualized incidence was 0.87%, and the site with the highest HIV incidence was Hyderabad (2.20%) followed by Vijayawada (2.06%; Figure 1B).
Increasing number of male partners, identifying as kothi, self-reported unusual genital/rectal discharge in the prior 6 months, and concurrent syphilis and HSV-2 were positively associated with HIV incidence in univariable analysis (p<0.05 for all, Table 4). Higher education and more female partners in the prior 6 months were negatively associated with HIV incidence (p<0.05 for all). Younger age and injecting drugs in the prior 6 months were marginally associated with higher HIV incidence (p<0.10).
Table 4. Correlates of HIV incidence among MSM in India.
| Unadjusted | Adjusted | |||
|---|---|---|---|---|
|
| ||||
| Risk ratio | 95% Confidence Interval |
Risk ratio | 95% Confidence Interval |
|
| Age (scaled by 10 years) | 0.70 | 0.49, 1.01 | 0.63 | 0.44, 0.91 |
| Marital status | ||||
| Never married | 1 | |||
| Currently married/Living with partner | 0.70 | 0.32, 1.52 | -- | -- |
| Other | 1.30 | 0.42, 4.02 | ||
| Education | ||||
| Primary school or less | 1 | 1 | ||
| Secondary school | 0.53 | 0.23, 1.23 | 0.57 | 0.25, 1.30 |
| High School | 0.14 | 0.03, 0.76 | 0.14 | 0.03, 0.71 |
| Vocational/College/Post-graduate | 0.89 | 0.24, 3.27 | 0.76 | 0.16, 3.56 |
| Sexual identity | ||||
| Panthi | 1 | |||
| Kothi | 2.40 | 1.35, 4.26 | -- | -- |
| Double-decker | 1.37 | 0.41, 4.58 | ||
| Gay/MSM | 0.89 | 0.18, 4.46 | ||
| Bisexual | 0.85 | 0.28, 2.57 | ||
| Number of male partners in the prior 6 months (per 5 partner increase) | 1.04 | 1.02, 1.05 | 1.02 | 1.00, 1.04 |
| Type of anal sex with last 4 male partners | ||||
| Only penetrative | 1 | |||
| Only receptive | 3.27 | 0.76, 14.2 | -- | -- |
| Both penetrative and receptive | 1.30 | 0.28, 6.07 | ||
| Neither | 1.09 | 0.16, 7.56 | ||
| Always used condom with a man in the prior 6 months | 1.38 | 0.76, 2.51 | -- | -- |
| Number of female partners in the prior 6 months | ||||
| None | 1 | 1 | ||
| 1-2 | 0.37 | 0.22, 0.62 | 0.41 | 0.27, 0.64 |
| 3 or more | 0.05 | 0.01, 0.35 | 0.04 | 0.004, 0.43 |
| HSV-2 positive | 3.27 | 1.17, 9.10 | 3.46 | 1.19, 10.0 |
| Syphilis | 6.84 | 3.21, 14.6 | 5.43 | 2.39, 12.4 |
| Unusual genital or anal/rectal discharge in last 6 mo. | 4.29 | 1.55, 11.9 | 2.52 | 1.01, 6.32 |
| Injected drugs in prior 6 months | 7.58 | 0.87, 66.0 | 12.36 | 2.87, 53.3 |
Risk (Cumulative incidence) ratio from multi-level Poisson regression models with random intercepts to account for clustering by site and scaled RDS-II weights among 10,877 persons with complete data on all covariates; HIV prevalent positives were excluded from this analysis.
In multivariable analyses, increasing number of male partners (RR per 5 partner increase: 1.02; 95% CI: 1.00, 1.04), HSV-2 infection (RR: 3.46; 95% CI: 1.19, 10.01) syphilis (RR: 5.43; 95% CI: 2.39, 12.4) and genital discharge (RR: 2.52; 95% CI: 1.01, 6.32) remained significantly associated with HIV incidence. Increasing number of female partners (RR for >3 female partners compared vs. none: 0.04; 95% CI: 0.004, 0.43) and education (RR for high school vs. primary school or less: 0.14; 95% CI: 0.03, 0.71) remained significantly negatively associated with HIV incidence. Injecting drugs in the prior 6 months (RR: 12.4; 95% CI: 2.87; 53.2) became statistically significant after accounting for other covariates.
Discussion
Using RDS, we recruited a large sample of MSM in a short period of time. Our data demonstrate a high HIV burden among MSM in India overall, but very diverse epidemics in terms of HIV prevalence, incidence and associated risk behaviors. In particular, sites with the highest HIV incidence were not necessarily those with the highest HIV prevalence, suggesting potentially escalating epidemics among MSM in cities where HIV burden has previously been low.
While there have been prior reports of HIV among MSM in India[18-25], certain characteristics distinguish this study. This study presents data among MSM in cities such as Belgaum, Bhopal, New Delhi, Lucknow, Mangalore and Vijayawada where limited previous data exist. Second, this study represents a community-based sample utilizing a recruitment method (RDS) that allows for a representative estimate of HIV burden in the underlying population whereas prior studies were based on convenience samples from settings such as STI clinics. Third, our sample size (12,022 overall) is among the largest among MSM in India to date. Finally, these data represent one of few estimates of HIV incidence among MSM in India.
The HIV prevalence observed is consistent with other reports from India and further substantiates the high burden in this vulnerable population[23,26-30], despite overall declines in HIV prevalence in the general population in India[5]. These findings highlight the need to strengthen health systems to incorporate MSM into HIV programming. The National AIDS Control Program Phase IV has identified MSM as a high priority area – however, MSM need to be targeted by HIV programming not only in urban areas and high HIV prevalence states but also in regions where there has previously been little focus. For example, HIV prevalence among MSM in Bhopal (which is in a low HIV prevalence state) was 6.1%, almost 90 times higher than the prevalence in the general population (0.07%)[31].
Correlates of prevalent HIV are also consistent with reports from India[18-20,23,26-28]. Being married remained consistently associated with a higher likelihood of being HIV-infected even in smaller cities. This association attenuated after adjustment for other factors, suggesting being married may be associated with higher levels of risk behavior. For example, being in a married relationship may limit the ability of a man to have steady male partners and leads to hurried sex with multiple male partners increasing their risk of HIV acquisition[23]. Higher HIV prevalence among married MSM and bisexual concurrency is not limited to India[32,33]. Interventions are needed to reduce risk among married MSM to prevent onward transmission to their wives.
We observed discordance between HIV prevalence and incidence in certain cities suggesting varying HIV epidemic stages. For example, in the three cities in Tamil Nadu, HIV incidence was substantially lower than what would be expected given the high prevalence, suggesting a possibly waning HIV epidemic. The high prevalence implies improved survival among HIV-infected MSM attributable to improved access to ART and the low incidence could be a result of both improved access to ART and prevention services. Contrastingly, HIV incidence was higher than expected in the northern cities (Bhopal, Delhi and Lucknow) for the observed moderate prevalence, suggesting escalating HIV epidemics.
Interestingly, we observed a strong association between injection drug use and HIV incidence among MSM. While other risk factors such as receptive anal intercourse and concurrent STIs have previously been described, the association with injection drug use among MSM has not been widely reported in RLS. Though overall prevalence of injection drug use among MSM was low, the strong association between drug use and HIV incidence (but not prevalence) suggests an increasing role of drug use in the emerging HIV epidemics among MSM as observed among MSM in developed settings [34-37]. Programs targeting MSM should monitor drug use and incorporate harm-reduction interventions, where applicable.
HIV programming efforts should also consider capitalizing on the efficiency of RDS for recruiting hidden populations. In this study we recruited a large number of “panthis” – panthis traditionally are more masculine and tend to be more hidden. Most previous studies have had a predominance of kothis and double deckers as these subgroups of MSM tend to be more visible and more easily reached using convenience sampling from settings such as STI clinics or from cruising sites via venue-based sampling. The true composition of MSM in each city remains unknown but our findings suggest that RDS may be more adept at reaching panthis in addition to kothis and double-deckers, compared to other strategies.
We were limited in this study by the self-reported nature of the risk factor data. In addition, estimation of cross-sectional incidence is an evolving field and there is still some debate, particularly in regions with HIV subtype C predominance. However, we used the algorithm that has been previously validated for African subtype C[15]. Further, the demonstration of strong associations between recent risk behaviors and HIV incidence reinforces the validity of this estimate. The incidence analysis was however, still limited by the small number of incident infections.
In conclusion, we observed a high burden of HIV infection among MSM in India including potentially emerging epidemics in areas not previously recognized as constituting high HIV burden. The diversity of epidemics across regions in India warrants further investigation and suggests that prevention and treatment programming need to be tailored for local needs.
Supplementary Material
Acknowledgments
This research has been supported by the National Institutes of Health, MH 89266, DA 032059, AI095068, DA035684 and the Johns Hopkins Center for AIDS Research (1P30AI094189). Additional support was provided by the Division of Intramural Research of the National Institute of Allergy and Infectious Diseases. We thank the National AIDS Control Organization (NACO), India, all of our partner non-governmental organizations throughout India, our study staff and the countless participants, without whom this research would not have been possible.
Source of Funding: This research has been supported by grants from the National Institutes of Health, MH 89266 and DA 032059 and the Johns Hopkins Center for AIDS Research (1P30AI094189).
Footnotes
Conflicts on Interest: No conflicts of interest are declared.
References
- 1.United Nations Joint Programme on HIV/AIDS. Global report: UNAIDS report on the Global AIDS Epidemic. [Accessed 7 January 2015];2013 Available at: http://www.unaids.org/sites/default/files/en/media/unaids/contentassets/documents/epidemiology/2013/gr2013/UNAIDS_Global_Report_2013_en.pdf.
- 2.Beyrer C, Baral SD, van Griensven F, Goodreau SM, Chariyalertsak S, Wirtz AL, et al. Global epidemiology of HIV infection in men who have sex with men. Lancet. 2012;380:367–377. doi: 10.1016/S0140-6736(12)60821-6. [DOI] [PMC free article] [PubMed] [Google Scholar]
- 3.Baral S, Trapence G, Motimedi F, Umar E, Iipinge S, Dausab F, et al. HIV prevalence, risks for HIV infection, and human rights among men who have sex with men (MSM) in Malawi, Namibia, and Botswana. PLoS One. 2009;4:e4997. doi: 10.1371/journal.pone.0004997. [DOI] [PMC free article] [PubMed] [Google Scholar]
- 4.De Cock KM, Jaffe HW, Curran JW. The evolving epidemiology of HIV/AIDS. AIDS. 2012;26:1205–1213. doi: 10.1097/QAD.0b013e328354622a. [DOI] [PubMed] [Google Scholar]
- 5.United Nations Joint Programme on HIV/ AIDS. Global report: UNAIDS reports on the Global AIDS Epidemic. [Accessed 7 January 2015];2010 Available at: http://issuu.com/unaids/docs/unaids_globalreport_2010/1?e=0.
- 6.National Institute of Medical Statistics and National Aids Control Organisation. Technical Report: India HIV Estimates. [Accessed 5 June 2014];2010 Available at: http://naco.gov.in/upload/Surveillance/Reports%20&%20Publication/Technical%20Report%20India%20HIV%20Estimates%202010.pdf.
- 7.National AIDS Control Organization and Institute of Health and Family Welfare. Annual HIV Sentinel Surveillance Country Report. [Accessed 7 January 2015];2006 Available at: http://www.naco.gov.in/upload/Surveillance/Reports%20&%20Publication/HIV%20Sentinel%20Surveillance%202006_India%20Country%20Report.pdf.
- 8.Verma RK, Collumbien M. Homosexual activity among rural Indian men: implications for HIV interventions. AIDS. 2004;18:1845–1847. doi: 10.1097/00002030-200409030-00014. [DOI] [PubMed] [Google Scholar]
- 9.Kar N, Koola MM. A pilot survey of sexual functioning and preferences in a sample of English-speaking adults from a small South Indian town. J Sex Med. 2007;4:1254–1261. doi: 10.1111/j.1743-6109.2007.00543.x. [DOI] [PubMed] [Google Scholar]
- 10.Herget G. India: UNAIDS claims law criminalizing homosexuality hinders HIV prevention. HIV AIDS Policy Law Rev. 2006;11:35–36. [PubMed] [Google Scholar]
- 11.Asthana S, Oostvogels R. The social construction of male ‘homosexuality’ in India: implications for HIV transmission and prevention. Soc Sci Med. 2001;52:707–721. doi: 10.1016/s0277-9536(00)00167-2. [DOI] [PubMed] [Google Scholar]
- 12.Solomon SS, Lucas GM, Celentano DD, Sifakis F, Mehta SH. Beyond Surveillance: A Role for Respondent-driven Sampling in Implementation Science. Am J Epidemiol. 2013;178:260–267. doi: 10.1093/aje/kws432. [DOI] [PMC free article] [PubMed] [Google Scholar]
- 13.Volz E, Heckathorn DD. Probability Based Estimation Theory for Respondent Driven Sampling. J Off Stat. 2008;24:79–97. [Google Scholar]
- 14.White RG, Lansky A, Goel S, Wilson D, Hladik W, Hakim A, et al. Respondent driven sampling--where we are and where should we be going? Sex Transm Infect. 2012;88:397–399. doi: 10.1136/sextrans-2012-050703. [DOI] [PMC free article] [PubMed] [Google Scholar]
- 15.Laeyendecker O, Kulich M, Donnell D, Komarek A, Omelka M, Mullis CE, et al. Development of methods for cross-sectional HIV incidence estimation in a large, community randomized trial. PloS One. 2013;8:e78818. doi: 10.1371/journal.pone.0078818. [DOI] [PMC free article] [PubMed] [Google Scholar]
- 16.Hemelaar J, Gouws E, Ghys PD, Osmanov S. Global trends in molecular epidemiology of HIV-1 during 2000-2007. AIDS. 2011;25:679–689. doi: 10.1097/QAD.0b013e328342ff93. [DOI] [PMC free article] [PubMed] [Google Scholar]
- 17.Office of the Registrar General & Census Commissioner of India. 2011 Census District Profiles. [Accessed 8 May 2013];2011 Available at: http://censusindia.gov.in/Tables_Published/Basic_Data_Sheet.aspx.
- 18.Go VF, Srikrishnan AK, Sivaram S, Murugavel GK, Galai N, Johnson SC, et al. High HIV prevalence and risk behaviors in men who have sex with men in Chennai, India. J Acquir Immune Defic Syndr. 2004;35:314–319. doi: 10.1097/00126334-200403010-00014. [DOI] [PubMed] [Google Scholar]
- 19.Narayanan P, Das A, Morineau G, Prabhakar P, Deshpande GR, Gangakhedkar R, et al. An exploration of elevated HIV and STI risk among male sex workers from India. BMC Public Health. 2013;13:1059. doi: 10.1186/1471-2458-13-1059. [DOI] [PMC free article] [PubMed] [Google Scholar]
- 20.Kumar GA, Dandona R, Poluru R, Chandran SA, Alary M, Dandona L. Patterns of condom use by men who have sex with men before and after the Avahan intervention in Andhra Pradesh state of India. BMC Public Health. 2014;14:64. doi: 10.1186/1471-2458-14-64. [DOI] [PMC free article] [PubMed] [Google Scholar]
- 21.Mishra RM, Dube M, Sahu D, Saggurti N, Pandey A. Changing epidemiology of HIV in Mumbai: an application of the Asian epidemic model. Glob J Health Sci. 2012;4:100–112. doi: 10.5539/gjhs.v4n5p100. [DOI] [PMC free article] [PubMed] [Google Scholar]
- 22.Thomas B, Mimiaga MJ, Kumar S, Swaminathan S, Safren SA, Mayer KH. HIV in Indian MSM: reasons for a concentrated epidemic & strategies for prevention. Indian J Med Res. 2011;134:920–929. doi: 10.4103/0971-5916.92637. [DOI] [PMC free article] [PubMed] [Google Scholar]
- 23.Solomon SS, Srikrishnan AK, Sifakis F, Mehta SH, Vasudevan CK, Balakrishnan P, et al. The emerging HIV epidemic among men who have sex with men in Tamil Nadu, India: geographic diffusion and bisexual concurrency. AIDS Behav. 2010;14:1001–1010. doi: 10.1007/s10461-010-9711-2. [DOI] [PMC free article] [PubMed] [Google Scholar]
- 24.Srikrishnan AK, Solomon S, Vasudevan CK, Sethulakshmi CJ. Qualitative assessment of HIV risks among MSM in South India. 5th IAS Conference on HIV Pathogenesis Treatment and Prevention; Cape Town, South Africa. 2009. Abstract MOPEC034. [Google Scholar]
- 25.Solomon SS, Srikrishnan A, Sifakis F, Vasudevan C, Mehta S, Balakrishnan P, et al. High prevalence of HIV, STI, and unprotected anal intercourse among men who have sex with men and men who have sex with women in Tamil Nadu, India. 16th Conference on Retroviruses and Opportunistic Infections; Montreal, Canada. 2009. Abstract #171LB. [Google Scholar]
- 26.Gupta A, Mehta S, Godbole SV, Sahay S, Walshe L, Reynolds SJ, et al. Same-sex behavior and high rates of HIV among men attending sexually transmitted infection clinics in Pune, India (1993-2002) J Acquir Immune Defic Syndr. 2006;43:483–490. doi: 10.1097/01.qai.0000243097.27029.b7. [DOI] [PubMed] [Google Scholar]
- 27.Setia MS, Lindan C, Jerajani HR, Kumta S, Ekstrand M, Mathur M, et al. Men who have sex with men and transgenders in Mumbai, India: an emerging risk group for STIs and HIV. Indian J Dermatol Venereol Leprol. 2006;72:425–431. doi: 10.4103/0378-6323.29338. [DOI] [PubMed] [Google Scholar]
- 28.Hernandez AL, Lindan CP, Mathur M, Ekstrand M, Madhivanan P, Stein ES, et al. Sexual behavior among men who have sex with women, men, and Hijras in Mumbai, India--multiple sexual risks. AIDS Behav. 2006;10(Suppl 4):S5–16. doi: 10.1007/s10461-006-9129-z. [DOI] [PubMed] [Google Scholar]
- 29.Shinde S, Setia MS, Row-Kavi A, Anand V, Jerajani H. Male sex workers: are we ignoring a risk group in Mumbai, India? Indian J Dermatol Venereol Leprol. 2009;75:41–46. doi: 10.4103/0378-6323.45219. [DOI] [PubMed] [Google Scholar]
- 30.Brahmam GN, Kodavalla V, Rajkumar H, Rachakulla HK, Kallam S, Myakala SP, et al. Sexual practices, HIV and sexually transmitted infections among self-identified men who have sex with men in four high HIV prevalence states of India. AIDS. 2008;22:S45–S57. doi: 10.1097/01.aids.0000343763.54831.15. [DOI] [PubMed] [Google Scholar]
- 31.National AIDS Control Organization. HIV Sentinel Surveillance 2012-13: A Technical Brief. [Accessed 7 January 2015];2013 Available at: http://www.naco.gov.in/upload/NACP%20-%20IV/HSS%20TECHNICAL%20BRIEF/HIV%20Sentinel%20Surveillance%20Technical%20Brief.pdf.
- 32.Xu F, Sternberg MR, Markowitz LE. Men who have sex with men in the United States: demographic and behavioral characteristics and prevalence of HIV and HSV-2 infection: results from National Health and Nutrition Examination Survey 2001-2006. SexTransm Dis. 2010;37:399–405. doi: 10.1097/OLQ.0b013e3181ce122b. [DOI] [PubMed] [Google Scholar]
- 33.Beyrer C, Trapence G, Motimedi F, Umar E, Iipinge S, Dausab F, et al. Bisexual concurrency, bisexual partnerships, and HIV among Southern African men who have sex with men. Sex Transm Infect. 2010;86:323–327. doi: 10.1136/sti.2009.040162. [DOI] [PubMed] [Google Scholar]
- 34.Greenwood GL, White EW, Page-Shafer K, Bein E, Osmond DH, Paul J, et al. Correlates of heavy substance use among young gay and bisexual men: The San Francisco Young Men's Health Study. Drug Alcohol Depend. 2001;61:105–112. doi: 10.1016/s0376-8716(00)00129-0. [DOI] [PubMed] [Google Scholar]
- 35.Prestage G, Fogarty AS, Rawstorne P, Grierson J, Zablotska I, Grulich A, et al. Use of illicit drugs among gay men living with HIV in Sydney. AIDS. 2007;21(Suppl 1):S49–55. doi: 10.1097/01.aids.0000255085.77470.bd. [DOI] [PubMed] [Google Scholar]
- 36.Nishijima T, Gatanaga H, Komatsu H, Takano M, Ogane M, Ikeda K, et al. High prevalence of illicit drug use in men who have sex with men with HIV-1 infection in Japan. PloS One. 2013;8:e81960. doi: 10.1371/journal.pone.0081960. [DOI] [PMC free article] [PubMed] [Google Scholar]
- 37.Lea T, Mao L, Bath N, Prestage G, Zablotska I, de Wit J, et al. Injecting drug use among gay and bisexual men in Sydney: prevalence and associations with sexual risk practices and HIV and hepatitis C infection. AIDS Behav. 2013;17:1344–1351. doi: 10.1007/s10461-013-0409-0. [DOI] [PubMed] [Google Scholar]
- 38.Heckathorn D. Respondent-driven sampling: a new approach to the study of hidden populations. Soc Probl. 1997;44:174–199. [Google Scholar]
- 39.Heckathorn DD. Respondent-driven sampling II: deriving valid population estimates from chain-referral samples of hidden populations. Soc Probl. 2002;49:11–34. [Google Scholar]
- 40.Salganik M, Heckathorn DD. Sampling and estimation in hidden populations using respondent-driven sampling. Sociol Methodol. 2004;49:11–34. [Google Scholar]
- 41.Tun W, Vu L, Adebajo SB, Abiodun L, Sheehy M, Karlyn A, et al. Population-based prevalence of hepatitis B and C virus, HIV, syphilis, gonorrhoea and chlamydia in male injection drug users in Lagos, Nigeria. Int J STD & AIDS. 2013;24:619–625. doi: 10.1177/0956462413477553. [DOI] [PubMed] [Google Scholar]
- 42.Lu H, Han Y, He X, Sun Y, Li G, Li X, et al. Alcohol use and HIV risk taking among Chinese MSM in Beijing. Drug Alcohol Depend. 2013;133:317–323. doi: 10.1016/j.drugalcdep.2013.06.013. [DOI] [PubMed] [Google Scholar]
- 43.Park JN, Papworth E, Kassegne S, Moukam L, Billong SC, Macauley I, et al. HIV prevalence and factors associated with HIV infection among men who have sex with men in Cameroon. J Int AIDS Soc. 2013;16(Suppl 3):18752. doi: 10.7448/IAS.16.4.18752. [DOI] [PMC free article] [PubMed] [Google Scholar]
- 44.Wirtz AL, Jumbe V, Trapence G, Kamba D, Umar E, Ketende S, et al. HIV among men who have sex with men in Malawi: elucidating HIV prevalence and correlates of infection to inform HIV prevention. J Int AIDS Soc. 2013;16(Suppl 3):18742. doi: 10.7448/IAS.16.4.18742. [DOI] [PMC free article] [PubMed] [Google Scholar]
Associated Data
This section collects any data citations, data availability statements, or supplementary materials included in this article.