

Abstract
Schizophrenia affects prefrontal and temporal-limbic networks. These regions were examined by contrasting regional cerebral blood flow (rCBF) during executive (Wisconsin Card Sorting Test [WCST]), and declarative memory tasks (Paired Associate Recognition Test [PART]). The tasks, and a resting baseline, were administered to 15 patients with schizophrenia and 15 healthy controls during 10 min positron emission tomography 15O-water measures of rCBF. Patients were worse on both tasks. Controls activated inferior frontal, occipitotemporal, and temporal pole regions for both tasks. Similar results were obtained for controls matched to level of patient performance. Patients showed no activation of hypothesized regions during the WCST and activated the dorsolateral prefrontal cortex during the PART. On the PART, occipitotemporal activation correlated with better performance for controls only. Better WCST performance correlated with CBF increase in prefrontal regions for controls and in the parahippocampal gyrus for patients. Results suggest that schizophrenia may involve a breakdown in the integration of a frontotemporal network that is responsive to executive and declarative memory demands in healthy individuals.
Schizophrenia was previously thought of primarily as a frontal lobe disorder. Central to this model were neuropsychological results of impaired Wisconsin Card Sorting Test (WCST; Berg, 1948; Grant & Berg, 1948) performance (Goldberg, Weinberger, Berman, Pliskin, & Podd, 1987) and cerebral blood flow (CBF) findings of “hypofrontality” at rest (Ingvar & Franzen, 1974) and in response to WCST task demands (Weinberger, Berman, & Zee, 1986). An alternative model proposed that schizophrenia primarily affects temporal lobe function. Support for this theory included neuropsychological results of differentially impaired learning and memory (Saykin et al., 1991), functional imaging evidence of resting left temporal lobe hypermetabolism (Gur et al., 1987), and atypical midtemporal CBF asymmetries in response to memory task demands (Gur, Jaggi, Shtasel, Ragland, & Gur, 1994).
More recently, researchers have begun to acknowledge the reciprocal interconnectivity of the prefrontal cortex with the hippocampus (Goldman-Rakic, Selemon, & Schwartz, 1984) and the rest of the brain (Fuster, 1980; Nauta, 1971) and have proposed that schizophrenia may involve a lack of integration of widely distributed brain regions including prefrontal, temporal, limbic, and posterior regions (Andreasen et al., 1996; Volkow et al., 1986). The purpose of this study was to test both frontal and temporal lobe models of schizophrenia by contrasting task-related changes in regional CBF (rCBF) during the WCST with rCBF changes during a declarative memory task (the Paired Associate Recognition Test [PART]; Ragland, Gur, Deutsch, Censits, & Gur, 1995) designed to control nonspecific motor and perceptual activation effects. In this paradigm, a finding of patient impairment on both tasks accompanied by similar abnormalities in rCBF change supports an integrationist model. Alternatively, a finding of selective performance and CBF abnormalities on either WCST or PART supports respective frontal or temporal lobe models.
The WCST requires participants to utilize examiner feedback to establish rules for correctly sorting a deck of cards to one of four key cards and then to inhibit previous rules and to generate new strategies when examiner feedback changes. It is a complex task involving several factors (Sullivan et al., 1993), including abstraction, cognitive flexibility, response inhibition, and attention. It has been classified as a working memory task (Berman et al., 1995), because previous response information must be maintained over brief delays. However, to acknowledge its multidimensional nature, we refer to it here as an executive task.
CBF studies of the WCST typically find an increased ratio of frontal to nonfrontal CBF in healthy volunteers that is not seen in patients with schizophrenia (e.g., Catafau et al., 1994; Parellada et al., 1994; Weinberger et al., 1986). However, the specificity of the WCST hypofrontality finding in schizophrenia has been questioned for a number of reasons. These include failure to replicate the finding in some studies (see Gur & Gur, 1995), evidence that WCST decrements are associated with temporal lobe pathology (Corcoran and Upton, 1993; Weinberger, Berman, Suddath, & Torrey, 1992), MRI evidence of temporal as well as frontal lobe abnormalities in schizophrenia (Turetsky et al., 1995; Weinberger et al., 1992), and evidence of WCST activation of additional temporal, parietal, and cerebellar regions in healthy volunteers (Berman et al., 1995; Marenco, Coppola, Daniel, Zigun, & Weinberger, 1993).
One way to assess specificity is to compare activation results for other cognitive tasks. This has been done, for example, with attentional tasks such as the Continuous Performance Test (CPT; Berman, Zec, & Weinberger, 1986) to document that WCST hypofrontality was not due to attentional factors. However, this has not been done for tasks of equivalent difficulty that utilize the same stimuli and response modality as the WCST. When one contrasts activation effects, it is essential either that (a) multiple control baseline subtractions are used (e.g., Posner, Petersen, Fox, & Raichle, 1988) or that (b) both tasks are of equivalent difficulty (Chapman & Chapman, 1989) and are matched on perceptual and response components. Otherwise, group differences in activation patterns between two tasks could be attributed to differences either in mental effort or in perceptual and motor demands. Because of relatively long scan lengths (10 min), multiple baselines were not feasible. Multiple subtractions can also lead to problems of interpretation (Friston et al., 1996). Therefore, the second approach was used, with resting baseline as a control condition.
The PART was developed as a measure of declarative memory (Squire, 1992) using WCST stimuli and response procedures to ensure compatibility of nonspecific aspects of perceptual and motor activation. The PART requires participants to learn and to retrieve paired associates (PAs), composed of two WCST cards, following a 2-min delay. During retrieval, participants indicate which of four WCST key cards were paired with previous targets. A normative study showed that the PART is a reliable and valid measure of declarative memory that correlates with Wechsler Memory Scale visual recall but does not correlate with WCST performance (Ragland et al., 1995). A neuropsychological study of 30 patients with schizophrenia and 30 healthy controls also found that patients were equally impaired on both tasks and that impairment was not due to medication effects (Ragland et al., 1996).
Another area of concern in imaging studies of schizophrenia is the chicken-and-egg problem. This dilemma is based on the fact that patients perform worse than controls on most cognitive tasks. It is, therefore, difficult to determine whether group differences in patterns of regional activation are due to disease state or to lower levels of performance. One approach to this problem has been to use training and practice to ensure that tasks are performed equally well by patients and controls. When this approach has been utilized (Andreasen et al., 1996), patients continued to show abnormal activation, suggesting that group differences were due to disease state. A problem with this approach is that patients and controls often require different amounts of practice, and ceiling effects can be created for controls. An alternative approach utilized in the current study is to contrast patients with controls who perform poorly but who are, otherwise, healthy.
Before examining schizophrenia, we administered the PART and WCST positron emission tomography (PET) paradigm to 30 healthy volunteers to understand normal patterns of activation and the role of task performance (Ragland et al., 1997). Results showed a bilateral rCBF increase over resting baseline in inferior frontal and occipitotemporal regions for both tasks, with more consistent dorsolateral prefrontal activation for WCST than PART. This common pattern of frontotemporal activation diverged when performance was examined. For the WCST, the best performers activated only dorsolateral prefrontal and inferior frontal regions, whereas top PART performers activated only the occipitotemporal region.
These combined results suggested operation of an integrated frontotemporal network subserving both executive and declarative memory function that became more focal as performance increased. For the current study, we predicted that due to a breakdown in frontotemporal integration, this common pattern of activation would not be observed in patients but would remain for healthy control samples. The following hypotheses were tested: (a) rCBF increases over baseline for both tasks in prefrontal and temporal lobe regions (specifically inferior and dorsolateral prefrontal and occipitotemporal) for healthy controls but not for patients with schizophrenia; and (b) rCBF change in prefrontal regions correlates with better WCST performance and, in occipitotemporal regions, with better PART performance for controls only.
Method
Participants
Participants were recruited by the Mental Health Clinical Research Center (MHCRC) at the University of Pennsylvania. After informed consent, they underwent a comprehensive evaluation (Shtasel et al., 1991) including medical, neurologic, and structured psychiatric interviews. Clinical symptomatology was assessed with the Brief Psychiatric Rating Scale (BPRS; Overall & Gorham, 1980), Scale for Assessment of Negative Symptoms (SANS; Andreasen, 1982a), and the Scale for Assessment of Positive Symptoms (SAPS; Andreasen, 1982b) by investigators trained to a criterion reliability of 0.85 (Shtasel et al., 1992). Patients and controls were free of any present or past disorder or injury that might affect brain function, including substance abuse.
The sample consisted of 15 patients (14 with schizophrenia and 1 schizoaffective according to Diagnostic and Statistical Manual of Mental Disorders, fourth edition [DSM–IV] criteria [American Psychiatric Association, 1994]) and 15 healthy demographically matched controls. There were 7 men and 8 women in each group. All controls and all but 1 left-handed patient were classified as right-handed based on a standard behavioral and self-report inventory (Raczkowski, Kalat, & Nebes, 1974). Demographically matched controls were drawn from a larger sample of 30 participants (Ragland et al., 1997) and were selected to match patients on age, gender, and parental education (see Table 1). Estimated intellectual ability (based on Wechsler Adult Intelligence Scale—Revised [WAIS–R] Vocabulary subtest performance; Wechsler, 1987) was in the upper end of the average range for controls (scaled score = 12.8 ± 2.0) and in the lower end of the average range for patients (scaled score = 8.9 ± 3.3).
Table 1.
Demographic and Clinical Characteristics of Patient and Demographically Matched Control Samples
| Characteristic | Patients (M = 7, F = 8)
|
Controls (M = 7, F = 8)
|
||
|---|---|---|---|---|
| M | SD | M | SD | |
| N | 15 | 15 | ||
| Male | 7 | 7 | ||
| Female | 8 | 8 | ||
| Age (yr) | 33.5 | 7.7 | 29.6 | 5.7 |
| Parental education (yr) | 12.7 | 4.0 | 11.6 | 1.0 |
| Neuroleptic dose (in mg) | 631.0 | 60.0 | NA | |
| Age of onset (yr) | 22.4 | 5.3 | NA | |
| Duration of illness (yr) | 9.6 | 8.8 | NA | |
| Total BPRS | 37.1 | 9.3 | NA | |
| Total SANS | 29.8 | 14.9 | NA | |
| Total SAPS | 27.2 | 8.5 | NA | |
Note. Boldface indicates clinical variables entered in correlational analyses. NA = not applicable; BPRS = Brief Psychiatric Rating Scale; SANS = Scale for Assessment of Negative Symptoms; SAPS = Scale for Assessment of Positive Symptoms.
Five patients were in their first episode of illness, and 10 were previously treated. Six were not receiving medication, and the remaining 9 had received a mean (±SD) daily dose of 631 ± 60 mg (chlorpromazine [CPZ] equivalents; Kaplan & Saddock, 1988) before a minimum 2-week wash-out period. Three were also receiving anticholinergic medication. Clozapine was the only atypical antipsychotic drug used and was administered at a dose of 600 CPZ units in 1 patient. Patients were rated as mildly ill across clinical scales (see Table 1).
To assess if group differences in regional activation were secondary to poor patient performance, 2 performance-matched control samples were also chosen from the group of 30. Fifteen controls with the lowest performance on each task were selected. Because not all individuals performed equally poorly on both tasks, overlapping PART and WCST matched groups were formed with 6 participants in common. PART and WCST matched groups had a higher ratio of males (9:6 and 10:5 vs. 7:8) and were younger (27.6 ± 7.2 yr and 28.0 ± 5.7 yr vs. 33.5 ± 7.7 yr), but they had equivalent levels of parental education (12.0 ± 1.3 yr and 11.6 ± 1.4 yr vs. 12.9 ± 4.0 yr) as the patient sample. For the PART, matched controls obtained 54.6 ± 15.3% correct versus 51.4 ± 21.0% correct. For the WCST, controls obtained 6.1 ± 3.3 versus 4.9 ± 5.2 categories and had a perseverative error rate of 17.7 ± 17.8% versus 21.3 ± 12.6%.
Neurobehavioral Probes
Images were acquired during a standard resting baseline condition (eyes open, ears unoccluded; Gur et al., 1982), a control baseline number-matching task (Weinberger et al., 1986), and PART and WCST tasks. Conditions were counterbalanced (Latin square design) to control possible order effects. As in the previous control study (Ragland et al., 1997), values from the resting baseline condition were used to measure activation effects, and data from the number-matching condition were not utilized.
Stimuli were presented, using a 35-mm slide projector, onto a screen mounted from the ceiling at an angle perpendicular to line of sight. Participants responded with a light pointer attached to their feet via a foot pedal apparatus. Responses consisted of making a bilateral foot movement to point the light beam to one of the four WCST key cards mounted in a vertical array at the top of the screen. Verbal feedback (“correct” or “incorrect” for WCST, “OK” for PART) was provided after each response.
PART
Task construction, psychometric evaluation, and procedures for administration during PET were previously described (Ragland et al., 1995, 1997). Briefly, the PART contains six blocks of four items, in which participants are required to learn and then to correctly recognize PAs composed of WCST stimuli following a 2-min delay. PAs consist of 1 of 64 WCST target cards arranged below one of four WCST key cards. Recognition probes consist of one previously administered WCST target card presented under the array of four key cards. To ensure comprehension, three practice items are presented. These items present one PA immediately followed by a recognition probe. To reduce the chance of practice effects, practice items are not used in the test. After practice, blocks (consisting of four PAs, a 2-min delay, followed by four recognition probes) are presented sequentially until the end of the measurement epoch.
WCST
Participants were administered a color slide version of the WCST following standard administration and scoring procedures (Heaton, 1981), with the exception that, because of PET time constraints, the test continued past six categories and varied from two to three decks long. Because the WCST is self-paced, not all participants received an equal number of stimuli (see Table 2).
Table 2.
Differences in Wisconsin Card Sorting (WCST) and Paired Associate Recognition (PART) Test Performance Between Patients With Schizophrenia and Demographically Matched Controls
| Test variable | Patient
|
Control
|
t | p | ||
|---|---|---|---|---|---|---|
| M | SD | M | SD | |||
| WCST | ||||||
| WCSTRESP | 144.8 | 32.7 | 191.0 | 19.9 | −4.7 | .0001 |
| WCSTCAT | 4.9 | 5.2 | 13.2 | 2.2 | −5.7 | .0001 |
| WCSTPPE | 21.3 | 12.6 | 9.0 | 1.8 | 4.1 | .0003 |
| PART | ||||||
| PARTRESP | 17.3 | 1.9 | 18.1 | 2.5 | −1.0 | ns |
| PARTPCOR | 51.4 | 21.0 | 71.5 | 18.7 | −2.8 | .008 |
Note. WCSTRESP = WCST number of responses; WCSTCAT = WCST number of categories; WCSTPPE = WCST percent perseverative error; PARTRESP = PART number of responses; PARTPCOR = PART percent correct; ns = nonsignificant at alpha = .05.
PET Scanning Procedures
After placement of arterial and venous catheters, participants were positioned in a supine position into a volume imaging camera with a spatial resolution of 5.5 mm in all directions (UGM Medical Systems, Philadelphia: Karp, Kinahan, & Muehllehner, 1993). Their heads were aligned along the orbitomeatal line, and foam head holders were used to reduce movement. A quantitative equilibrium infusion technique with arterial sampling was used to measure rCBF with 15O water (Jones et al., 1985). Infusion of 15O water and the first task began at time zero. The first 10-min scan began 8 min after infusion, and subsequent scans were separated by 6 min to allow for reequilibration (Jones et al., 1985). Total study time was 66 min. Participants performed tasks during reequilibration and scan periods, with no knowledge of when reequilibration ended and scanning began. Camera countrates were used to monitor and to correct for camera deadtime (Smith, Karp, & Muehllehner, 1994), and arterial blood samples were drawn every 2–3 min and were measured in a calibrated NaI(T1) well counter (Tennelec 707, Memphis, TN) to provide the input function for quantitation.
Image Processing
Region of interest analysis
Radioactivity was localized by cross-registering PET scans with contemporaneously acquired MRIs using a standard MHCRC protocol (Turetsky et al., 1995). Both MRI and PET scans were obliquely reformatted by linear interpolation of the original three-dimensional arrays. Images were resliced in planes along the anterior and posterior commissures (AC–PC line). A set of templates with 36 regions of interest (ROIs) was then custom-fit on each MRI slice by operators trained to an interrater reliability criterion of >.85 (Resnick, Karp, Turetsky, & Gur, 1994). Representative ROIs are illustrated in Figure 1.
Figure 1.

Placement of representative regions of interest (ROIs) on MRI images. ROI labels are abbreviated as follows (regions included in the main analysis are in boldface): SF = superior frontal; DL = dorsolateral prefrontal; DM = dorsomedial prefrontal; MF = mid-frontal; IF = inferior frontal; SM = sensorimotor; SP = superior parietal; SG = supramarginal gyrus; OM = occipital-medial; OL = occipital-lateral; LI = lingual gyrus; FG = fusiform gyrus; OT = occipitotemporal; ST = superior temporal; MT = mid-temporal; IT = inferior temporal; TP = temporal pole; PH = parahippocampal gyrus; HI = hippocampus; AM = amygdala; IN = insula; OF = orbital frontal; RG = rectal gyrus; CA = cingulate gyrus-anterior, CG = cingulate gyrus; CP = cingulate gyrus-posterior, C1 = corpus callosum-anterior; C2 = corpus callosum-posterior, CN = caudate nucleus; LM = lenticular-medial (globus pallidus); LL = lenticula-lateral (putamen); MB = mammillary body; TH = thalamus; MI = midbrain; PO = pons; CE = cerebellum.
The templates and their regions were based on the Talairach Atlas (Talairach, & Tournoux, 1988) as presented in Resnick et al. (1994). After custom-fitting ROIs to each individual’s MRI, we cross-registered PET images by globally adjusting MRI fitted templates so that whole-brain boundaries matched the outer circumference of the brain on each PET slice. Global adjustment of whole-brain boundaries was performed while holding the relative position of individual ROIs constant such that the atlas of regions was adjusted as a whole (Gur et al., 1987).
Statistical parametric mapping
To provide an alternative analysis of all brain areas, we also performed the statistical parametric mapping (SPM) procedure (SPM95 software, MRC Cyclotron Unit, London; Frackowiak, & Friston, 1994) on 13 patients and 13 demographically matched controls. Two patients and 2 controls had PET images that could not be successfully normalized because the top of their brain had been out of the field of view of the camera. Because there were no task differences in global CBF across groups, proportional scaling rather than analysis of covariance (ANCOVA) global normalization was used because it is conceptually similar to the region-to-whole-brain procedure used in the ROI analysis. Difference images were created for PART and WCST minus resting baseline conditions separately for patients and controls following standard SPM realignment, normalization, and smoothing of the original PET images. The effects for each difference image were estimated using linear contrasts, yielding a t statistic for the difference at each voxel. These t statistics were expressed as standardized Z scores in the final projection maps (SPM {z}).
Data Quantification
CBF
Absolute CBF (ml/100g/min) was calculated using the equilibrium infusion technique (Frackowiak, Lenzi, Jones, & Heather, 1980; Lammertsma et al., 1981; Smith, Shao, Freifelder, Karp, & Ragland, 1995), using the formula: CBF = λ/{(Ca/Ct) − 1/ρ}, where λ is the decay constant for 15O, Ca is the mean arterial activity concentration, Ct is the mean tissue activity concentration, and ρ is the mean brain partition coefficient for 15O water. Regional CBF was calculated by volume averaging over all slices in which a region could be identified. Uncertainties in activity concentrations in tissue and blood resulted in propagated errors in whole-brain CBF of +25/−18%. Statistical errors in tissue activity concentrations for various regions ranged from 8.6% for a 0.35 cm2 region to 3.4% for a 9 cm2 region. A commonly used method for reducing propagated errors is to use relative rCBF (Blauenstein, Halsey, Wilson, Wills, & Risberg, 1977; Risberg, 1980), which is defined here as: relative rCBF = rCBF/wCBF, where wCBF is whole-brain CBF and rCBF is regional CBF. Because the largest source of measurement error is the variability in measured arterial activity concentration (7.6%), and because this variability is the same for each region as for the whole brain, this error cancels out for relative rCBF. Therefore, quantitative data were used to determine that there were no differences between conditions in whole-brain CBFs, so that relative rCBFs could be used for examining regional specificity of activation.
Task performance
Participant responses on the PART were scored as either true or false and were summed to obtain a total for each block. The number of blocks varied from four (16 probes) to six (24 probes). Therefore, a percent correct score (PARTPCOR) was calculated by dividing total number correct by total number of responses and multiplying by 100. Because the sampling distribution of a proportion does not satisfy assumptions underlying standard parametric analysis, PARTPCOR was transformed with the equation: PARTPCOR_T = 2(Sin1)(PARTPCOR)(1/2). This stabilizes variance and normalizes the distribution, facilitating parametric statistical methods (Cohen, 1988).
For the WCST, number of cards sorted (WCSTRESP), number of categories (WCSTCAT), and percent perseverative errors (WCSTPPE) were calculated using standard procedures (Heaton, 1981). WCSTPPE represents the proportion of responses that were perseverative errors and accounts for the fact that participants did not sort the same number of cards. WCSTPPE was also transformed using the previously described arc-sin equation. To ensure compatibility across tests, PART and WCST performance variables were rescaled to standard equivalents (z scores) with mean = 0 and standard deviation = 1. To facilitate interpretation, we report nontransformed and nonstandardized performance data.
Data Analysis
The 12 brain regions analyzed in the previous PET study of healthy volunteers were chosen for hypothesis testing in the current study. By limiting the number of ROIs, the chance of Type I error is reduced, and the problem of multiple comparisons is contained. These ROIs were chosen a priori based on a previous literature review (see Ragland et al., 1997) linking working memory and WCST with prefrontal cortex and declarative memory with frontal and temporal-limbic regions.
To test the first hypothesis that patients do not show task-related rCBF changes in frontotemporal regions in response to PART and WCST tasks, we performed a repeated measures multivariate analysis of variance (MANOVA; Procgeneral linear model procedure [GLM]; SAS, 1996). The relative rCBF values listed in Table 3 were entered into a 2 (patient vs. control) X 3 (task conditions) X 2 (hemispheres) X 12 (brain regions) design, with repeated measures for the last three factors. Activation effects were examined for each task through CBF change scores (rCBFΔ). Results from the overall MANOVA were used to determine whether hemispheric or bilateral rCBFΔ indices were calculated. A Task X Hemisphere, or Task X Hemisphere X Clinical Status interaction was prerequisite to examining hemispheric rCBFΔ, otherwise bilateral values were used. rCBFΔ values were calculated by subtracting relative rCBF during resting baseline from relative rCBF during PART or WCST tasks for each of the 12 ROIs. These rCBFΔ values were entered as dependent measures into paired t tests separately for patients and controls. This t test analysis was performed initially for the demographically matched controls and then for the performance-matched control groups. The significance criterion for the MANOVA and paired t test analysis was set at an alpha level of .05, two-tailed, with H0: t = 0 and H1: t ≠ 0.
Table 3.
Left and Right Relative rCBF (M ± SD) for Patients and Demographically Matched Controls During Resting Baseline, Paired Associate Recognition (PART), and Wisconsin Card Sorting (WCST) Tasks
| Brain region | Baseline
|
PART
|
WCST
|
|||
|---|---|---|---|---|---|---|
| Patients left/right | Controls left/right | Patients left/right | Controls left/right | Patients left/right | Controls left/right | |
| SF | 1.01 ±0.14/ 0.87 ± 0.17 | 0.95 ± 0.10/ 0.83 ± 0.14 | 1.04 ± 0.13/ 0.86 ± 0.12 | 0.93 ± 0.09/ 0.78 ± 0.10 | 1.02 ± 0.10/ 0.83 ±0.11 | 0.91 ± 0.09/ 0.78 ± 0.10 |
| DL | 1.00 ± 0.10/ 0.78 ± 0.07 | 1.07 ± 0.11/ 0.85 ±0.11 | 1.05 ± 0.12/ 0.83 ± 0.10 | 1.09 ± 0.11/ 0.86 ± 0.11 | 1.02 ± 0.10/ 0.81 ± 0.09 | 1.09 ± 0.11/ 0.86 ± 0.11 |
| DM | 0.94 ± 0.07/ 0.85 ± 0.08 | 0.98 ± 0.14/ 0.88 ± 0.09 | 0.97 ± 0.08/ 0.88 ± 0.07 | 0.96 ± 0.14/ 0.85 ±0.10 | 0.94 ± 0.10/ 0.85 ± 0.06 | 0.96 ± 0.15/ 0.85 ± 0.10 |
| IF | 1.04 ± 0.13/ 0.84 ±0.12 | 1.14 ± 0.14/ 0.92 ± 0.09 | 1.05 ± 0.16/ 0.87 ± 0.13 | 1.19 ± 0.11/ 0.95 ± 0.10 | 1.07 ± 0.13/ 0.88 ± 0.13 | 1.19 ± 0.13/ 0.94 ± 0.09 |
| OT | 0.95 ± 0.23/ 0.89 ± 0.18 | 0.95 ± 0.19/ 0.90 ± 0.14 | 0.99 ± 0.17/ 0.95 ±0.11 | 0.99 ± 0.24/ 0.97 ±0.19 | 0.99 ± 0.16/ 0.94 ± 0.13 | 0.99 ± 0.23/ 0.98 ± 0.18 |
| MT | 0.99 ± 0.10/ 0.81 ± 0.07 | 0.99 ± 0.10/ 0.86 ± 0.08 | 1.00 ± 0.10/ 0.82 ± 0.08 | 0.99 ±0.10/ 0.84 ± 0.08 | 0.99 ± 0.10/ 0.82 ± 0.08 | 0.98 ± 0.11/ 0.85 ± 0.08 |
| IT | 0.92 ± 0.15/ 0.81 ± 0.17 | 1.06 ± 0.20/ 0.89 ± 0.10 | 0.93 ± 0.12/ 0.81 ± 0.16 | 1.07±0.23/ 0.88 ± 0.11 | 0.93 ± 0.13/ 0.83 ± 0.15 | 1.06 ± 0.23/ 0.87 ± 0.09 |
| TP | 0.86 ± 0.15/ 0.80 ± 0.13 | 0.92 ± 0.15/ 0.86 ±0.11 | 0.87 ± 0.15/ 0.82 ± 0.13 | 0.94 ± 0.15/ 0.88 ±0.11 | 0.88 ± 0.13/ 0.82 ±0.11 | 0.95 ± 0.15/ 0.89 ± 0.12 |
| PH | 1.31 ± 0.12 / 1.20 ± 0.09 | 1.29 ± 0.23/ 1.25 ± 0.22 | 1.28 ± 0.09/ 1.21 ± 0.09 | 1.30±0.16/ 1.20 ± 0.18 | 1.28 ± 0.12/ 1.17 ± 0.08 | 1.30 ± 0.18/ 1.22 ± 0.18 |
| HI | 1.26 ± 0.06/ 1.19 ± 0.07 | 1.35 ± 0.20/ 1.20 ± 0.14 | 1.25 ± 0.06/ 1.23 ± 0.12 | 1.31 ±0.16/ 1.19 ±0.15 | 1.26 ± 0.08/ 1.19 ±0.11 | 1.29 ± 0.11/ 1.22 ±0.14 |
| AM | 1.30 ± 0.16/ 1.33 ± 0.18 | 1.56 ± 0.34/ 1.59 ±0.28 | 1.30 ± 0.16/ 1.34 ±0.19 | 1.56 ± 0.27/ 1.59 ± 0.28 | 1.28 ± 0.18/ 1.30 ±0.17 | 1.56 ± 0.33/ 1.57 ± 0.32 |
| OF | 1.11 ± 0.24/ 1.00 ± 0.23 | 1.27 ± 0.29/ 1.02 ±0.16 | 1.11 ± 0.25/ 0.98 ± 0.28 | 1.31 ± 0.30/ 1.09 ±0.17 | 1.10 ± 0.21/ 0.99 ± 0.23 | 1.24 ± 0.31/ 1.08 ± 0.17 |
Note. Change in regional cerebral blood flow (rCBFΔ) equals average of left and right values for baseline subtracted from left and right regional averages for task conditions. SF = superior frontal; DL = dorsolateral prefrontal; DM = dorsomedial prefrontal; IF = inferior frontal; OT = occipitotemporal; MT = mid-temporal; IT = inferior temporal; TP = temporal pole; PH = parahippocampal gyrus; HI = hippocampus; AM = amygdala; OF = orbital frontal.
To test the second hypothesis, that rCBF change does not correlate with PART and WCST performance for patients, we calculated Pearson product–moment correlations between global CBF and rCBFΔ with performance indices for each task. Because there was no reason to predict that CBF would be inversely related with performance (i.e., greater CBF increase related to worse performance), one-tailed analyses with probability criterion set at .05 were used to test with H0: t = 0 and H1: t > 0.
Pearson product–moment correlations were also used to examine the relationship between the five clinical variables listed in Table 1 and task performance, global CBF, and rCBFΔ for the patient sample. The probability criterion was set at .05, two-tailed. Correlations with neuroleptic dose were not examined, because patients with a medication history had been washed off for a minimum of 2 weeks. Any chronic effects of neuroleptic exposure were examined through one-way contrasts of the 9 patients with and 6 patients without a neuroleptic history.
Finally, to test for other regional task effects, we calculated rCBFΔ for all 36 ROIs (see Figure 2) as a post hoc exploratory analysis. The 36 rCBFΔ values were evaluated to test if they were different than zero using t tests for both patient and demographically matched control samples. The criterion value was set at the .05 level (two-tailed), and no Bonferroni corrections were applied because such corrections are prohibitively conservative when the analysis is considered post hoc and for the purpose of hypothesis generation only. Task effects for all areas of the brain were also examined using the SPM procedure described in the Image Processing section. Because the SPM procedure involves multiple comparisons, the chance of Type I error is increased. To reduce this danger, standard smoothing procedures were used, and only areas in which the probability of observing a peak voxel was p = .001 or less (uncorrected) were considered significant. Results from these post hoc ROI and SPM analyses should be interpreted with utmost caution.
Figure 2.

Mean (±SEM) relative change in regional cerebral blood flow (rCBFΔ; baseline subtracted) for Paired Associate Recognition Test (PART; top graph) and Wisconsin Card Sorting Test (WCST; bottom graph) for 15 demographically matched controls (open bars) and 15 patients with schizophrenia (shaded bars). SF = superior frontal; DL = dorsolateral prefrontal; DM = dorsomedial prefrontal; IF = inferior frontal; OT = occipitotemporal; MT = mid-temporal; IT = inferior temporal; TP = temporal pole; PH = parahippocampal gyrus; HI = hippocampus; AM = amygdala; OF = orbital frontal. *p < .05, **p < .005 controls; +p < .05 patients; all two-tailed.
Results
Task Performance
Patients performed worse than demographically matched controls on both tasks, F(1, 28) = 33.6, p = .0001 (see Table 2). This result remained when WAIS–R Vocabulary scores were added as a covariate, F(1, 27) = 12.6, p = .001, suggesting that differences in current intellectual ability did not account for patients’ poorer performance. Although there was no difference in the number of PART items (PARTRESP) administered, patients made fewer correct responses (PARTPCOR = 51.4 vs. 71.5% correct). On the WCST, patients sorted fewer cards (WCSTRESP = 144.8 vs. 191), obtained fewer categories (WCSTCAT = 4.9 vs. 13.2), and had a higher percentage of perseverative errors (WCSTPPE = 21.3 vs. 9%).
Replicating previous normative findings (Ragland et al., 1995), PARTPCOR did not correlate in controls with WCSTCAT or WCSTPPE, and WCSTCAT and WCSTPPE were negatively correlated, r = .55, p = .03. Patients showed the same lack of correlation between PART and WCST and a negative correlation between WCSTCAT and WCSTPPE, r = .70, p = .003.
There was no difference in performance on either task between patients with (n = 9) and without a neuroleptic history. Patients with (n = 3) and without anticholinergic medication also performed similarly. More severe negative symptomatology on the SANS correlated with fewer categories, r = −.56, p < .02, and higher rates of perseverative responding, r = .52, p < .05, on the WCST. As in a previous study outside of PET (Ragland et al., 1996), PART performance did not correlate with any clinical variable.
Global CBF
Because sex differences have been consistently reported (Gur et al., 1982; Rodrigues, Warkentin, Risberg, & Rosadini, 1988), global CBF was examined for sex effects by using a 2 (patients, controls) X 2 (men, women) X 3 (tasks) MANOVA, with repeated measures for the third factor. Replicating previous findings, there was a main effect for sex, F(1, 27) = 7.76, p = .01, with male patients and controls having lower global CBF across task conditions. No other main effects or interactions were significant, and subsequent analyses were performed across sex groups.
Mean (±SD) global CBF (ml/min/100g) did not differ between patients and controls during resting baseline (patients = 31.6 ± 2.4, controls = 30.5 ± 1.2) or WCST task conditions (29.6 ± 1.1 vs. 31.7 ± 1.1). However, patients had significantly lower CBF during the PART (28.8 ± 1.2 vs. 32.8 ± 1.1), F(1, 26) = 6.64, p = .016. There was no difference in global CBF between patients with and without a history of neuroleptic exposure. Global CBF did not correlate with any clinical variable. Lack of significant task differences in global CBF across participants supported the use of relative rCBF to investigate activation effects.
Activation Effects
The 12 hemispheric relative rCBF means for patients and demographically matched controls are presented in Table 3 for each condition. When these values were entered into a MANOVA, a main effect of patient status was found, F(1, 27) = 7.8, p = .01, indicating that rCBF topography was different for patients and controls across hemispheres, regions, and tasks. There were also main effects of hemisphere, F(1, 27) = 117.8, p = .0001, and of region, F(11, 17) = 29.6, p = .0001. The hemisphere effect reflected higher left than right CBF across groups and task conditions. The main effect of region demonstrated that CBF differed between regions across groups and tasks. Significant interactions were also observed between hemisphere and brain region, F(11, 17) = 15.3, p = .0001, indicating that not all regions were similarly lateralized, and between clinical status and brain region, F(11, 17) = 4.1, p = .004, illustrating that regional topography was different for patients and controls across tasks and hemispheres. No other main effects or interactions were significant. Because hemisphere did not interact with task or with patient status, bilateral rCBFΔ indices were calculated.
Task-Related Activation (Hypothesis 1)
Demographically matched controls
As can be seen in Figure 2, the pattern of task-related bilateral rCBFΔ was similar between tasks for the control sample. Both the WCST and PART activated inferior frontal (IF), occipitotemporal (OT), and temporal pole (TP) regions. Additional PART activation was found for the orbital frontal (OF) region.
In partial support of Hypothesis 1, patients did not show a consistent pattern of frontotemporal activation across task conditions. On the PART (see Figure 2, top graph), patients failed to activate IF, OT, TP, and OF regions. Contrary to the hypothesis, patients activated dorsolateral prefrontal cortex (DL) on the PART. For the WCST (see Figure 2, bottom graph), patients failed to significantly activate any brain region.
When correlations between rCBFΔ and clinical variables were examined, the only findings were with the total SANS score (SANSTOT). More severe negative symptoms correlated with decreased rCBFΔ in the amygdala for the PART, r = −.63, p < .02, and in the amygdala, r = −.63, p < .02, and the parahippocampal gyrus, r = −.68, p < .01, for the WCST.
Performance-matched controls
Figure 3 presents performance-matched versus demographically matched control activation results. For the PART (see Figure 3, top graph), three of the four effects found in the previous control group remained significant for the performance-matched sample. In accord with previous findings that occipitotemporal activation is necessary for good performance (Ragland et al., 1997), rCBFΔ in the occipitotemporal region was no longer significant for the performance-matched participants. Like the patient sample, the performance-matched controls showed additional activation in the DL region. For the WCST (see Figure 3, bottom graph), all three regional activations present in the demographically matched group remained significant for the performance-matched controls. This later group showed additional rCBF decrease in the superior frontal (SF) region. Thus, although activation patterns were not identical, performance-matched controls continued to show a consistent pattern of frontotemporal activation for both tasks that was not present for the patient sample. This result supports the conclusion that lack of frontotemporal activation in patients was not simply due to their low performance.
Figure 3.

Mean (±SEM) relative change in regional cerebral blood flow (rCBFΔ; baseline subtracted) for Paired Associate Recognition Test (PART; top graph) and Wisconsin Card Sorting Test (WCST; bottom graph) for 15 demographically matched controls (open bars) and 15 performance matched controls (shaded bars). SF = superior frontal; DL = dorsolateral prefrontal; DM = dorsomedial prefrontal; IF = inferior frontal; OT = occipitotemporal; MT = mid-temporal; IT = inferior temporal; TP = temporal pole; PH = parahippocampal gyrus; HI = hippocampus; AM = amygdala; OF = orbital frontal. *p < .05 demographically matched controls; +p < .05 performance-matched controls.
Relationship With Task Performance (Hypothesis 2)
In the previous control study, the relationship between CBF and performance was examined by stratifying participants into the top, middle, and bottom third level of performance. However, in the current study, there were too few participants for this approach, so a correlational analysis was performed.
Global CBF during baseline and task conditions did not correlate with PART or WCST performance for either patients or controls. However, meaningful relationships were found for rCBFΔ. For controls, greater rCBF increase between baseline and PART in the occipitotemporal region was correlated with better task performance (r = .48, p = .03). As can be seen in the scatter plot (see Figure 4), this correlation was consistent across participants. For patients, there were no significant correlations between rCBFΔ and PART performance.
Figure 4.

Scatter plot of relationship between Paired Associate Recognition Test (PART) regional cerebral blood flow change from baseline in the occipitotemporal region (rCBFΔ, x-axis) and PART percent correct performance (PARTPCOR, y-axis) for 15 demographically matched healthy controls.
rCBFΔ did not correlate with WCST percent perseverative errors for either patients or controls. However, number of categories (WCSTCAT) correlated with rCBFΔ in both groups. For controls, higher category attainment was associated with greater rCBF change from baseline in SF (r = .69, p = .003), DL (r = .48, p = .03), and dorsomedial prefrontal (DM) regions (r = .50, p = .03). For patients, greater rCBF change in the parahippocampal gyrus (PH) was associated with higher category attainment (r = .53, p = .02). As can be seen in Figure 5, the superior frontal correlation in controls and parahippocampal gyrus correlation in patients were consistent across participants.
Figure 5.
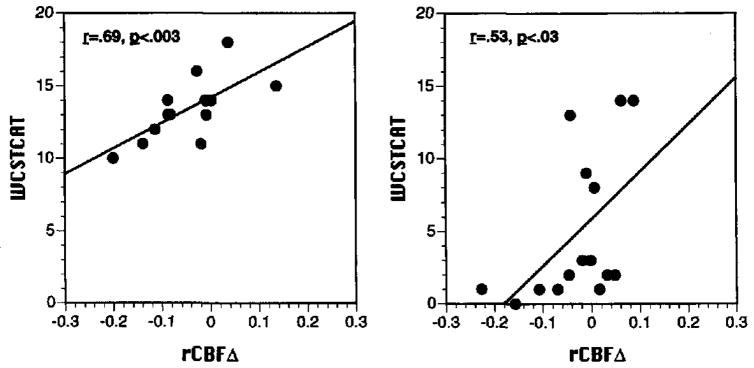
Scatter plots of relationship between Wisconsin Card Sorting Test (WCST) number of categories (WCSTCAT, y-axis) and regional cerebral blood flow change from baseline in superior frontal region (rCBFΔ, x-axis) for 15 demographically matched healthy controls (left graph) and rCBFΔ in the parahippocampal gyrus for 15 patients (right graph).
Exploratory Analyses
ROI analysis
The rCBFΔ means for all ROIs are displayed in Figure 6. The 12 ROIs included in the previous analyses are indicated by bold type. For the PART (see Figure 6, top graph), demographically matched controls did not show any additional areas of significant task-related rCBF change. Patients showed an additional rCBF increase in the superior parietal (SP) region and a decrease in the anterior portion of the cingulate gyrus (CA). For the WCST (see Figure 6, bottom graph), controls showed additional rCBF activation in the SP, lateral occipital (OL), and cingulate gyrus (CG). Controls showed an rCBF decrease on the WCST in CA, and caudate nucleus (CN) regions. Patients on the WCST showed the same increases in OL, decreases in CA and CN regions, and an additional decrease in the lateral lenticular–putamen (LL) region.
Figure 6.

Mean (±SEM) relative regional cerebral blood flow change (rCBFΔ; baseline subtracted) for all 36 regions of interest (ROIs) for Paired Associate Recognition Test (PART; top graph) and Wisconsin Card Sorting Test (WCST; bottom graph) for 15 demographically matched controls (open bars) and 15 patients with schizophrenia (shaded bars). SF = superior frontal; DL = dorsolateral prefrontal; DM = dorsomedial prefrontal; MF = mid-frontal; IF = inferior frontal; SM = sensorimotor; SP = superior parietal; SG = supramarginal gyrus; OM = occipital-medial; OL = occipital-lateral; LI = lingual gyrus; FG = fusiform gyrus; OT = occipitotemporal; ST = superior temporal; MT = mid-temporal; IT = inferior temporal; TP = temporal pole; PH = parahippocampal gyrus; HI = hippocampus; AM = amygdala; IN = insula; OF = orbital frontal; RG = rectal gyrus; CA = cingulate gyrus-anterior; CG = cingulate gyrus; CP = cingulate gyrus-posterior; Cl = corpus callosum-anterior; C2 = corpus callosum-posterior; CN = caudate nucleus; LM = lenticular-medial (globus pallidus); LL = lenticula-lateral (putamen); MB = mammillary body; TH = thalamus; MI = midbrain; PO = pons; CE = cerebellum; PAR = parietal; OCC = occipital; CC = corpus callosum; BG = basal ganglia; DIE = diencephalon; BS = brainstem. Regions that were analyzed in the primary analysis are in bold. *p < .05 controls; +p < .05 patients; all two-tailed.
SPM analysis
Figure 7 presents SPM [z] projection images, and Table 4 provides Talairich x, y, z-coordinates and z-scores of maximally significant activations for PART and WCST minus resting baseline for patients and demographically matched controls. As with the ROI analysis, SPM revealed substantial overlap of activation effects for the two tasks in the control sample. For the PART minus baseline subtraction, results for controls (see Figure 7A) were generally consistent with the ROI results in Figure 6, with the exception of parietal–occipital rather than OT and additional occipital effects. As with the ROI analysis of hypothesized regions, patients (see Figure 7B) only showed prefrontal activation in response to the PART task in the SPM analysis.
Figure 7.

Statistical parametric map projections (SPM |z|) of areas of significant activation when resting baseline was subtracted from Paired Associate Recognition Test (PART) and Wisconsin Card Sorting Test (WCST) conditions. The top two images (A,B) are for PART minus baseline subtractions for 13 demographically matched controls (CT) and 13 patients (PT), respectively. The bottom two images (C,D) present control and patient data for the WCST minus baseline subtraction. Areas of activation (p < .005, uncorrected) are illustrated in the Talairach coordinate system for sagittal, coronal, and transverse planes.
Table 4.
Coordinates and z Scores of Maximally Significant Activations for All Reported Comparisons
| Comparison | Brain region | Coordinates | z score |
|---|---|---|---|
| PART-Base | |||
| Controls | Left & right occipital–parietal | −28, −74, 28 and 24, −68, 28 | 6.16 and 4.71 |
| Right inferior temporal–temporal pole | 52, −6, −20 | 3.76 | |
| Left parietal | −48, −38, 32 | 3.59 | |
| Left & right superior frontal | −26, 18, 52 and 6, 14, 56 | 3.41 and 3.51 | |
| Left middle occipital | −28, −82, 4 | 3.43 | |
| Left precentral gyrus | −46, −4, 40 | 3.10 | |
| Left frontal | −20, 34, −12 | 3.08 | |
| Right inferior frontal–insula | 40, 24, −4 | 2.99 | |
| Patients | Left inferior frontal–middle frontal | −40, 18, 24 | 3.13 |
| WCST-Base | |||
| Controls | Left parietal–occipital | −26, −70, 32 | 4.36 |
| Right middle temporal | 56, −38, −4 | 3.85 | |
| Right inferior temporal | 56, −8, −16 | 3.56 | |
| Right inferior parietal | 34, −52, 44 | 3.49 | |
| Left and right middle frontal | −38, 30, 32 and 40, 18, 32 | 3.21 and 3.34 | |
| Right inferior occipital | 30, −84, −12 | 3.28 | |
| Left cingulate gyrus | −6, −12, 32 | −6, −12, 32 | |
| Left & right occipital | −38, −70, − 16 and 22, −76, 32 | 3.11 and 3.18 | |
| Left parietal | −14, −36, 48 | 3.10 | |
| Left inferior frontal | −40, 8, 32 | 3.08 | |
| Patients | Left occipital | −36, −64, −16 | 3.97 |
| Left superior temporal–parietal | −46, −44, 20 | 3.86 | |
| Left occipital–lingual gyrus | −24, −84, −4 | 3.58 | |
| Left inferior frontal | −38, 16, 20 | 3.45 | |
| Right middle occipital | 32, −86, 0 | 3.18 | |
| Left superior parietal lobule | −30, −62, 44 | 3.16 | |
| Right medial frontal | 14, 8, 56 | 2.97 | |
Note. Stereotactic coordinates are given in x-, y-, and z-coordinates in millimeters, from the atlas of Talairach and Tournoux (1988). Only the foci of changes significant at p < .001, uncorrected, are shown. PART = paired associate recognition; WCST = Wisconsin Card Sorting Test.
For the WCST, results for controls (see Figure 7C) were also generally consistent with the ROI results in Figure 6, with the exception of IT rather than TP, and parietal–occipital rather than OT effects. The SPM analysis of the WCST for patients (see Figure 7D) revealed more areas of activation than did the previous ROI analysis. As previously, effects were revealed in left and right occipital areas, with additional effects found in parietal and frontal areas.
Discussion
In accord with distributed network theories of the pathophysiology of schizophrenia, the results show that patients were equally impaired on executive and declarative memory tasks and had abnormal patterns of task-related rCBF change in both frontal and temporal regions. Controls activated a similar network of IF, OT, and TP regions. This network has been shown to mediate perceptual and mnemonic processing of object identity in primates (Desimone & Ungerleider, 1990; Mishkin & Ungerleider, 1982; Wilson, O’Scalaidhe, & Goldman-Rakic, 1993) and has been implicated in imaging studies of working (e.g., Smith, Jonides, & Koeppe, 1996) and declarative memory (e.g., Tulving, Kapur, Craik, Moscovitch, & Houle, 1994). Hippocampal activation, observed in some declarative memory studies (e.g., Buckner et al., 1995), was not found. Patients failed to activate any hypothesized region for the WCST and activated the DL region for the PART. As in a previous PET study of prose recall in schizophrenia (Andreasen et al., 1996), these results support the conclusion that schizophrenia is best conceptualized as a disruption in the integration of widely distributed brain networks rather than as a disorder of a single brain area.
The pattern of correlations between CBF and performance also seem to support a model of disrupted frontotemporal integration. In controls, greater CBF increase in the anterior portion of the network (SF, DL, and DM) corresponded to better WCST performance, whereas greater increase in more posterior regions (OT) correlated with better PART performance. This divergence in correlational results mirrors the findings when an expanded control sample was previously stratified by performance (Ragland et al., 1997) and illustrates the necessity of integrating performance data to understand differences in the topography of higher cognitive functions that typically share overlapping networks.
In contrast, patients did not show correlations with performance for any brain region during the PART and produced correlations with more posterior regions of the network (PH) during the WCST. The combined results that patients activated anterior (DL) rather than posterior regions on the PART and showed performance correlations with posterior (PH) rather than anterior regions on the WCST lends support to a hypothesis that schizophrenia may produce a reversal in the normal reciprocal relationship between prefrontal and temporal-limbic brain regions (Volkow et al., 1986). To substantiate this hypothesis, it will be necessary to replicate findings that prefrontal activation during executive tasks is accompanied by hippocampal suppression in healthy volunteers (Berman et al., 1986) and to show that this pattern is reversed in schizophrenia. Providing this evidence will likely require converging data from a variety of neurobehavioral probes that tap different portions of the network.
An alternative explanation is that patients failed to show normal patterns of activation because they made fewer responses and were less engaged. This was tested by examining additional control samples matched to the level of patient performance. Like the demographically matched controls, these performance-matched controls continued to show consistent patterns of frontotemporal activation in response to both tasks. This supports the conclusions of previous investigators (Andreasen et al., 1996) that abnormal patterns of task-related activation in schizophrenia are not an epi-phenomenon of poor task engagement or understanding of task demands but rather are a trait phenomenon inherent to the disorder.
We chose to match patients and controls on parental education rather than IQ given evidence that matching on the participant’s education or IQ creates a matching fallacy (Resnick, 1992) resulting in the use of overly low functioning controls. When matched in this manner, the patients had slightly lower (bottom vs. top end of the average range) estimates of verbal intelligence. This difference probably reflects disruption of educational attainment in patients due to illness onset in early adulthood. Although these intellectual differences did not account for poorer PART and WCST performance in patients, it is unclear if these differences in current intellectual performance also reflected differences in premorbid intelligence. The issue of premorbid IQ is potentially relevant to functional imaging research, because several clinical studies (e.g., Alexander et al., 1997) have demonstrated inverse relationships between premorbid IQ and physiological activation in prefrontal and association cortices.
We also chose to use a resting rather than an active baseline as a control condition to investigate activation effects. The serial subtraction of active baselines (e.g., Posner et al., 1988) has the potential benefit of highlighting effects of the cognitive component of primary interest by removing effects due to perceptual and lower level cognitive demands. However, these designs typically do not allow for interaction between cognitive components that, if present, can lead to misleading conclusions (Friston et al., 1996). Serial subtraction procedures also require a large number of scans that was not feasible given the long integration time of the equilibrium method. Therefore, we chose to match tasks on as many lower level cognitive components as possible and to subtract a resting baseline. A resting baseline is relatively unstructured, yet yields reproducible data (Warach et al., 1987) that are sensitive to individual differences (reviewed in Gur & Pearlson, 1993) and correlate with neuropsychological performance (Gur et al., 1994). Although the current procedure assumes linearity, there is less opportunity for interaction effects given a smaller number of comparisons.
To control the chance of Type I error, we examined only 12 hypothesized ROIs. By limiting the number of ROIs, possible similarities between patients and controls may have been masked. This possibility was examined through both an SPM and an ROI post hoc analysis of all brain regions. The expanded ROI analysis revealed few additional areas of patient activation on either task, supporting prior conclusions. The SPM analysis confirmed previous patient results for the PART, but showed additional areas of patient activation for the WCST. Additional areas of activation were also found in the SPM analysis of controls. These slightly conflicting results illustrate the need for further comparison of ROI and SPM methods.
Acknowledgments
This research was supported by National Institutes of Health Grants MH-53326, MH-19112, MH-48539, and MH-43880. We thank Sean Riggin, Kevin Kilroy, and Debbie Meehan of the positron emission tomography center for assistance in data collection; Michelle Yan and Dan Widyono for programming; and Marque Bannerman for coordination of participant recruitment.
References
- Alexander GE, Furey ML, Grady CL, Pietrini P, Brady DR, Mentis MJ, Schapiro MB. Association of premorbid intellectual function with cerebral metabolism in Alzheimer’s disease: Implications for the cognitive reserve hypothesis. American Journal of Psychiatry. 1997;154:165–172. doi: 10.1176/ajp.154.2.165. [DOI] [PubMed] [Google Scholar]
- American Psychiatric Association. Diagnostic and statistical manual of mental disorders. 4. Washington, DC: Author; 1994. [Google Scholar]
- Andreasen NC. Negative symptoms in schizophrenia: Definition and reliability. Archives of General Psychiatry. 1982a;39:784–788. doi: 10.1001/archpsyc.1982.04290070020005. [DOI] [PubMed] [Google Scholar]
- Andreasen NC. Negative vs. positive schizophrenia: Definition and validation. Archives of General Psychiatry. 1982b;39:789–798. doi: 10.1001/archpsyc.1982.04290070025006. [DOI] [PubMed] [Google Scholar]
- Andreasen NC, O’Leary DS, Cizadlo T, Arndt S, Rezai K, Boles Ponto LL, Watkins GL, Hichwa RD. Schizophrenia and cognitive dysmetria: A positron-emission tomography study of dysfunctional prefrontal-thalamic-cerebellar circuitry. Proceedings of the National Academy of Sciences, USA. 1996;93:9985–9990. doi: 10.1073/pnas.93.18.9985. [DOI] [PMC free article] [PubMed] [Google Scholar]
- Berg EA. A simple, objective technique for measuring flexibility in thinking. Journal of General Psychology. 1948;39:15–22. doi: 10.1080/00221309.1948.9918159. [DOI] [PubMed] [Google Scholar]
- Berman KF, Ostrem JL, Randolph C, Gold J, Goldberg TE, Coppola R, Carson RE, Herscovitch P, Weinberger DR. Physiological activation of a cortical network during performance of the Wisconsin Card Sorting Test: A positron emission tomography study. Neuropsychologia. 1995;33:1027–1046. doi: 10.1016/0028-3932(95)00035-2. [DOI] [PubMed] [Google Scholar]
- Berman KF, Zec RF, Weinberger DR. Physiological dysfunction of dorsolateral prefrontal cortex in schizophrenia: II. Role of neuroleptic treatment, attention, and mental effort. Archives of General Psychiatry. 1986;43:126–135. doi: 10.1001/archpsyc.1986.01800020032005. [DOI] [PubMed] [Google Scholar]
- Blauenstein UW, Halsey JH, Wilson EM, Wills EL, Risberg J. 133-Xenon inhalation method, analysis of reproducibility: Some of its physiological implications. Stroke. 1977;8:92–102. doi: 10.1161/01.str.8.1.92. [DOI] [PubMed] [Google Scholar]
- Buckner RL, Petersen SE, Ojemann JG, Miezin FM, Squire LR, Raichle ME. Functional anatomical studies of explicit and implicit memory retrieval tasks. The Journal of Neuroscience. 1995;15:12–29. doi: 10.1523/JNEUROSCI.15-01-00012.1995. [DOI] [PMC free article] [PubMed] [Google Scholar]
- Catafau AM, Parellada E, Lomena FJ, Bernardo M, Pavia J, Ros D, Setoain J, Gonzalez-Monclus E. Prefrontal and temporal blood flow in schizophrenia: Resting and activation technetium-99m-HMPAO SPECT patterns in young neuroleptic-naive patients with acute disease. Journal of Nuclear Medicine. 1994;35:935–941. [PubMed] [Google Scholar]
- Chapman LJ, Chapman JP. Strategies for resolving the heterogeneity of schizophrenics and their relatives using cognitive measures. Journal of Abnormal Psychology. 1989;98:357–366. doi: 10.1037//0021-843x.98.4.357. [DOI] [PubMed] [Google Scholar]
- Cohen J. Statistical power analysis for the behavioral sciences. 2. Hillsdale, NJ: Erlbaum; 1988. [Google Scholar]
- Corcoran R, Upton D. Role for the hippocampus in card sorting? Cortex. 1993;29:293–304. doi: 10.1016/s0010-9452(13)80182-7. [DOI] [PubMed] [Google Scholar]
- Desimone R, Ungerleider LG. In: Handbook of neuropsychology. Boller F, Grafman J, editors. Amsterdam: Elsevier; 1990. pp. 267–299. [Google Scholar]
- Frackowiak RSJ, Friston KJ. Functional anatomy of the human brain: Positron emission tomography—a new neuroanatomical technique. Journal of Anatomy. 1994;184:211–225. [PMC free article] [PubMed] [Google Scholar]
- Frackowiak RSJ, Lenzi GL, Jones T, Heather JD. Quantitative measurement of regional cerebral blood flow and oxygen metabolism in man using 15O and positron emission tomography: Theory, procedure and normal values. Journal of Computer Assisted Tomography. 1980;4:727–736. doi: 10.1097/00004728-198012000-00001. [DOI] [PubMed] [Google Scholar]
- Friston KJ, Price CJ, Fletcher P, Moore C, Frackowiak RSJ, Dolan RJ. The trouble with cognitive subtraction. Neuroimage. 1996;4:97–104. doi: 10.1006/nimg.1996.0033. [DOI] [PubMed] [Google Scholar]
- Fuster JM. The prefrontal cortex: Anatomy, physiology, and neuropsychology of the frontal lobe. New York: Raven Press; 1980. [Google Scholar]
- Goldberg TE, Weinberger DR, Bennan KF, Pliskin NH, Podd MH. Further evidence for dementia of the prefrontal type in schizophrenia? A controlled study of teaching the Wisconsin Card Sorting Test. Archives of General Psychiatry. 1987;44:1008–1014. doi: 10.1001/archpsyc.1987.01800230088014. [DOI] [PubMed] [Google Scholar]
- Goldman-Rakic PS, Selemon LD, Schwartz ML. Dual pathways connecting the dorsolateral prefrontal cortex with the hippocampal formation and parahippocampal cortex in the rhesus monkey. Neuroscience. 1984;12:719–743. doi: 10.1016/0306-4522(84)90166-0. [DOI] [PubMed] [Google Scholar]
- Grant DA, Berg EA. A behavioral analysis of degree of reinforcement and ease of shifting to a new response in a Weigl-type card-sorting problem. Journal of Experimental Psychology. 1948;38:404–411. doi: 10.1037/h0059831. [DOI] [PubMed] [Google Scholar]
- Gur RC, Gur RE. Hypofrontality in schizophrenia: RIP. The Lancet. 1995;345:1383–1384. doi: 10.1016/s0140-6736(95)92591-0. [DOI] [PubMed] [Google Scholar]
- Gur RC, Gur RE, Obrist WD, Hungerbuhler JP, Yoynkin D, Rosen AD, Skolnick BE, Reivich M. Sex and handedness differences in cerebral blood flow during rest and cognitive activity. Science. 1982;217:659–661. doi: 10.1126/science.7089587. [DOI] [PubMed] [Google Scholar]
- Gur RC, Ragland JD, Resnick SM, Jaggi J, Skolnick BE, Muenz L, Gur RE. Lateralized increases in cerebral blood flow during performance of verbal and spatial tasks: Relationship with performance level. Brain and Cognition. 1994;24:244–258. doi: 10.1006/brcg.1994.1013. [DOI] [PubMed] [Google Scholar]
- Gur RE, Jaggi JL, Shtasel DL, Ragland JD, Gur RC. Cerebral blood flow in schizophrenia: Effects of memory processing on regional activation. Biological Psychiatry. 1994;35:3–15. doi: 10.1016/0006-3223(94)91160-6. [DOI] [PubMed] [Google Scholar]
- Gur RE, Pearlson GD. Neuroimaging in schizophrenia research. Schizophrenia Bulletin. 1993;19:337–353. doi: 10.1093/schbul/19.2.337. [DOI] [PubMed] [Google Scholar]
- Gur RE, Resnick SM, Alavi A, Our RC, Caroff S, Dann R, Silver F, Saykin AJ, Chawluk JB, Kushner M, Reivich M. Regional brain function in schizophrenia: I. A positron emission tomography study. Archives of General Psychiatry. 1987;44:119–125. doi: 10.1001/archpsyc.1987.01800140021003. [DOI] [PubMed] [Google Scholar]
- Heaton RK. The Wisconsin Card Sorting Test manual. Odessa, FL: Psychological Assessment Resources; 1981. [Google Scholar]
- Ingvar DH, Franzen G. Abnormalities of cerebral blood flow distribution in patients with chronic schizophrenia. Acta Psychiatrica Scandinavica. 1974;50:425–62. doi: 10.1111/j.1600-0447.1974.tb09707.x. [DOI] [PubMed] [Google Scholar]
- Jones SC, Greenberg JH, Dann R, Robinson GD, Jr, Kushner M, Alavi A, Reivich M. Cerebral blood flow with the continuous infusion of oxygen-15-labeled water. Journal of Cerebral Blood Flow and Metabolism. 1985;5:566–575. doi: 10.1038/jcbfm.1985.85. [DOI] [PubMed] [Google Scholar]
- Kaplan HI, Saddock BJ. Synopsis of psychiatry behavioral sciences/clinical psychiatry. 5. Baltimore, MD: Williams & Williams; 1988. p. 105. [Google Scholar]
- Karp JS, Kinahan PE, Muehllehner G. Effect of increased axial field of view on the performance of a volume PET scanner. IEEE Transactions on Medical Imaging. 1993;12:299–306. doi: 10.1109/42.232259. [DOI] [PubMed] [Google Scholar]
- Lammertsma AA, Frackowiak RSJ, Lenzi GL, Heather JD, Pozzilli C, Jones T. Accuracy of the oxygen-15 steady state technique for measuring rCBF and rCMR (O2): Tracer modeling, statistics and spatial sampling. Journal of Cerebral Blood Flow Metabolism. 1981;1:S3–S4. [Google Scholar]
- Marenco S, Coppola R, Daniel DG, Zigun JR, Weinberger DR. Regional cerebral blood flow during the Wisconsin Card Sorting Test in normal subjects studied by Xenon-133 dynamic SPECT: Comparison of absolute values, percent distribution values, and covariance analysis. Psychiatry Research: Neuroimaging. 1993;50:177–192. doi: 10.1016/0925-4927(93)90029-h. [DOI] [PubMed] [Google Scholar]
- Mishkin M, Ungerleider LG. Contribution of striate inputs to the visuospatial functions of parieto-preoccipital cortex in monkeys. Behavioral Brain Research. 1982;6:57–77. doi: 10.1016/0166-4328(82)90081-x. [DOI] [PubMed] [Google Scholar]
- Nauta WJH. The problem of the frontal lobe: A reinterpretation. Journal of Psychiatric Research. 1971;8:167–187. doi: 10.1016/0022-3956(71)90017-3. [DOI] [PubMed] [Google Scholar]
- Overall JR, Gorham DR. The brief psychiatric rating scale. Journal of Operational Psychiatry. 1980;11:48–64. [Google Scholar]
- Parellada E, Catafau AM, Bernado M, Lomena F, Gonzalez-Monclus E, Setoain J. Prefrontal dysfunction in young acute neuroleptic-naive schizophrenic patients: A resting and activation SPECT study. Psychiatry Research. 1994;55:131–139. doi: 10.1016/0925-4927(94)90021-3. [DOI] [PubMed] [Google Scholar]
- Posner MI, Petersen SE, Fox PT, Raichle ME. Localization of cognitive operations in the human brain. Science. 1988;240:1627–1631. doi: 10.1126/science.3289116. [DOI] [PubMed] [Google Scholar]
- Raczkowski D, Kalat J, Nebes R. Reliability and validity of some handedness questionnaire items. Neuropsychologia. 1974;12:43–48. doi: 10.1016/0028-3932(74)90025-6. [DOI] [PubMed] [Google Scholar]
- Ragland JD, Censits DM, Gur RC, Glahn DC, Gallacher F, Gur RE. Assessing declarative memory in schizophrenia using Wisconsin Card Sorting Test stimuli: The Paired Associate Recognition Test. Psychiatry Research. 1996;60:135–145. doi: 10.1016/0165-1781(96)02811-9. [DOI] [PMC free article] [PubMed] [Google Scholar]
- Ragland JD, Glahn DC, Gur RC, Censits DM, Smith RJ, Mozley PD, Alavi A, Gur RE. PET regional cerebral blood flow change during working and declarative memory: Relationship with task performance. Neuropsychology. 1997;11:222–231. doi: 10.1037//0894-4105.11.2.222. [DOI] [PMC free article] [PubMed] [Google Scholar]
- Ragland JD, Gur RC, Deutsch G, Censits DM, Gur RE. Reliability and construct validity of the Paired-Associate Recognition Memory Test: A test of declarative memory using Wisconsin Card Sorting Stimuli. Psychological Assessment. 1995;7:25–32. [Google Scholar]
- Resnick SM. Matching for education in studies of schizophrenia [Letter] Archives of General Psychiatry. 1992;49:246. doi: 10.1001/archpsyc.1992.01820030078011. [DOI] [PubMed] [Google Scholar]
- Resnick SM, Karp JS, Turetsky B, Gur RE. Comparison of anatomically defined versus physiologically based regional localization: Effects on PET-FDG quantitation. Journal of Nuclear Medicine. 1994;34:2201–2207. [PubMed] [Google Scholar]
- Risberg J. Regional cerebral blood flow measurements by 133-Xe inhalation: Methodology and clinical applications in neuropsychology and psychiatry. Brain and Language. 1980;9:9–34. doi: 10.1016/0093-934x(80)90069-3. [DOI] [PubMed] [Google Scholar]
- Rodrigues G, Warkentin S, Risberg J, Rosadini G. Sex differences in regional cerebral blood flow. Journal of Cerebral Blood Flow and Metabolism. 1988;8:783–789. doi: 10.1038/jcbfm.1988.133. [DOI] [PubMed] [Google Scholar]
- SAS Institute Inc. SAS/STAT Software (Version 6.11) Cary, NC: Author; 1996. [Google Scholar]
- Saykin AJ, Gur RC, Gur RE, Mozley D, Mozley LH, Resnick SM, Kester DB, Stafiniak P. Neuropsychological function in schizophrenia: Selective impairment in memory and learning. Archives of General Psychiatry. 1991;48:618–624. doi: 10.1001/archpsyc.1991.01810310036007. [DOI] [PubMed] [Google Scholar]
- Shtasel DL, Gur RE, Gallacher F, Heimberg C, Cannon T, Gur RC. Phenomenology and functioning in first episode schizophrenia. Schizophrenia Bulletin. 1992;18:449–462. doi: 10.1093/schbul/18.3.449. [DOI] [PubMed] [Google Scholar]
- Shtasel DL, Gur RE, Mozley PD, Richards J, Taleff MM, Heimberg C, Gallacher F, Gur RC. Volunteers for biomedical research: Recruitment and screening of normal controls. Archives of General Psychiatry. 1991;48:1022–1025. doi: 10.1001/archpsyc.1991.01810350062010. [DOI] [PubMed] [Google Scholar]
- Smith EE, Jonides J, Koeppe RA. Dissociating verbal and spatial working memory using PET. Cerebral Cortex. 1996;6:11–20. doi: 10.1093/cercor/6.1.11. [DOI] [PubMed] [Google Scholar]
- Smith RJ, Karp JS, Muehllehner G. The countrate performance of the volume imaging PENN PET scanner. IEEE Transactions on Medical Imaging. 1994;13:610–618. doi: 10.1109/42.363107. [DOI] [PubMed] [Google Scholar]
- Smith RJ, Shao L, Freifelder R, Karp JS, Ragland JD. Quantitative measurement of cerebral blood flow in volume imaging PET scanners. IEEE Transactions on Nuclear Science. 1995;42:1018–1023. [Google Scholar]
- Squire LR. Memory and the hippocampus: A synthesis from findings with rats, monkeys, and humans. Psychological Review. 1992;99:195–231. doi: 10.1037/0033-295x.99.2.195. [DOI] [PubMed] [Google Scholar]
- Sullivan EV, Mathalon DH, Zipursky RB, Kersteen-Tucker Z, Knight RT, Pfefferbaum A. Factors of the Wisconsin Card Sorting Test as measures of frontal-lobe function in schizophrenia and in chronic alcoholism. Psychiatry Research. 1993;46:175–199. doi: 10.1016/0165-1781(93)90019-d. [DOI] [PubMed] [Google Scholar]
- Talairach J, Tournoux P. Co-planar stereotaxic atlas of the human brain: 3-dimensional proportional system: An approach to cerebral imaging. New York: Thieme Medical Publishers; 1988. [Google Scholar]
- Tulving E, Kapur S, Craik FIM, Moscovitch M, Houle S. Hemispheric encoding/retrieval asymmetry in episodic memory: Positron emission tomography findings. Proceedings of the National Academy of Sciences, USA. 1994;91:2016–2020. doi: 10.1073/pnas.91.6.2016. [DOI] [PMC free article] [PubMed] [Google Scholar]
- Turetsky BI, Cowell PE, Gur RC, Grossman RI, Shtasel DL, Gur RE. Frontal and temporal lobe brain volumes in schizophrenia: Relationship to symptomatology and clinical subtype. Archives of General Psychiatry. 1995;52:1061–1070. doi: 10.1001/archpsyc.1995.03950240079013. [DOI] [PubMed] [Google Scholar]
- Volkow ND, Brodie JD, Wolf AP, Gomez-Mont F, Cancro R, Van Gelder P, Russell JAG, Overall J. Brain organization in schizophrenia. Journal of Cerebral Blood Flow and Metabolism. 1986;6:441–446. doi: 10.1038/jcbfm.1986.77. [DOI] [PubMed] [Google Scholar]
- Warach S, Gur RC, Gur RE, Skolnick BE, Obrist WD, Reivich M. The reproducibility of the Xe-133 inhalation technique in resting studies: Task order and sex related effects in healthy young adults. Journal of Cerebral Blood Flow and Metabolism. 1987;7:702–708. doi: 10.1038/jcbfm.1987.124. [DOI] [PubMed] [Google Scholar]
- Wechsler D. Wechsler Memory Scale—Revised [Manual] San Antonio, TX: Psychological Corp; 1987. [Google Scholar]
- Weinberger DR, Berman KP, Suddath R, Torrey EF. Evidence of dysfunction of a prefrontal-limbic network in schizophrenia: A magnetic resonance imaging and rCBF flow study of discordant monozygotic twins. American Journal of Psychiatry. 1992;7:890–897. doi: 10.1176/ajp.149.7.890. [DOI] [PubMed] [Google Scholar]
- Weinberger DR, Berman KF, Zec RF. Physiologic dysfunction of dorsolateral prefrontal cortex in schizophrenia: I. Regional cerebral blood flow evidence. Archives of General Psychiatry. 1986;43:114–124. doi: 10.1001/archpsyc.1986.01800020020004. [DOI] [PubMed] [Google Scholar]
- Wilson FAW, O’Scalaidhe SP, Goldman-Rakic PS. Dissociation of object and spatial processing domains in primate prefrontal cortex. Science. 1993;260:1955–1958. doi: 10.1126/science.8316836. [DOI] [PubMed] [Google Scholar]