

Abstract
Biguanides are widely used antihyperglycemic agents for diabetes mellitus and prediabetes treatment. Complex I is the rate limiting step of the mitochondrial electron transport chain (ETC), a major source of mitochondrial free radical production, and a known target of biguanides. Complex I has two reversible conformational states, active and de-active. The deactivated state is promoted in the absence of substrates, but is rapidly and fully reversed to the active state in the presence of NADH. The objective of this study was to determine the relative sensitivity of active/de-active complex I to biguanide-mediated inhibition and resulting superoxide radical (O2•−) production. Using isolated rat heart mitochondria, we show that deactivation of complex I sensitizes it to metformin and phenformin (4- and 3-fold, respectively), but not to other known complex I inhibitors, such as rotenone. Mitochondrial O2•− production by deactivated complex I was measured fluorescently by the NADH-dependent 2-hydroxyethidium formation at alkaline pH to impede reactivation. Superoxide production was 260.4% higher than in active complex I at pH 9.4. However, phenformin treatment of de-active complex I decreased O2•− production by 14.9% while rotenone increased production by 42.9%. Mitochondria isolated from rat hearts subjected to cardiac ischemia, a condition known to induce complex I deactivation, were sensitized to phenformin:mediated complex I inhibition. This supports that the effects of biguanides are likely to be influenced by the complex I state in vivo. These results demonstrate that the complex I active/de-active states are a determinant in biguanide-mediated inhibition.
INTRODUCTION
Biguanides are water-soluble, anti-hyperglycemic agents used in the treatment of diabetes mellitus (1) and for potential anti-cancer pharmacotherapy (2–5). The mitochondrial electron transport chain (ETC) complex I was the first identified target of metformin (6–10). This inhibition of complex I was hypothesized to increase AMP and activation of downstream signaling pathways (10–12). However, metformin is a poor inhibitor of complex I at physiologically active concentrations (13–15). More recently phenformin, a lipophilic derivative of metformin, has been shown to inhibit complex I more effectively at a lower concentration (7, 16).
Mitochondrial complex I catalyzes the oxidation of NADH, a reaction that is the rate limiting step in electron transport, and is a major site of superoxide anion (O2•−) generation (17). Inhibition of complex I activity is known to increase this capacity to generate O2•−. Complex I is found in two reversible states: the active form (A-form) and the de-active form (D-form) (18–21). The transition from A to D form is referred to as thermal deactivation because the in vitro process requires high activation energy (270 kJ/mol) (22) and physiological relevant temperatures (> 30°C) (23). The deactivation process is slow and the first-order decay rate constant is reported (24) k = 0.034 min−1. In contrast, the D-form undergoes an enzyme turnover-dependent and rapid reactivation (D-form → A-form) in the presence of NADH. However, reactivation is retarded in the presence of divalent cations, high pH, and/or sulfhydryl-modifying reagents such as N-ethylmaleimide (NEM) (25). This indicates the D-form undergoes conformational changes that exposes the enzyme's reactive sulfhydryl moieties. The reactive thiols of several complex I subunits have been identified (26, 27) as targets for post-translational modifications (27–32). However, the effect of such conformational changes to the sensitivity of complex I inhibitors and their resulting effects on O2•− production have not been well scrutinized.
Mitochondrial function is essential for the maintenance of cellular energy status and for the production of free radicals that influence redox regulated processes. Inhibitors of complex I, such as biguanides, are expected to have large effects on cellular bioenergetics and oxidative stress. It is therefore critical to understand the conditions that affect the magnitude of this inhibition. Recent work suggests that complex I in the absence of NADH is sensitized to biguanide:mediated inhibition (7). However, the direct effect of biguanides on active versus de-active complex I is unknown. The goal of the present study was to determine if complex I is inhibited by lower concentrations of biguanides in the de-active state. Furthermore, we sought to identify how deactivation of complex I affects O2•− production.
MATERIALS AND METHODS
Reagents and Animals
Antimycin A, metformin, NADH, phenformin, rotenone, ubiquinone-1, and superoxide dismutase (CuZn-SOD), were purchased from Sigma. Hydroethidine was purchased from Life Technologies. CMH was purchased from Enzo Life Sciences. Male Sprague–Dawley rats (250–300 g) were obtained from Harlan Laboratories. All animal procedures were in accordance with OMRF (Oklahoma Medical Research Foundation) Institutional Animal Care and Use Committee guidelines.
Preparation and Perfusion of Isolated Rat Hearts
Male Sprague–Dawley rats were decapitated and hearts were excised and placed in 37 °C modified Krebs–Henseleit buffer (120 mM NaCl, 4.8 mM KCl, 2.0 mM CaCl2, 1.25 mM MgCl2, 1.25 mM KH2PO4, 25 mM NaHCO3 and 5 mM glucose) to remove blood. Extraneous tissue was rapidly removed, the aorta was cannulated, and the heart was perfused in retrograde fashion according to Langendorff with modified Krebs–Henseleit buffer, at 37 °C, saturated with 95% O2/5% CO2. Hearts were placed in a water-jacketed chamber (37 °C) and the perfusion rate was maintained at 10 mL/min. The elapsed time between isolation of the heart and perfusion was approximately 1.0 min. Experiments consisted of the following protocols: (a) a 60 min normoxic perfusion, or (b) a 30 min perfusion followed by a 45 min no-flow global ischemia.
Isolation of Mitochondria and Cardiac Submitochondrial Particles (SMPs)
Subsarcolemmal mitochondria were isolated from hearts as previously described (33). The isolation protocol was completed at 4 °C and in the absence of respiratory substrates, which would be expected to minimize oxygen-induced changes following the ischemic period. Hearts were immersed, and rinsed in ice-cold isolation buffer containing 210 mM Mannitol, 70 mM Sucrose, 10 mM MOPS, and 1.0 mM EDTA at pH 7.4. The hearts were then minced and homogenized in 20 mL of the isolation buffer with a Polytron homogenizer (3 × 2 s passes). The homogenate was then centrifuged at 500g for 5.0 min and supernatant was collected. The supernatant was then filtered through cheese cloth and then centrifuged at 10000g for 10 min. The resulting mitochondria pellets were washed, resuspended in 25 mM MOPS at pH 7.4, and immediately snap-frozen in liquid N2 for analysis of superoxide anion production and electron transport chain activities. For preparation of SMPs, hearts were snap-frozen in liquid N2 and pulverized. Pulverized tissue was placed into 20 mL of 25 mM MOPS and 1.0 mM EDTA (pH 7.4) and homogenized by 4 × 4 s passes using a Polytron homogenizer followed by 15 passes with a Potter-Elvejem homogenizer. Homogenate was then centrifuged at 750g for 5.0 min, and the supernatant was collected. The supernatant was centrifuged at 10000g for 20 min, and the resulting pellet was resuspended in 12 mL of 25 mM MOPS and 1.0 mM EDTA (pH 7.4) (2.0−5.0 mg/mL). Following two cycles of freezing (in liquid N2) and thawing, the solution was sonicated on ice (8 × 15 s with 30 s intervals, sonic dismembrator output of 20 W). The sonicated preparation was then centrifuged at 10000g for 7.0 min to remove unbroken mitoplasts. The supernatant was centrifuged at 40000g for 60 min. The resulting pellet, containing SMPs, was resuspended in 25 mM MOPS (pH 7.4) at a protein concentration of 1.0 mg/mL. Protein concentrations were determined by the BCA method (Thermo), with BSA as a standard. All the pre-assay thermal deactivation procedures were performed as previously described (34), with minor modifications. In brief, solubilized mitochondria/SMPs were incubated at 37 °C for 45 min in a dry heating block in the absence of substrates. Subsequently, the reactivation of thermally deactivated sample was achieved by pre-incubation of the mitochondria with 10 μM of NADH for 2.0 min at room temperature.
Where indicated, experiments were performed on solubilized mitochondria, defined as isolated mitochondria that are broken open to allow access to ETC substrates. Briefly, mitochondria were resuspended at a concentration of 1.0 mg/mL in 25 mM MOPS (pH 7.4) and snap:frozen in liquid N2 and thawed three times.
Electron Transport Chain Enzymatic Analyses
Mitochondrial electron transport chain enzymatic activity assays were performed as previously described (33). Briefly, all assays were performed in 25 mM KCl, 25 mM MOPS at pH 7.4 (25 °C) with 25 μg/mL frozen:thawed mitochondria except where noted. NADH Oxidase Activity: NADH oxidase activity, an assessment of overall electron transports through complexes I, III, and IV, was measured spectrophotometrically utilizing an Agilent 8453 diode array UV–Vis spectrophotometer. Activity was measured as the rate of NADH oxidation (ε340 = 6200 M−1 cm−1) following addition of 200 μM NADH. Activity was completely inhibited by antimycin A. Complex I: Following addition of 50 nM antimycin A and 100 NM ubiquinone-1, complex I activity was initiated with NADH (200 μM). Activity was measured spectrophotometrically as the rate of NADH oxidation (ε340 = 6200 M−1 cm−1). Activity required the presence of ubiquinone-1 and was inhibited by rotenone (100 nM) indicating that NADH utilization was dependent on complex I activity. Complex III and IV (III–IV) combination: Flow of electrons from complex III through complex IV was initiated upon addition of ubiquinol-1 (100 μM). Activity was measured spectrophotometrically as the rate of ubiquinolμ1 oxidation to ubiquinone-1 (ε280 = 13,700 M−1 cm−1). Antimycin A or CN− inhibited activity indicating transport of electrons from complex III through complex IV.
Superoxide Anion Production Measurements
The NADH:supported rate of superoxide anion (O2•−) production was measured as described previously (35). Briefly, the oxidation of hydroethidine by O2•− to the fluorescent product 2-hydroxyethidium was measured utilizing a Shimadzu RF-5301 spectrofluorometer. The fluorescent signals were recorded (excitation, 480 nm; emission, 567 nm) over time utilizing 10 μM hydroethidine and 500 NM NADH. CuZn-SOD (8.0 U/mL) was used to test the specificity of the measurement for superoxide anion. Where indicated, the complex III inhibitor, antimycin A (50 nM), was included. It should be noted that oxidation of hydroethidine by O2•− resulted in a product with properties (reverse phase HPLC elution profile and fluorescence properties) consistent with 2-hydroxyethidium and not ethidium as reported (36, 37). Nevertheless, the structurally related compound ethidium was used as a standard to estimate the relative rate of O2•− production due to the absence of commercially available 2-hydroxyethidium standard.
EPR Spin-Trapping Experiments
The EPR spectra were obtained by using a Bruker EMX spectrometer (Billerica, MA) operating at X-band (~9.78 GHz) with a 100 kHz modulation frequency and ER 41225SHQ high:sensitivity cavity. Typical settings for the spectrometer are: microwave power, 6.325 mW; modulation amplitude, 1.5 G; scan range, 50 G; time constant, 82 ms. The reaction mixtures indicated in the figure legend were assembled in microcentrifuge tubes, and after indicated incubation time the mixtures were transferred to a quartz flat cell for the EPR determination. For the kinetics experiment shown in Figure 5B, the reaction was initiated in the flat cell in the cavity and time course (fixed-field) measurement was performed. All the EPR experiments were performed in 25 mM MOPS (pH 7.4), 25 mM KCl, 1 mM EDTA, and 50 NM DTPA, at room temperature.
Figure 5. Complex I locked in the deactivated state produces less superoxide.
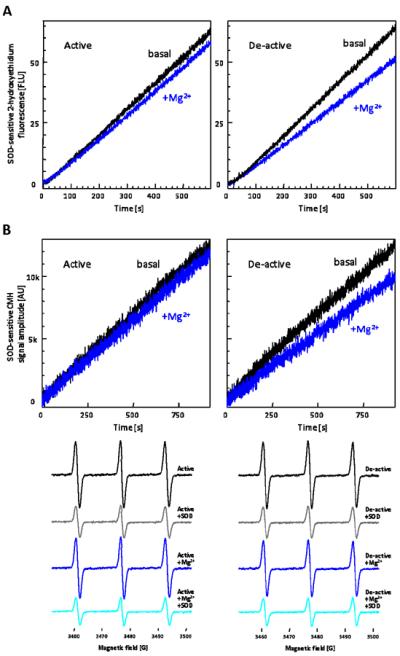
(A) Representative traces are SOD-sensitive 2-hydroxyethidium formation by non-treated (active) and thermally deactivated (de-active) solubilized mitochondria incubated with 500 μM NADH and 50 nM antimycin A in the absence or presence of 5 mM Mg2+. (B) Superoxide production kinetics were assessed by EPR spin-trapping utilizing a cyclic hydroxylamine, CMH (55). Active or de-active solubilized mitochondria was incubated with 500 μM NADH, 50 nM antimycin A, and 500 μM CMH, in the absence and presence of 10 mM Mg2+. Traces represent SOD-sensitive CMH signal formation. Reaction was initiated in flat cell in cavity and peak intensity was monitored over time. End-point spectra were measured at 20 min after the reaction initiated. These traces and spectra are representative figures from five separate experiments.
Statistical Analysis
Data are presented as means ± S.D. or S.E.M., as indicated. The data were evaluated utilizing a two:tailed Student's t test.
RESULTS
Characterization of thermally deactivated (D) complex I and phenformin sensitivity
Initial experiments were undertaken to determine the conditions that deactivate complex I in rat heart mitochondria. Solubilized mitochondria were heated for 45 min at 37 °C and then complex I activity was measured in the presence of increasing concentrations of Mg2+. Divalent cations, such as Mg2+, interact with and stabilize the de-active form of complex I (25). As shown in Figure 1A, complex I activity was sensitive to Mg2+-mediated inhibition following heating while control samples were largely unaffected. Pretreatment of thermally deactivated samples with NADH, which reactivates complex I, attenuated this sensitivity to Mg2+ (Figure 1A). This demonstrates deactivation is reversible. Heating alone induced a 12% decrease in basal complex I activity in the absence of any added Mg2+, suggesting additional mechanisms are involved in the thermal process that include non:reversible inactivation. Furthermore, the overall electron transport chain (ETC) activity, as determined by NADH oxidase activity, exhibited a similar modest decline of 12.3% decrease (943.8 ± 20.1 nmols/min/mg and 827.6 ± 39.3 nmols/min/mg, for active and de-active, respectively; n = 5) following heating. These results demonstrate thermal treatment deactivates complex I while having little effect on the overall ETC.
Figure 1. Mitochondrial complex I is sensitized to Mg2+/biguanides after thermal deactivation.

Complex I activities, in active, de-active, and reactivated states, were measured spectrophotometrically as the rate at which solubilized mitochondria at 25 μg/mL oxidized NADH (200 μM) in the presence of 50 nM antimycin A and 100 μM ubiquinone, in the absence or presence of indicated concentrations of (A) Mg2+, (B) metformin, or (C) phenformin. Values are expressed as specific activities (left panels) and as percentages of the untreated basal activities (right panels). Values represent means ± S.D. (n = 5). Symbols (*) indicate statistical significance between active (control) and de-active groups (p < 0.005) using a Student t-test.
Biguanides inhibit complex I activity in intact mitochondria (9, 10). However, the molecular mechanisms of biguanide:mediated complex I inactivation are unknown and we hypothesized that deactivation of complex I sensitizes it to inhibition. Thus, the relative sensitivity of active versus de-active complex I to inhibition by biguanides was next assessed. As shown in Figure 1B, the sensitivity of metformin to complex I was greatly enhanced by thermal deactivation. Similar to the profile with Mg2+, the sensitivity was reversed by reactivation of complex I. It should be noted, however, that the effective concentration range of metformin required to observe complex I inhibition in vitro also exhibited non-specific inhibition of other ETC components. Specifically, 25 mM of metformin inhibits 12.1% of active complex I activity (Figure 1B), whereas the same concentration of metformin suppresses 44.6% of complex III–IV activity (ubiquinol oxidase activity) and 59.0% of NADH oxidase activity (the combination of complex I-III-IV activities). In contrast to metformin the related biguanide, phenformin, exhibited inhibition of complex I in the submillimolar range after thermal deactivation (Figure 1C). A similar concentration range has been reported recently for phenformin:mediated inhibition in complex I activities (7). This inhibition was attenuated by reactivation of the enzyme. In this concentration range, phenformin exhibited specificity towards inhibition of complex I. For example, the sensitivity to complex III–IV activity was minimal and did not change after thermal treatment (Figure 2A).
Figure 2.
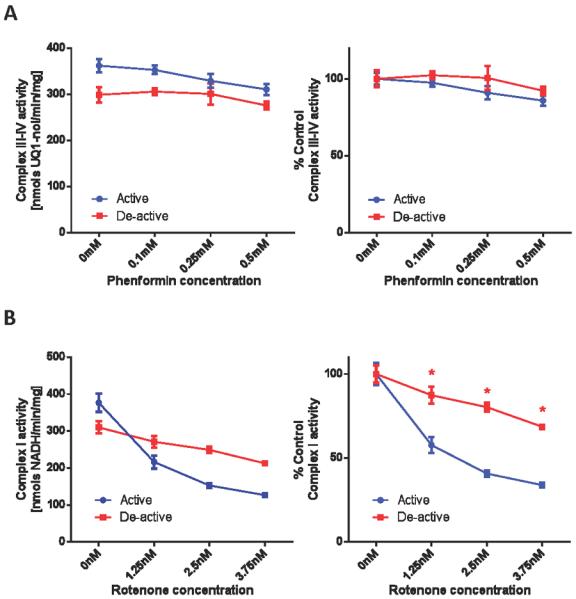
(A) Phenformin has no effect on complex III-IV activity. Complex III-IV activities, in non-treated (active) and thermally deactivated (de-active) mitochondria, were measured spectrophotometrically as the rate at which solubilized mitochondria at 5 μg/mL oxidized 100 μM ubiquinol in the absence or presence of indicated concentrations of phenformin. (B) Complex I is desensitized to rotenone after deactivation. Complex I activities, in non-treated (active) and thermally deactivated (de-active) mitochondria, were measured in the absence of presence of indicated concentration of rotenone. Values are expressed as specific activities (left panels) and as percentages of the untreated activities (right panels). Values represent means ± S.D. (n = 5). Symbols (*) indicate statistical significance (p < 0.005) using a Student t-test.
We next sought to assess whether thermal deactivation of complex I non-selectively sensitizes it to complex I inhibitors. As shown in Figure 2B, the linear concentration range of inhibition of complex I by rotenone lies in a narrow range (0–3 nM). There was a general trend of decreased sensitivity to rotenone after thermal deactivation. This suggests that the mode of inhibition of biguanides is distinct from rotenone, a semiquinone antagonist (38), and does not universally occur for complex I inhibitors.
Modulation of mitochondrial free radical production by deactivation and phenformin-mediated inhibition of complex I
Complex I is a major site of mitochondrial superoxide anion (O2•−) production (17). How this production is affected by deactivation is not well understood. This is partly because complex I rapidly reactivates in the presence of NADH, where the turn:over t1/2 ~10s (21), thus making it difficult to assess the deactivation effect on NADH:dependent O2•− production. To address this difficulty, the following experiment was performed. The effect of thermal deactivation on the basal capacity of O2•− production in control submitochondrial particles (SMPs) was measured as the NADH-dependent, SOD-sensitive, increase in 2:hydroxyethidium fluorescence. SMPs, which are essentially devoid of matrix proteins, were used for these experiments to minimize endogenous antioxidant activities. As shown in Figure 3A, the stimulated rate of O2•− production by deactivation is not observed in vitro at physiological pH 7.4 likely because of the aforementioned rapid reactivation. In contrast to pH 7.4, the rate of reactivation is significantly decreased at alkaline pH (25). By exploiting this property, we were able to observe a significant increase (260.4% ± 21.7%; n = 5) in the substrate-dependent rate of O2•− production at pH 9.4. This stimulated rate of O2•− production diminished as complex I returned to the active state. Figure 3B demonstrates the effect of pH on the reactivation of NADH oxidase activity under the same conditions that O2•− production was measured. At pH 7.4, complex I reactivates quickly and essentially there is no difference in the rate of NADH oxidation between active and deactivated samples. In contrast, a decrease in the initial rate of NADH oxidation is observable at alkaline pH (56.4% ± 2.4%). These results indicate the complex I active/de-active status regulates mitochondrial O2•− production, and the rate of O2•− production inversely correlates to ETC activity.
Figure 3. Increased mitochondrial superoxide production by thermal deactivation is observed at alkaline pH.
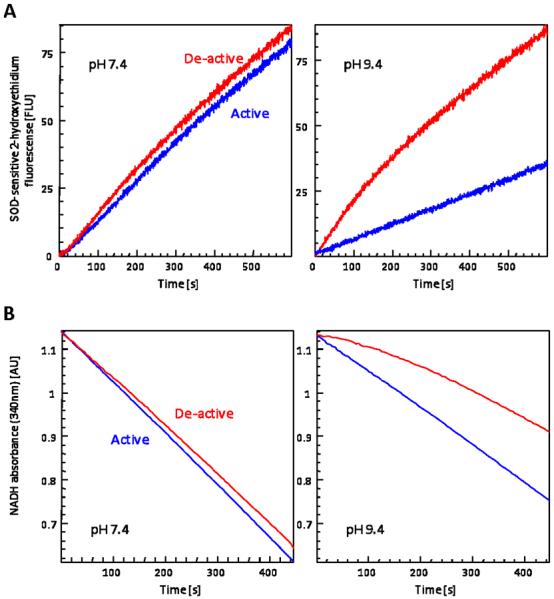
(A) Superoxide production kinetics were monitored fluorimetrically as the rate at which non-treated (active) or thermally deactivated (de-active) 25 μg/mL SMPs oxidize hydroethidine in the presence of NADH, in 25 mM MOPS (pH 7.4; left panel) or in 25 mM CHES (pH 9.4; right panel). Traces are representatives of O2•−-specific 2-hydroxyethidium formation (SOD-insensitive contributions were subtracted; see Figure 4 for typical +SOD traces). (B) NADH oxidase activity was measured spectrophotometrically as the rate at which non-treated (active) or thermally deactivated (de-active) SMPs at 25 μg/mL oxidized NADH (200 μM), in 25 mM MOPS (pH 7.4; left panel) or in 25 mM CHES (pH 9.4; right panel). Traces are representatives of reduction in NADH absorbance at 340 nm. These traces are representative figures from five separate experiments.
Next we determined the effect of phenformin-mediated complex I inhibition on O2•− production in the active and de-active states. The deactivation of complex I in solubilized mitochondria lead to minimal effect on the basal capacity of NADH-supported O2•− production (Figure 4A) at pH 7.4, similar to our results in SMPs. This result supports that thermal deactivation does not impose irreversible damage to the ETC components to modulate O2•− production. We next examined the effect of phenformin on O2•− production in active and thermally deactivated solubilized mitochondria. Phenformin decreased O2•− production under basal condition by 4.9% and following thermal deactivation by 14.9%. This result was unexpected given that inhibition of complex I is known to increase complex I mediated free radical production. For example, rotenone (2.5 nM) increased the rate of O2•− production (Figure 4B), thus further demonstrating phenformin inhibits via a distinct mechanism. Furthermore, because the concentration of phenformin utilized (250 μM) had no effect on downstream electron transport activity, it suggests this decrease in O2•− production is largely because of its effect on complex I. A similar decrease in the rate of mitochondrial free radical production was observed in thermally deactivated mitochondria in the presence of Mg2+ (Figure 5A), suggesting reagents that impede reactivation of complex I may unexpectedly decrease O2•− production. To support our hydroethidine fluorescence data, EPR spin-trapping experiments utilizing a membrane permeable cyclic hydroxylamine, CMH, were performed. Similar results were obtained (Figure 5B) using this technique, demonstrating the observed changes in O2•− production were not fluorescent artifacts.
Figure 4.
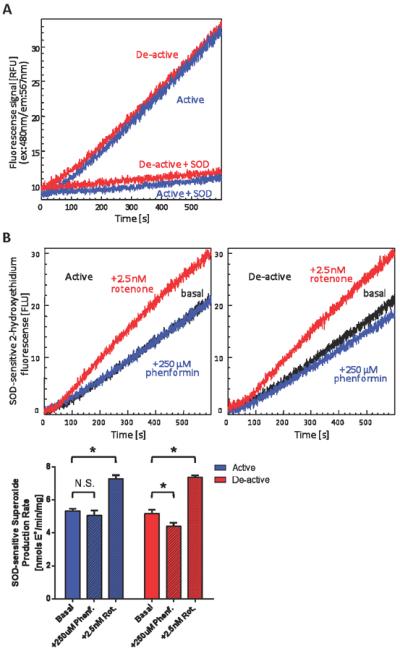
(A) Thermal deactivation has minimal effect on basal superoxide production at physiological pH. Superoxide production was measured fluorimetrically as the rate at which solubilized mitochondria oxidize hydroethidine in the presence of NADH in 25 mM MOPS (pH 7.4). Traces are representatives of 2-hydroxyethidium formation for non-treated (active) and thermally deactivated (de-active) mitochondria in the absence or presence of CuZn-SOD (8.0 units/mL). (B) The effect of phenformin-mediated complex I inhibition on superoxide production is distinct from that of rotenone-induced complex I inhibition. Traces were SOD-sensitive 2-hydroxyethidium formation monitored utilizing non-treated (active) or thermally deactivated (de-active) 25 μg/mL solubilized mitochondria in the absence or presence of 250 μM phenformin or 2.5 nM rotenone. SOD-sensitive rates are presented in the bar graph (lower panel). Values represent means ± S.D. (n = 5). Symbols (*) indicate statistical significance versus respective basal rates (p < 0.001) using a Student t-test.
Ischemia sensitizes cardiac mitochondria to phenformin mediated inhibition
Given the rapid reactivation of complex I, it is difficult to observe deactivated complex I in vivo. However, evidence supports that cardiac ischemia induces deactivation of complex I in vivo (39–41). We therefore employed a Langendorff perfusion model to determine whether ischemia sensitizes cardiac mitochondria to biguanide mediated complex I inhibition. As shown in Figure 6A and 6B, ischemia sensitized isolated mitochondria to both Mg2+- and phenformin-mediated inhibition. Similar to the results derived from in vitro thermal treatment, the ischemic effect on complex III and IV was minimal, and more importantly, ischemia did not sensitize complex III-IV to phenformin (Figure 6C).
Figure 6.
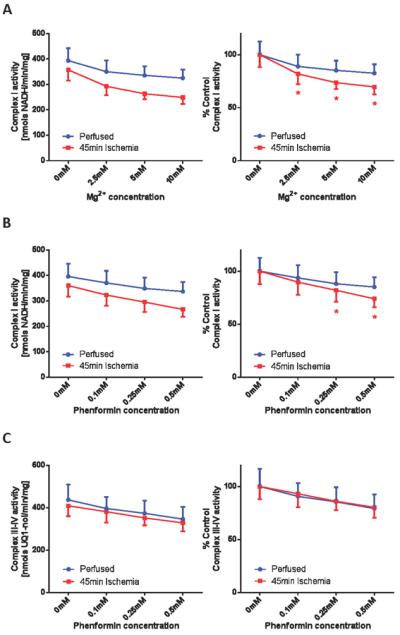
(A) Cardiac ischemia sensitizes complex I to magnesium. Mitochondria were isolated from perfused control hearts and hearts underwent 45 min of ischemic period as described in the `Materials and Methods' section. Complex I activities were measured spectrophotometrically as the rate at which solubilized mitochondria at 25 μg/mL oxidized NADH (200 μM) in the presence of 50 nM antimycin A and 100 μM ubiquinone, in the absence or presence of indicated concentrations of Mg2+. (B) Cardiac ischemia sensitizes complex I to phenformin. Similarly, complex I activities were measured in the absence or presence of indicated concentration of phenformin. (C) Cardiac ischemia does not affect complex III-IV sensitivity to phenformin. Complex III-IV activities were measured spectrophotometrically as the rate at which solubilized mitochondria at 5 μg/mL oxidized 100 μM ubiquinol in the absence or presence of indicated concentrations of phenformin. Values are expressed as raw (left panels) and as percentages of the untreated basal rates (right panels). Values represent means ± S.E.M. (n = 5). Symbols (*) indicate statistical significance (p < 0.05) using a Student t-test.
Next we examined the magnitude of ischemia-induced complex I deactivation by in vitro thermal deactivation. Solubilized mitochondria isolated from perfused hearts or hearts that underwent 45-min of ischemia were heated to induce complete deactivation. Following this thermal treatment, the differential complex I sensitivity to Mg2+ or phenformin between perfused and ischemic samples was diminished. For example, 10 mM of Mg2+ inhibited basal complex I in perfused hearts by 17.1 ± 4.6% before thermal deactivation and 59.3 ± 3.7% after. In contrast, 10 mM of Mg2+ inhibited complex I from ischemic hearts by 30.2 ± 2.7% before thermal deactivation and 64.2 ± 1.4% after. These data support that in vivo deactivation is occurring under the ischemic state and that this causes an increased sensitivity to biguanide mediated inhibition. Thus, conditions that promote deactivation of complex I under physiological conditions may enhance biguanide mediated inhibition.
DISCUSSION
It has been previously shown that in intact mitochondria complex I is a major target site of biguanides (6–10). The present report demonstrates that biguanides selectively inhibit the deactivated form of complex I. Recently, Hirst and colleagues reported that biguanides inhibit ubiquinone reduction in a non-competitive manner (7). The same report further suggested the deactivation of complex I may enhance biguanides' binding to complex I (7), which is conceivable since the ubiquinone binding site may undergo conformational change (42) by complex I deactivation. NADH dehydrogenase activity, assessed as NADH:ferricyanide oxidoreductase activity, was found unchanged after thermal deactivation and by sub-millimolar concentrations of phenformin (not shown). It is therefore postulated that this selective inactivation of deactivated complex I stems from modification of the ubiquinone binding site. The exact binding site for biguanides and the mechanism of interaction remain to be elucidated. More recently, the direct interaction of biguanides to isolated complex I or functionally-isolated complex I has been questioned. It has been suggested that the energized state and/or the interaction of biguanides with ATP synthase are important for biguanide-mediated inhibition (43). Our results presented in this report, however, indicate the deactivation greatly enhances sensitivity of complex I toward biguanides leading to observable inhibition of complex I activity at lower than previously reported concentrations. One of the deactivation requirements for complex I is the absence of electron transfer activity within the enzyme. Therefore, the current study demonstrates the direct inhibition of complex I by biguanides does not require an energized state. Additionally, the early studies on the temperature-dependent biguanide sensitization in intact mitochondria, where incubation at 37°C drastically increase biguanide-induced inhibition in respiration (9), can be explained in part by the deactivation of complex I.
Our results demonstrate that complex I “locked” into the deactivated state by Mg2+ or biguanides decreases the capacity of ETC-mediated superoxide (O2•−) production. The properties of this locked de-active state have not been well characterized. It is partly because most of the known reactivation-impeding agents (NEM and divalent cations) affect downstream ETC components non-specifically and thus modulation in O2•− production by the locked de-active state is difficult to assess. Specific inhibition of complex I by phenformin, therefore, is a valuable tool to evaluate mechanisms of O2•− production upstream of the ubiquinone binding site. It should be noted though that millimolar concentrations of phenformin, where downstream inhibition becomes evident, increased the observed O2•− production especially in the active state (not shown). This may explain in part the previous observations that biguanide-treated cells or intact mitochondria stimulates the production of ROS (O2•− or H2O2) (44–46). What we present here is a direct mechanism of modulation in O2•− production excluding secondary contributions of overall oxidative stress in vivo.
In intact mitochondria, it has been widely reported that a major mechanism of O2•− production from the mitochondrial ETC is by reverse electron transfer (RET). This is the complex II mediated reduction of NAD+ that can occur in the presence of a high membrane potential (17, 47). It can be speculated that at less than complete inhibition of complex I, the large RET-mediated increases in O2•−/H2O2 production likely overwhelm the ~15% suppression in NADH-supported O2•− production that we report here (Figure 4B) resulting in increased overall ROS production. However, consistent with our results, there is evidence that metformin decreases RET mediated complex I ROS production in intact mitochondria (48).
Phenformin and buformin carry an elevated risk of lactic acidosis. However, the physiological accumulation of these biguanides in mitochondria may facilitate their anti-neoplastic use. Since biguanides are positively charged, they are expected to accumulate in response to the mitochondrial energetic status. Specifically, lower respiratory activity and increased membrane potential induced by respiratory inhibitors may help increase accumulation of biguanides into the mitochondrial matrix. It has been considered that the organic cation transporter 1 (OCT1) is the main plasma- membrane biguanide transporter (49–51). In case of phenformin, it has been determined that it could be accumulated to roughly 200 μM (7) in the mitochondrial matrix in vivo, which is sufficient to induce ~10% and ~35–40% decrease in complex I activity on active and de-active states in our study, respectively.
A low glucose environment has recently been shown to increase the potency of phenformin and other biguanides in cancer cell lines (52). The synergistic effect of biguanides with agents that modulate glucose metabolism, such as oxamate (53) and dichloroacetate (45, 46), have been also reported. As presented in Figure 6, ischemia represents a condition that promote deactivation of complex I in vivo, thereby increasing the sensitivity to biguanide mediated inhibition. The increased sensitivity of complex I to biguanide mediated inhibition may contribute to the observation that metformin improves cardiac function in a long-term post-myocardial infarction model (54). Furthermore, it can be hypothesized that local hypoxic or ischemic environments found in certain cancers may thus represent a mechanism of increased biguanide activity. It will therefore be important to identify the physiological conditions that favor deactivation of complex I in vivo.
ABREVIATIONS
- CMH
1-hydroxy-3-methoxycarbonyl-2,2,5,5-tetramethylpyrrolidine
- CHES
N-cyclohexyl-2-aminoethanesulfonic acid
- DTPA
diethylenetriamine pentaacetic acid
- EDTA
ethylenediamine tetraacetic acid
- EPR
electron paramagnetic resonance
- ETC
electron transport chain
- HE
hydroethidine
- MOPS
3-(N-morpholino)propanesulfonic acid
- NADH
nicotinamide adenine dinucleotide (reduced)
- SOD
superoxide dismutase
- SMP
submitochondrial particle
Footnotes
Research reported in this study was supported by an Institutional Development Award (IDeA) from the National Institute of General Medical Sciences of the National Institutes of Health under grant number P20GM104934.
REFERENCES
- 1.Bosi E. Metformin--the gold standard in type 2 diabetes: what does the evidence tell us? Diabetes Obes Metab. 2009;11(Suppl 2):3–8. doi: 10.1111/j.1463-1326.2008.01031.x. [DOI] [PubMed] [Google Scholar]
- 2.Luengo A, Sullivan LB, Heiden MG. Understanding the complex-I-ty of metformin action: limiting mitochondrial respiration to improve cancer therapy. BMC Biol. 2014;12:82. doi: 10.1186/s12915-014-0082-4. [DOI] [PMC free article] [PubMed] [Google Scholar]
- 3.Orecchioni S, Reggiani F, Talarico G, Mancuso P, Calleri A, Gregato G, Labanca V, Noonan DM, Dallaglio K, Albini A, Bertolini F. The biguanides metformin and phenformin inhibit angiogenesis, local and metastatic growth of breast cancer by targeting both neoplastic and microenvironment cells. Int J Cancer. 2015;136:E534–544. doi: 10.1002/ijc.29193. [DOI] [PubMed] [Google Scholar]
- 4.Pernicova I, Korbonits M. Metformin--mode of action and clinical implications for diabetes and cancer. Nat Rev Endocrinol. 2014;10:143–156. doi: 10.1038/nrendo.2013.256. [DOI] [PubMed] [Google Scholar]
- 5.Pollak MN. Investigating metformin for cancer prevention and treatment: the end of the beginning. Cancer Discov. 2012;2:778–790. doi: 10.1158/2159-8290.CD-12-0263. [DOI] [PubMed] [Google Scholar]
- 6.Andrzejewski S, Gravel SP, Pollak M, St-Pierre J. Metformin directly acts on mitochondria to alter cellular bioenergetics. Cancer Metab. 2014;2:12. doi: 10.1186/2049-3002-2-12. [DOI] [PMC free article] [PubMed] [Google Scholar]
- 7.Bridges HR, Jones AJ, Pollak MN, Hirst J. Effects of metformin and other biguanides on oxidative phosphorylation in mitochondria. Biochem J. 2014;462:475–487. doi: 10.1042/BJ20140620. [DOI] [PMC free article] [PubMed] [Google Scholar]
- 8.Drahota Z, Palenickova E, Endlicher R, Milerova M, Brejchova J, Vosahlikova M, Svoboda P, Kazdova L, Kalous M, Cervinkova Z, Cahova M. Biguanides inhibit complex I, II and IV of rat liver mitochondria and modify their functional properties. Physiol Res. 2014;63:1–11. doi: 10.33549/physiolres.932600. [DOI] [PubMed] [Google Scholar]
- 9.El-Mir MY, Nogueira V, Fontaine E, Averet N, Rigoulet M, Leverve X. Dimethylbiguanide inhibits cell respiration via an indirect effect targeted on the respiratory chain complex I. J Biol Chem. 2000;275:223–228. doi: 10.1074/jbc.275.1.223. [DOI] [PubMed] [Google Scholar]
- 10.Owen MR, Doran E, Halestrap AP. Evidence that metformin exerts its anti-diabetic effects through inhibition of complex 1 of the mitochondrial respiratory chain. Biochem J. 2000;348(Pt 3):607–614. [PMC free article] [PubMed] [Google Scholar]
- 11.Miller RA, Birnbaum MJ. An energetic tale of AMPK-independent effects of metformin. J Clin Invest. 2010;120:2267–2270. doi: 10.1172/JCI43661. [DOI] [PMC free article] [PubMed] [Google Scholar]
- 12.Turner N, Li JY, Gosby A, To SW, Cheng Z, Miyoshi H, Taketo MM, Cooney GJ, Kraegen EW, James DE, Hu LH, Li J, Ye JM. Berberine and its more biologically available derivative, dihydroberberine, inhibit mitochondrial respiratory complex I: a mechanism for the action of berberine to activate AMP-activated protein kinase and improve insulin action. Diabetes. 2008;57:1414–1418. doi: 10.2337/db07-1552. [DOI] [PubMed] [Google Scholar]
- 13.Carvalho C, Correia S, Santos MS, Seica R, Oliveira CR, Moreira PI. Metformin promotes isolated rat liver mitochondria impairment. Mol Cell Biochem. 2008;308:75–83. doi: 10.1007/s11010-007-9614-3. [DOI] [PubMed] [Google Scholar]
- 14.Foretz M, Hebrard S, Leclerc J, Zarrinpashneh E, Soty M, Mithieux G, Sakamoto K, Andreelli F, Viollet B. Metformin inhibits hepatic gluconeogenesis in mice independently of the LKB1/AMPK pathway via a decrease in hepatic energy state. J Clin Invest. 2010;120:2355–2369. doi: 10.1172/JCI40671. [DOI] [PMC free article] [PubMed] [Google Scholar]
- 15.Hawley SA, Gadalla AE, Olsen GS, Hardie DG. The antidiabetic drug metformin activates the AMP-activated protein kinase cascade via an adenine nucleotide-independent mechanism. Diabetes. 2002;51:2420–2425. doi: 10.2337/diabetes.51.8.2420. [DOI] [PubMed] [Google Scholar]
- 16.Dykens JA, Jamieson J, Marroquin L, Nadanaciva S, Billis PA, Will Y. Biguanide-induced mitochondrial dysfunction yields increased lactate production and cytotoxicity of aerobically-poised HepG2 cells and human hepatocytes in vitro. Toxicol Appl Pharmacol. 2008;233:203–210. doi: 10.1016/j.taap.2008.08.013. [DOI] [PubMed] [Google Scholar]
- 17.Murphy MP. How mitochondria produce reactive oxygen species. Biochem J. 2009;417:1–13. doi: 10.1042/BJ20081386. [DOI] [PMC free article] [PubMed] [Google Scholar]
- 18.Gostimskaya IS, Cecchini G, Vinogradov AD. Topography and chemical reactivity of the active-inactive transition-sensitive SH-group in the mitochondrial NADH:ubiquinone oxidoreductase (Complex I) Biochim Biophys Acta. 2006;1757:1155–1161. doi: 10.1016/j.bbabio.2006.04.016. [DOI] [PMC free article] [PubMed] [Google Scholar]
- 19.Grivennikova VG, Kapustin AN, Vinogradov AD. Catalytic activity of NADH-ubiquinone oxidoreductase (complex I) in intact mitochondria. evidence for the slow active/inactive transition. J Biol Chem. 2001;276:9038–9044. doi: 10.1074/jbc.M009661200. [DOI] [PubMed] [Google Scholar]
- 20.Grivennikova VG, Serebryanaya DV, Isakova EP, Belozerskaya TA, Vinogradov AD. The transition between active and de-activated forms of NADH:ubiquinone oxidoreductase (Complex I) in the mitochondrial membrane of Neurospora crassa. Biochem J. 2003;369:619–626. doi: 10.1042/BJ20021165. [DOI] [PMC free article] [PubMed] [Google Scholar]
- 21.Vinogradov AD. Catalytic properties of the mitochondrial NADH-ubiquinone oxidoreductase (complex I) and the pseudo-reversible active/inactive enzyme transition. Biochim Biophys Acta. 1998;1364:169–185. doi: 10.1016/s0005-2728(98)00026-7. [DOI] [PubMed] [Google Scholar]
- 22.Kotlyar AB, Vinogradov AD. Slow active/inactive transition of the mitochondrial NADH-ubiquinone reductase. Biochim Biophys Acta. 1990;1019:151–158. doi: 10.1016/0005-2728(90)90137-s. [DOI] [PubMed] [Google Scholar]
- 23.Vinogradov AD, Grivennikova VG. The mitochondrial complex I: progress in understanding of catalytic properties. IUBMB Life. 2001;52:129–134. doi: 10.1080/15216540152845920. [DOI] [PubMed] [Google Scholar]
- 24.Gostimskaya IS, Grivennikova VG, Cecchini G, Vinogradov AD. Reversible dissociation of flavin mononucleotide from the mammalian membrane-bound NADH: ubiquinone oxidoreductase (complex I) FEBS Lett. 2007;581:5803–5806. doi: 10.1016/j.febslet.2007.11.048. [DOI] [PMC free article] [PubMed] [Google Scholar]
- 25.Kotlyar AB, Sled VD, Vinogradov AD. Effect of Ca2+ ions on the slow active/inactive transition of the mitochondrial NADH-ubiquinone reductase. Biochim Biophys Acta. 1992;1098:144–150. doi: 10.1016/s0005-2728(05)80329-9. [DOI] [PubMed] [Google Scholar]
- 26.Galkin A, Meyer B, Wittig I, Karas M, Schagger H, Vinogradov A, Brandt U. Identification of the mitochondrial ND3 subunit as a structural component involved in the active/deactive enzyme transition of respiratory complex I. J Biol Chem. 2008;283:20907–20913. doi: 10.1074/jbc.M803190200. [DOI] [PMC free article] [PubMed] [Google Scholar]
- 27.Hurd TR, Requejo R, Filipovska A, Brown S, Prime TA, Robinson AJ, Fearnley IM, Murphy MP. Complex I within oxidatively stressed bovine heart mitochondria is glutathionylated on Cys-531 and Cys-704 of the 75-kDa subunit: potential role of CYS residues in decreasing oxidative damage. J Biol Chem. 2008;283:24801–24815. doi: 10.1074/jbc.M803432200. [DOI] [PMC free article] [PubMed] [Google Scholar]
- 28.Requejo R, Hurd TR, Costa NJ, Murphy MP. Cysteine residues exposed on protein surfaces are the dominant intramitochondrial thiol and may protect against oxidative damage. FEBS J. 2010;277:1465–1480. doi: 10.1111/j.1742-4658.2010.07576.x. [DOI] [PMC free article] [PubMed] [Google Scholar]
- 29.Taylor ER, Hurrell F, Shannon RJ, Lin TK, Hirst J, Murphy MP. Reversible glutathionylation of complex I increases mitochondrial superoxide formation. J Biol Chem. 2003;278:19603–19610. doi: 10.1074/jbc.M209359200. [DOI] [PubMed] [Google Scholar]
- 30.Chouchani ET, Hurd TR, Nadtochiy SM, Brookes PS, Fearnley IM, Lilley KS, Smith RA, Murphy MP. Identification of S-nitrosated mitochondrial proteins by S-nitrosothiol difference in gel electrophoresis (SNO-DIGE): implications for the regulation of mitochondrial function by reversible S-nitrosation. Biochem J. 2010;430:49–59. doi: 10.1042/BJ20100633. [DOI] [PMC free article] [PubMed] [Google Scholar]
- 31.Galkin A, Moncada S. S-nitrosation of mitochondrial complex I depends on its structural conformation. J Biol Chem. 2007;282:37448–37453. doi: 10.1074/jbc.M707543200. [DOI] [PubMed] [Google Scholar]
- 32.Prime TA, Blaikie FH, Evans C, Nadtochiy SM, James AM, Dahm CC, Vitturi DA, Patel RP, Hiley CR, Abakumova I, Requejo R, Chouchani ET, Hurd TR, Garvey JF, Taylor CT, Brookes PS, Smith RA, Murphy MP. A mitochondria-targeted S-nitrosothiol modulates respiration, nitrosates thiols, and protects against ischemia-reperfusion injury. Proc Natl Acad Sci U S A. 2009;106:10764–10769. doi: 10.1073/pnas.0903250106. [DOI] [PMC free article] [PubMed] [Google Scholar]
- 33.Matsuzaki S, Szweda LI, Humphries KM. Mitochondrial superoxide production and respiratory activity: biphasic response to ischemic duration. Arch Biochem Biophys. 2009;484:87–93. doi: 10.1016/j.abb.2009.01.006. [DOI] [PMC free article] [PubMed] [Google Scholar]
- 34.Grivennikova VG, Maklashina EO, Gavrikova EV, Vinogradov AD. Interaction of the mitochondrial NADH-ubiquinone reductase with rotenone as related to the enzyme active/inactive transition. Biochim Biophys Acta. 1997;1319:223–232. doi: 10.1016/s0005-2728(96)00163-6. [DOI] [PubMed] [Google Scholar]
- 35.Vadvalkar SS, Baily CN, Matsuzaki S, West M, Tesiram YA, Humphries KM. Metabolic inflexibility and protein lysine acetylation in heart mitochondria of a chronic model of type 1 diabetes. Biochem J. 2013;449:253–261. doi: 10.1042/BJ20121038. [DOI] [PMC free article] [PubMed] [Google Scholar]
- 36.Zhao H, Joseph J, Fales HM, Sokoloski EA, Levine RL, Vasquez-Vivar J, Kalyanaraman B. Detection and characterization of the product of hydroethidine and intracellular superoxide by HPLC and limitations of fluorescence. Proc Natl Acad Sci U S A. 2005;102:5727–5732. doi: 10.1073/pnas.0501719102. [DOI] [PMC free article] [PubMed] [Google Scholar]
- 37.Zhao H, Kalivendi S, Zhang H, Joseph J, Nithipatikom K, Vasquez-Vivar J, Kalyanaraman B. Superoxide reacts with hydroethidine but forms a fluorescent product that is distinctly different from ethidium: potential implications in intracellular fluorescence detection of superoxide. Free Radic Biol Med. 2003;34:1359–1368. doi: 10.1016/s0891-5849(03)00142-4. [DOI] [PubMed] [Google Scholar]
- 38.Degli Esposti M. Inhibitors of NADH-ubiquinone reductase: an overview. Biochim Biophys Acta. 1998;1364:222–235. doi: 10.1016/s0005-2728(98)00029-2. [DOI] [PubMed] [Google Scholar]
- 39.Galkin A, Abramov AY, Frakich N, Duchen MR, Moncada S. Lack of oxygen deactivates mitochondrial complex I: implications for ischemic injury? J Biol Chem. 2009;284:36055–36061. doi: 10.1074/jbc.M109.054346. [DOI] [PMC free article] [PubMed] [Google Scholar]
- 40.Maklashina E, Kotlyar AB, Karliner JS, Cecchini G. Effect of oxygen on activation state of complex I and lack of oxaloacetate inhibition of complex II in Langendorff perfused rat heart. FEBS Lett. 2004;556:64–68. doi: 10.1016/s0014-5793(03)01369-3. [DOI] [PubMed] [Google Scholar]
- 41.Maklashina E, Sher Y, Zhou HZ, Gray MO, Karliner JS, Cecchini G. Effect of anoxia/reperfusion on the reversible active/de-active transition of NADH-ubiquinone oxidoreductase (complex I) in rat heart. Biochim Biophys Acta. 2002;1556:6–12. doi: 10.1016/s0005-2728(02)00280-3. [DOI] [PubMed] [Google Scholar]
- 42.Hirst J. Mitochondrial complex I. Annu Rev Biochem. 2013;82:551–575. doi: 10.1146/annurev-biochem-070511-103700. [DOI] [PubMed] [Google Scholar]
- 43.Fontaine E. Metformin and respiratory chain complex I: the last piece of the puzzle? Biochem J. 2014;463:e3–5. doi: 10.1042/BJ20141020. [DOI] [PubMed] [Google Scholar]
- 44.Anedda A, Rial E, Gonzalez-Barroso MM. Metformin induces oxidative stress in white adipocytes and raises uncoupling protein 2 levels. J Endocrinol. 2008;199:33–40. doi: 10.1677/JOE-08-0278. [DOI] [PubMed] [Google Scholar]
- 45.Choi YW, Lim IK. Sensitization of metformin-cytotoxicity by dichloroacetate via reprogramming glucose metabolism in cancer cells. Cancer Lett. 2014;346:300–308. doi: 10.1016/j.canlet.2014.01.015. [DOI] [PubMed] [Google Scholar]
- 46.Haugrud AB, Zhuang Y, Coppock JD, Miskimins WK. Dichloroacetate enhances apoptotic cell death via oxidative damage and attenuates lactate production in metformin-treated breast cancer cells. Breast Cancer Res Treat. 2014;147:539–550. doi: 10.1007/s10549-014-3128-y. [DOI] [PMC free article] [PubMed] [Google Scholar]
- 47.Adam-Vizi V, Chinopoulos C. Bioenergetics and the formation of mitochondrial reactive oxygen species. Trends Pharmacol Sci. 2006;27:639–645. doi: 10.1016/j.tips.2006.10.005. [DOI] [PubMed] [Google Scholar]
- 48.Batandier C, Guigas B, Detaille D, El-Mir MY, Fontaine E, Rigoulet M, Leverve XM. The ROS production induced by a reverse-electron flux at respiratory-chain complex 1 is hampered by metformin. J Bioenerg Biomembr. 2006;38:33–42. doi: 10.1007/s10863-006-9003-8. [DOI] [PubMed] [Google Scholar]
- 49.Segal ED, Yasmeen A, Beauchamp MC, Rosenblatt J, Pollak M, Gotlieb WH. Relevance of the OCT1 transporter to the antineoplastic effect of biguanides. Biochem Biophys Res Commun. 2011;414:694–699. doi: 10.1016/j.bbrc.2011.09.134. [DOI] [PubMed] [Google Scholar]
- 50.Shitara Y, Nakamichi N, Norioka M, Shima H, Kato Y, Horie T. Role of organic cation/carnitine transporter 1 in uptake of phenformin and inhibitory effect on complex I respiration in mitochondria. Toxicol Sci. 2013;132:32–42. doi: 10.1093/toxsci/kfs330. [DOI] [PubMed] [Google Scholar]
- 51.Wang DS, Kusuhara H, Kato Y, Jonker JW, Schinkel AH, Sugiyama Y. Involvement of organic cation transporter 1 in the lactic acidosis caused by metformin. Mol Pharmacol. 2003;63:844–848. doi: 10.1124/mol.63.4.844. [DOI] [PubMed] [Google Scholar]
- 52.Birsoy K, Possemato R, Lorbeer FK, Bayraktar EC, Thiru P, Yucel B, Wang T, Chen WW, Clish CB, Sabatini DM. Metabolic determinants of cancer cell sensitivity to glucose limitation and biguanides. Nature. 2014;508:108–112. doi: 10.1038/nature13110. [DOI] [PMC free article] [PubMed] [Google Scholar]
- 53.Miskimins WK, Ahn HJ, Kim JY, Ryu S, Jung YS, Choi JY. Synergistic anti-cancer effect of phenformin and oxamate. PLoS One. 2014;9:e85576. doi: 10.1371/journal.pone.0085576. [DOI] [PMC free article] [PubMed] [Google Scholar]
- 54.Yin M, van der Horst IC, van Melle JP, Qian C, van Gilst WH, Sillje HH, de Boer RA. Metformin improves cardiac function in a nondiabetic rat model of post-MI heart failure. Am J Physiol Heart Circ Physiol. 2011;301:H459–468. doi: 10.1152/ajpheart.00054.2011. [DOI] [PubMed] [Google Scholar]
- 55.Dikalov SI, Kirilyuk IA, Voinov M, Grigor'ev IA. EPR detection of cellular and mitochondrial superoxide using cyclic hydroxylamines. Free Radic Res. 2011;45:417–430. doi: 10.3109/10715762.2010.540242. [DOI] [PMC free article] [PubMed] [Google Scholar]