

Abstract
Glass microfluidic devices have been fabricated to monitor the secretion of glycerol or fatty acids from cultured murine 3T3-L1 adipocytes. In the current studies, adipocytes are perfused in a reversibly-sealed cell chamber and secreted products are analyzed by enzyme assay on either a single- or dual-chip device. The analysis of glycerol employed the use of a dual-chip system, which used separate chips for cell perfusion and sample analysis. An improved single-chip device integrated the cell perfusion chamber and analysis component on one platform. The performance of this device was demonstrated by the analysis of fatty acids, but could also be applied to analysis of glycerol or other chemicals. The single-chip system required fewer cells and lower flow rates, and provided improved temporal response. In both systems, cells were perfused with buffer to monitor basal response followed by lipolysis stimulation with the β-adrenergic agonist isoproterenol. Measured basal glycerol concentration from 50,000 cells was 28 μM, and when stimulated, a spike 3-fold higher than basal concentration was detected followed by a continuous release 40% above basal levels. Fatty acid basal concentration was 24 μM, measured from 6,200 cells, and isoproterenol stimulation resulted in a constant elevated concentration 7-fold higher than basal levels.
Keywords: 3T3-L1 Adipocytes, Lipolysis, Fluorescence Spectroscopy, Microfluidics, Integration, Glycerol, Fatty Acids, Continuous-Perfusion Enzyme Assay
1. INTRODUCTION
Since the discovery that adipose tissue functions as endocrine tissue that releases hormones to regulate energy metabolism, research delving into its function and interactions with other tissues and organs has become increasingly important. Gaining a deeper understanding of adipose tissue physiology has become more crucial with the growing population of individuals with obesity-related disorders like type 2 diabetes (Rosen & Spiegelman, 2006). The production and secretion of hormones and other chemicals by adipocytes in response to circulation chemicals can be indication of such disorders (Duncan et al., 2007). Lipolysis products, non-esterified fatty acids (NEFA) and glycerol, are examples of chemicals secreted from adipocytes that play an important role in physiological homeostasis. Fatty acids provide necessary energy to surrounding tissues, but when circulating at elevated levels, as observed in individuals with increased adiposity, they can lead to insulin resistance or cardiovascular disease (Samuel & Shulman, 2012; Wyne, 2003). To understand these processes, it is important to have a reliable, accurate method of measuring lipolysis products secreted by adipocytes under different conditions.
The conventional method for monitoring chemical uptake or secretion by adipocytes generally involves using large numbers of cells and off-line assay analysis (Millward et al., 2010). Microfluidics is an alternative analysis technique that has gained popularity for cell biology applications because of its ability to allow monitoring of cellular dynamics in near real-time. Additionally, microfluidics can offer a cellular environment that more closely reflects the in vivo type of conditions, media can be replenished or recirculated, and shear stress can be controlled (El-Ali et al., 2006). Furthermore, it is possible to integrate and automate chemical analysis on the chip by using microfabrication. Cell culture, analysis, and detection can all be performed on the same platform. Many groups have demonstrated the versatility and scope of microfluidic cell biology applications: mimicking lung cell expansion and function (Huh et al., 2010), encapsulating multiple cell lines in hydrogel microbeads to monitor cell-cell interactions (Tumarkin et al., 2011), differentiating adipocytes on-chip using a gradient flow (Lai et al., 2012), and monitoring secretion (Roper et al., 2003).
Depending on the desired application, a variety of microfluidic substrates can be utilized. Devices made from plastics like polydimethylsiloxane (PDMS) or polymethylmethacrylate (PMMA) are frequently used because of their low cost and ease of fabrication. The exposed surfaces of these plastic devices are generally hydrophobic and can absorb or become fouled by certain biomolecules or organic chemicals (van Midwoud et al., 2012). Surface modifications can be performed to change the chemistry of the channel walls. Alternatively, glass microfluidics can be used. Glass offers a greater range of chemical compatibility (for use with fatty acids and enzymes) and is used in the studies described herein.
Cellular secretions can be monitored on-line in a variety of ways with microfluidics. For example, glucagon and insulin secretion from islets have been measured by immunoassay (Dishinger et al., 2009; Shackman et al., 2012), ATP release from red blood cells was measured by a bioluminescent assay (Wan et al., 2008), and nitric oxide secretion from macrophages by enzyme assay (Goto et al., 2005). In all these studies, the cells are incubated on the chip and constantly perfused. The perfusate flows into a channel wherein reactants are added. The resulting mixture flows through a reactant channel where the products are detected. The concentration of fatty acids and glycerol secreted by adipocytes are typically monitored off-line by reaction with commercially available enzyme assays, however in a microfluidic device this reaction can be automatically and continuously performed on-line. This also has the advantages of lower reagent consumption and increased automation. Commonly used colorimetric enzyme assays can often be adapted to be measured by fluorescence detection by the addition of the hydrogen peroxide-sensitive dye Amplex UltraRed, to allow for a more sensitive response.
In the present studies, cultured 3T3-L1 adipocytes are loaded onto a reversibly-sealed microfluidic cell chamber and alternately perfused with buffer, to measure basal secretion, and isoproterenol, a β-adrenergic agonist that stimulates lipolysis. The perfusate immediately enters micrometer-scale channels where it mixes with the necessary enzyme assay reagents. The fluorescence signal is detected at the outlet using laser-induced fluorescence. The resulting data provides information on adipocyte lipolysis rates under different conditions and can be extended to other studies on adipocyte function.
2. METHODS
2.1 Required reagents
Free glycerol reagent, glycerol standard solution, Hanks’ balanced salt solution (HBSS, Cat. # H6648), dimethyl sulfoxide (DMSO), isoproterenol hydrochloride and fatty acid-free bovine serum albumin (BSA) were purchased from Sigma-Aldrich (St. Louis, MO). Free glycerol reagent was reconstituted using 18.0 MΩ/cm distilled water. All other solutions were prepared with HBSS.
NEFA-HR(2) kit was obtained from Wako Diagnostics (Richmond, VA). Color reagent A (CR-A) was reconstituted with solvent A, and color reagent B (CR-B) was reconstituted with 25 mL of 18.0 MΩ/cm water.
Hydrofluoric acid, sulfuric acid, 30% hydrogen peroxide and ammonium hydroxide were purchased from Fisher Scientific (Pittsburgh, PA).
Amplex UltraRed reagent and cell culture reagents were obtained from Life Technologies (Carlsbad, CA). Amplex UltraRed was reconstituted with 340 μL DMSO to make a 10 mM stock solution.
2.2 Adipocyte Culture
Glass coverslips (No. 1, Fisher Scientific, Pittsburgh, PA) were cut to desired size using a diamond-tipped scorer and soaked in ethanol for at least an hour. For experiments performed with the following microfluidic devices, coverslips were cut to either 2.4 × 40 mm2 or 2 × 12.5 mm2. The coverslips were transferred to a new petri dish where they were allowed to dry. Three or four sterile coverslips were placed in a 10 cm petri dish before seeding adipocytes.
Murine 3T3-L1 preadipocytes were seeded into petri dishes, supplemented with media (DMEM with 10% calf serum), and incubated at 37 °C and 10% CO2 until confluent. Differentiation was induced 2 days post-confluence with a media consisting of fetal bovine serum, insulin, dexamethasone, and isobutylmethylxanthine. Every 2 days after differentiation the media was changed using a DMEM solution (high glucose and L-glutamine) containing 10% fetal bovine serum, 1% sodium pyruvate, and 1% Penicillin-Streptomycin.
When a cellular secretion experiment was being performed, sterile tweezers were used to pick up and transfer the coverslip to the microfluidic chip.
2.3 Glass chip fabrication
Borofloat glass slides (2.54 × 7.62 × 0.1 cm3, Telic, Valencia, CA) with a 120 nm chrome layer were coated with 530 nm of AZ-1518 photoresist. A photomask (Fineline Imaging, Colorado Springs, CO) with the appropriate design (created on AutoCAD) was aligned over the glass and was exposed to a collimated UV light for 9 seconds at 26 mW cm−2. The exposed photoresist was removed with AZ 726 MIF developer (AZ Electronic Materials, Branchburg, NJ) and the chrome was removed using CEP-200 chrome etchant (HTA Enterprises, San Jose, CA). AZ photoresist is a positive photoresist, meaning the dark patterns on the photomask are the areas that remain covered in photoresist after exposure and developing.
Dicing tape was used to cover certain areas of the glass that require less exposure to the etching solution. This was applied to the back side of the slide and in areas where there were shallow features.
The glass was etched using a 48:17:55 (v/v/v) HF:HNO3:H2O solution, with the etch time dependent on the channel depth desired (with this solution the etch rate is 1.2 μm/min).
After etching, the remaining photoresist was stripped with acetone and the remaining chrome was removed in the CEP-200 etchant. Fluidic access holes were drilled using a diamond-tipped drill bit.
- For chips with irreversibly bonded glass components, the following procedure was followed.
- The glass slides were cleaned in a piranha solution for 20 minutes. After rinsing, they were further cleaned by a RCA solution at 60 °C for 40 minutes (refer to Note 3 below for mixture specifications).
- After rinsing in water, and while still wet, the 2 slides to be bonded were put in conformal contact and sealed using a 610 °C furnace for 8 hours under 400 grams weight.
- Reservoirs (Upchurch N-124H, IDEX Health & Science, Oak Harbor, WA) were adhered around the access holes using the supplied epoxy ring. A binder clip was used to clamp the reservoir to the chip, and the complete device was placed in the oven, per manufacturer’s instructions.
2.4 Cell Perfusion & Enzyme Assay
2.4.1 Glycerol Assay Chip
For the analysis of glycerol secretion from adipocytes, a dual-chip system was used (Clark et al., 2009). The cell chamber and enzyme assay mixing chip were on separate devices connected by fused silica capillary.
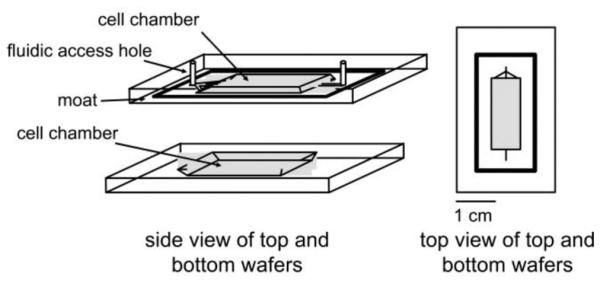
The first chip housed the reversibly sealable cell chamber chip with dimensions of 4 cm × 0.5 cm. Two glass slides were etched to make the top and bottom cell chambers as shown in Figure 1. The bottom cell chamber was etched 450 μm deep and the top cell chamber was etched 100 μm deep. The top cell chamber also contained etched fluidic access channels and a moat (both 5 μm deep) surrounding the rectangular chamber.
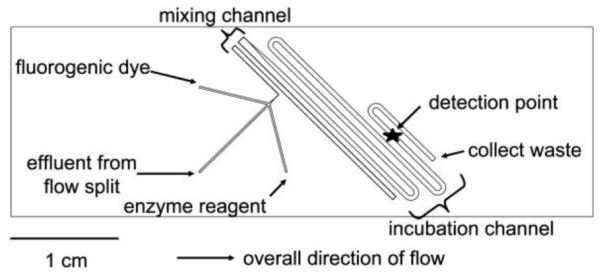
The second chip contained the mixing channels where the enzyme assay can react with the cell perfusate. The channels, shown in Figure 2, were etched into a glass slide and then bonded to a blank glass slide to create an irreversibly sealed channel network. The channels are different widths along the fluid network, but all of the channels were etched to 60 μm deep. After the introduction of the reagents and cell perfusate, the channels are 100 μm wide to facilitate liquid mixing (see Note 2). The channels then extend into 600 μm wide channels so the reagents can incubate for longer times before detection.
The 2.4 × 40 mm2 coverslip with adhered adipocytes were loaded into the lower cell chamber and additional culture medium was added to fill the chamber. High-vacuum grease was carefully applied to both pieces of glass of the cell chamber chip around the chamber using a scalpel blade. A 125 μm thick sheet of poly (tetrafluoroethylene) (PTFE), with a hole cut out the size of the cell chamber, was placed on the vacuum grease of the lower cell chamber around the cells and pressed to seal. The top cell chamber glass was aligned over the lower chamber and pressed on to seal.
An in-house built compression frame, made from 2 sheets of acrylic plastic with symmetrical holes drilled through both sheets, was tightened around the chip using screws.
A thin-film resistive heater maintained at 37 °C was placed under the compression frame to keep the cells at a physiological temperature.
HBSS buffer or 20 μM isoproterenol in HBSS was perfused at 80 μL/min, using pressure-driven flow, through the cell chamber. The perfusate that exited the cell chamber chip was split using a Valco tee (Houston, TX) and 0.31% of the flow was directed to the inlet of the enzyme assay mixing chip via fused silica capillary. The resulting 250 nL/min perfusate flow was mixed in a 1:1:1 ratio with the 2 reagents: free glycerol reagent and 300 μM Amplex UltraRed solution in DMSO (fluorogenic dye). The reagents were delivered to the chip by 100 μL Hamilton syringes on a syringe pump (CMA 402 pump, CMA Microdialysis, Holliston, MA). The resulting reactions that result in a fluorescent product are shown in Figure 3.
Figure 1.
The enzyme assay chip was capable of performing on-line mixing of three solutions and on-line detection of the enzymatic product. The layout shows the initial mixing channel connected to the incubation channel. Adapted with permission from Clark, A.M., et al. Anal. Chem., 2009, 81 (6), pp 2350–2356. Copyright 2009 American Chemical Society.
Figure 2.
A diagram of the perfusion cell chip depicts the two separate wafers employed in this work. The wafers were reversibly sealed with the aid of an in-house-built compression frame. Adapted with permission from Clark, A.M., et al. Anal. Chem., 2009, 81 (6), pp 2350–2356. Copyright 2009 American Chemical Society.
Figure 3.
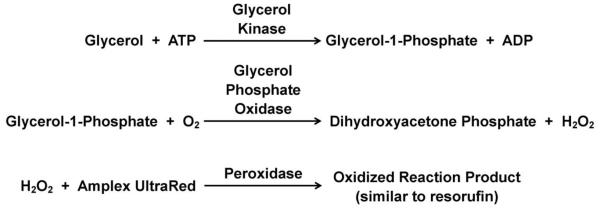
Glycerol enzyme assay reaction with the addition of the fluorogenic dye, Amplex UltraRed. The resulting propriety product is fluorescent at 543 nm.
2.4.2 Fatty Acid Assay Chip
To monitor fatty acid secretion from adipocytes, a chip containing both the cell chamber and enzyme assay mixing channels on one device was developed (Clark et al., 2010). The smaller dimensions of this device allow for a reduced volume of cells and reagents, and improved temporal resolution compared to the previously described dual-chip.
- The chip design of the integrated cell chamber and enzyme assay mixing chip comprised of etching 3 pieces of glass, shown in Figure 4.
- The top glass slide contained the upper portion of the cell chamber (100 μm deep), a moat around the chamber (100 μm deep), and fluidic access channels (5 μm deep) leading in and out of the cell chamber. Holes were drilled at the ends of the access channels of the top slide using a 1 mm diamond-tipped drill bit.
- The middle slide contained the lower cell chamber (450 μm deep) and an access hole to allow fluid to enter the lower slide. The access hole was drilled to 360 μm wide.
- The bottom glass slide contained the fluidic network for mixing the assay reagents with the cell perfusate (60 μm deep). The middle and lower slides were irreversibly bonded to enclose and prevent leaking from the mixing channels.
Holes with a 360 μm diameter were drilled into the side of the bonded chip to allow access to the reagent inlets. Reservoirs were glued to the top of the top slide, and capillaries (50 μm inner diameter/360 μm outer diameter) were inserted into the enzyme reagent inlets and sealed with epoxy.
A 2 × 12.5 mm2 coverslip with adhered adipocytes was loaded into the lower cell chamber, and the top glass slide was sealed on with vacuum grease as described previously with the dual chip. The entire chip was placed in an in-house built compression frame. A thin-film resistive heater set to 37 °C was placed over the cell chamber.
HBSS buffer or 20 μM isoproterenol in HBSS (both containing 2% BSA) was perfused at 8 μL/min through the cell chamber using a syringe pump. Solution changes were performed by pumping the 2 solutions through a 6-port valve.
The perfusate from the cell chamber was split by either exiting the top of the chip through the 1 mm drill hole (followed by 6.5 cm of 150 μm i.d. capillary) or the 360 μm access hole leading to the mixing channels in the lower chip. The flow entering the lower chip was 3% of the flow through the cell chamber. The resulting 250 nL/min flow was mixed in a 1:1:1 ratio with the reagents entering the other 2 inlets. One inlet perfused in CR-A and the other inlet perfused in a 2:1 mixture of CR-B:8.3 mM Amplex UltraRed in DMSO. The selected flow rates allowed a total mixing time of 5 minutes before detection. The on-chip reaction is shown in Figure 5.
Figure 4.

Chip design. (a) The multilayer device was comprised of three separately etched glass wafers that integrated a cell perfusion chamber and fluidic channels for on-line mixing of the fluorescence-based enzyme assay. (b) A side view of the cell chamber depicts the bonded and reversibly sealed portions of the device. Adapted with permission from Clark, A.M., et al. Anal. Bioanal. Chem., 2010, 397 (7), pp 2939–2947. Copyright 2010 Springer.
Figure 5.
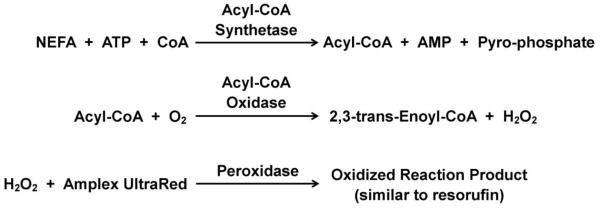
NEFA enzyme assay reaction. The addition of the fluorogenic dye, Amplex UltraRed creates a fluorescent product similar to resorufin that is fluorescent at 543 nm.
2.5 Detection
Laser-induced fluorescence was used for detection of the fluorescent resorufin-like product in the chip near the outlet of the enzyme assay mixing channels. A 543 nm He-Ne Melles Groit laser was used for excitation in an epi-fluorescence optics configuration. Light was focused and collected using a 40x, 0.6 numerical aperture objective (Cat. # 440864, Carl Zeiss Microscopy, Thornwood, NY), along with the appropriate dichroic mirror and filter set. A 1 mm pinhole was used in front of the photon counting detector and data was collected at 2 Hz. The data output was collected and analyzed on in-house written LabView programs.
3 Discussion
Online calibration curves were created for both the glycerol and fatty acid assays by perfusing standards through the cell chamber in the absence of adipocytes. The glycerol assay had a limit of detection (LOD) of 4 μM and the fatty acid assay had a LOD of 5 μM. Both assays had linear calibrations past the range that was needed to detect the amount secreted by the adipocytes. The RSD values were maintained under 5%, indicating a stable response, and reproducibility was observed after multiple calibrations. After transfer of the coverslip with a monolayer of differentiated adipocytes onto the chip, the cells were visually inspected to ensure they remained adhered to the glass and were not disrupted.
Representative traces of glycerol secretion from ~50,000 adipocytes are shown in Figure 6. A stable basal response was observed during perfusion of buffer. When isoproterenol was applied, stimulation of lipolysis was observed by an increase in glycerol secretion. An initial spike in concentration was observed 3-fold higher than basal, but slowly decreased to about 40% over basal concentrations and that was maintained for an hour or more. Control experiments were performed to ensure that isoproterenol did not interfere with the enzyme assay, and also that the fluorogenic dye was not responsible for the signal observed (data not shown).
Figure 6.

Representative traces of glycerol release from differentiated adipocytes and response upon 20 μM isoproterenol treatment are shown. The bars above traces represent exposure to 20 μM isoproterenol. The traces were shortened to depict only the time surrounding the initial exposure to isoproterenol. Adapted with permission from Clark, A.M., et al. Anal. Chem., 2009, 81 (6), pp 2350–2356. Copyright 2009 American Chemical Society.
The chip used for the fatty acid assay reduced the amount of cells required to about 6,200. As a result, the flow rate was decreased, which allowed for less analyte dilution and more of the sample to enter the enzyme mixing portion of the chip instead of being diverted to waste. The plots of the on-chip fatty acid release from adipocytes are shown in Figure 7. Stable basal concentrations were observed, but in contrast to the glycerol assay, when isoproterenol was applied, a stable elevated response was monitored. This elevated concentration was 7-fold higher than basal levels and was maintained over time.
Figure 7.

Representative traces of NEFA release from differentiated adipocytes and response from treatment with 20 μM isoproterenol (indicated by the bar) are shown. Adapted with permission from Clark, A.M., et al. Anal. Bioanal. Chem., 2010, 397 (7), pp 2939–2947. Copyright 2010 Springer.
4 Design & Operation Limitations
Maintaining flow stability is a major challenge in microfluidics devices. Many factors of the set-up can influence the fluid flow of the system: bubbles, connection leaks, pressure fluctuations from breaking connections to change solutions, and stability of the solution infusion pump. The integration of an on-chip reversibly-sealed cell chamber adds an extra source of error, as the high flow rates through the chamber can cause leaking of the reversible seal. Proper application of the vacuum grease around the cell chamber is crucial in creating a good seal. A thin layer should be spread, enough to form a seal, but not so much that would cause it to enter the cell chamber or channels when compressed (which could cause clogging). Moreover, the addition of extra medium in the chamber before sealing aided in preventing bubbles from forming in the chamber. As a result of the large volume of the cell chambers used in these experiments, a flow split was required, which is another source of potential flow instability. If any part of the system becomes clogged or contains a bubble, the flow split ratio will change. The removal of the flow split would require a smaller cell chamber with lower flow rates through the chamber.
In the aforementioned experiments, the switch from basal perfusion buffer to a solution containing isoproterenol required either manual changing of capillary connections or the use of an external 6-port valve. Manually changing connections creates a large disruption in flow because the inlet has to be stopped and moved, followed by an additional time period before stable flow is restored. The use of the 6-port valve reduced the pressure fluctuations, but still required long connection capillaries. A more automated, on-chip valve system would improve the system operation.
The design of the chamber and the fluidic connection channels leading in and out of the chamber can affect the temporal resolution of the system. The length of the chamber will influence the paracrine response of cells at the end of the chamber. Additionally, the longer the chamber, the more parabolic the flow becomes at the end of the chamber, increasing temporal resolution. Computer-assisted simulations demonstrated how the number and angle of channels leading to and from the cell chamber can change the flow profile through the chamber, generally with the goal of creating less of a parabolic profile.
5 Continued Improvements
In an effort to improve the chip automation and ease of assembly, a multilayer chip made entirely of PDMS has been developed. The inherent elastomeric properties of PDMS allow for the reversible sealing of a cell chamber without the use of vacuum grease or a sheet of PTFE. Automated switching of perfusion buffers can be performed on-chip by integrating valves, similar to those developed by Unger, et al (2000). Additionally, chamber dimensions and flow rates have been optimized to improve temporal resolution and allow the entire cell perfusate to enter the mixing channels instead of being directed to waste.
In order to adapt the assays and cell chamber to be compatible with the new material, some changes were made to the previously described procedures. PDMS swells in the presence of most organic solvents, so instead of diluting the Amplex UltraRed stock with DMSO, solutions were made in 35% DMSO. Since fatty acids can absorb into the hydrophobic PDMS, a glass coverslip was bonded onto the upper portion of the cell chamber to minimize the exposed surfaces to fatty acids. In the chips used for fatty acid assays, CR-A was supplemented with Triton X-100 prior to introduction on the chip, and the mixing channel walls were dynamically coated with sodium dodecyl sulfate (SDS) to prevent fatty acid interactions with the chip.
Through off-line assays, it was determined that improved fatty acid assay sensitivity could be achieved when the fluorogenic dye and CR-B are introduced in separate channels and downstream of the CR-A inlet. Essentially, the fluorogenic dye reacts quickly with CR-B and increases the background signal. The fatty acid reaction with CR-A is relatively slow and increased sensitivity is observed when there is a delay before the introduction of CR-B.
Footnotes
All chip fabrication was done in a clean room.
In microfluidic systems, mixing is only achieved through molecular diffusion (Beebe et al., 2002). To have sufficient mixing without the fabrication of complex mixers on-chip, the easiest solution is to have channels thin enough to allow complete diffusion across the channel using the desired flow rate and channel length, hence the two different channel widths seen in the chips.
Piranha solution is 3:1 H2SO4:H2O2 (v/v). This is a very strong oxidizing agent and should be handled with care. RCA solution is 5:1:1 H2O:NH4:H2O2 (v/v/v).
Ideally, the coverslips should be cut with a dicing saw, which will result in more precise measurements than cutting by hand can provide.
Literature Cited
- Beebe DJ, Mensing GA, Walker GM. Physics and Applications of Microfluidics in Biology. Annual Review of Biomedical Engineering. 2002;4:261–286. doi: 10.1146/annurev.bioeng.4.112601.125916. [DOI] [PubMed] [Google Scholar]
- Clark A, Sousa K, Chisolm C, MacDougald O, Kennedy R. Reversibly sealed multilayer microfluidic device for integrated cell perfusion and on-line chemical analysis of cultured adipocyte secretions. Analytical and Bioanalytical Chemistry. 2010;397:2939–2947. doi: 10.1007/s00216-010-3897-z. [DOI] [PMC free article] [PubMed] [Google Scholar]
- Clark AM, Sousa KM, Jennings C, MacDougald OA, Kennedy RT. Continuous-Flow Enzyme Assay on a Microfluidic Chip for Monitoring Glycerol Secretion from Cultured Adipocytes. Analytical Chemistry. 2009;81:2350–2356. doi: 10.1021/ac8026965. [DOI] [PMC free article] [PubMed] [Google Scholar]
- Dishinger JF, Reid KR, Kennedy RT. Quantitative Monitoring of Insulin Secretion from Single Islets of Langerhans in Parallel on a Microfluidic Chip. Analytical Chemistry. 2009;81:3119–3127. doi: 10.1021/ac900109t. [DOI] [PMC free article] [PubMed] [Google Scholar]
- Duncan RE, Ahmadian M, Jaworski K, Sarkadi-Nagy E, Sul HS. Regulation of lipolysis in adipocytes Annual Review of Nutrition. Vol. 27. Annual Reviews; Palo Alto: 2007. pp. 79–101. [DOI] [PMC free article] [PubMed] [Google Scholar]
- El-Ali J, Sorger PK, Jensen KF. Cells on chips. Nature. 2006;442:403–411. doi: 10.1038/nature05063. [DOI] [PubMed] [Google Scholar]
- Goto M, Sato K, Murakami A, Tokeshi M, Kitamori T. Development of a microchip-based bioassay system using cultured cells. Analytical Chemistry. 2005;77:2125–2131. doi: 10.1021/ac040165g. [DOI] [PubMed] [Google Scholar]
- Huh D, Matthews BD, Mammoto A, Montoya-Zavala M, Hsin HY, Ingber DE. Reconstituting Organ-Level Lung Functions on a Chip. Science. 2010;328:1662–1668. doi: 10.1126/science.1188302. [DOI] [PMC free article] [PubMed] [Google Scholar]
- Lai N, Sims JK, Jeon NL, Lee K. Adipocyte Induction of Preadipocyte Differentiation in a Gradient Chamber. Tissue Engineering Part C-Methods. 2012;18:958–967. doi: 10.1089/ten.tec.2012.0168. [DOI] [PMC free article] [PubMed] [Google Scholar]
- Millward CA, DeSantis D, Hsieh CW, Heaney JD, Pisano S, Olswang Y, et al. Phosphoenolpyruvate carboxykinase (Pck1) helps regulate the triglyceride/fatty acid cycle and development of insulin resistance in mice. Journal of Lipid Research. 2010;51:1452–1463. doi: 10.1194/jlr.M005363. [DOI] [PMC free article] [PubMed] [Google Scholar]
- Roper MG, Shackman JG, Dahlgren GM, Kennedy RT. Microfluidic chip for continuous monitoring of hormone secretion from live cells using an electrophoresis-based immunoassay. Analytical Chemistry. 2003;75:4711–4717. doi: 10.1021/ac0346813. [DOI] [PubMed] [Google Scholar]
- Rosen ED, Spiegelman BM. Adipocytes as regulators of energy balance and glucose homeostasis. Nature. 2006;444:847–853. doi: 10.1038/nature05483. [DOI] [PMC free article] [PubMed] [Google Scholar]
- Samuel VT, Shulman GI. Mechanisms for Insulin Resistance: Common Threads and Missing Links. Cell. 2012;148:852–871. doi: 10.1016/j.cell.2012.02.017. [DOI] [PMC free article] [PubMed] [Google Scholar]
- Shackman JG, Reid KR, Dugan CE, Kennedy RT. Dynamic monitoring of glucagon secretion from living cells on a microfluidic chip. Analytical and Bioanalytical Chemistry. 2012;402:2797–2803. doi: 10.1007/s00216-012-5755-7. [DOI] [PMC free article] [PubMed] [Google Scholar]
- Tumarkin E, Tzadu L, Csaszar E, Seo M, Zhang H, Lee A, et al. High-throughput combinatorial cell co-culture using microfluidics. Integrative Biology. 2011;3:653–662. doi: 10.1039/c1ib00002k. [DOI] [PubMed] [Google Scholar]
- Unger MA, Chou HP, Thorsen T, Scherer A, Quake SR. Monolithic microfabricated valves and pumps by multilayer soft lithography. Science. 2000;288:113–116. doi: 10.1126/science.288.5463.113. [DOI] [PubMed] [Google Scholar]
- van Midwoud PM, Janse A, Merema MT, Groothuis GMM, Verpoorte E. Comparison of Biocompatibility and Adsorption Properties of Different Plastics for Advanced Microfluidic Cell and Tissue Culture Models. Analytical Chemistry. 2012;84:3938–3944. doi: 10.1021/ac300771z. [DOI] [PubMed] [Google Scholar]
- Wan J, Ristenpart WD, Stone HA. Dynamics of shear-induced ATP release from red blood cells. Proceedings of the National Academy of Sciences. 2008;105:16432–16437. doi: 10.1073/pnas.0805779105. [DOI] [PMC free article] [PubMed] [Google Scholar]
- Wyne KL. Free fatty acids and type 2 diabetes mellitus. American Journal of Medicine. 2003;115:29–36. doi: 10.1016/j.amjmed.2003.09.004. [DOI] [PubMed] [Google Scholar]