

Abstract
Characterization of regional left ventricular (LV) function may have application in prognosticating timely response and informing choice therapy in patients with ischemic cardiomyopathy. The purpose of this study is to characterize LV function through a systematic analysis of 4D (3D + time) endocardial motion over the cardiac cycle in an effort to define objective, clinically useful metrics of pathological remodeling and declining cardiac performance, using standard cardiac MRI data for two distinct patient cohorts accessed from CardiacAtlas.org: a) MESA – a cohort of asymptomatic patients; and b) DETERMINE – a cohort of symptomatic patients with a history of ischemic heart disease (IHD) or myocardial infarction. The LV endocardium was segmented and a signed phase-to-phase Hausdorff distance (HD) was computed at 3D uniformly spaced points tracked on segmented endocardial surface contours, over the cardiac cycle. An LV-averaged index of phase-to-phase endocardial displacement (P2PD) time-histories was computed at each tracked point, using the HD computed between consecutive cardiac phases. Average and standard deviation in P2PD over the cardiac cycle was used to prepare characteristic curves for the asymptomatic and IHD cohort. A novel biomarker of RMS error between mean patient-specific characteristic P2PD over the cardiac cycle for each individual patient and the cumulative P2PD characteristic of a cohort of asymptomatic patients was established as the RMS-P2PD marker. The novel RMS-P2PD marker was tested as a cardiac function based feature for automatic patient classification using a Bayesian Rule Learning (BRL) framework. The RMS-P2PD biomarker indices were significantly different for the symptomatic patient and asymptomatic control cohorts (p<0.001). BRL accurately classified 83.8% of patients correctly from the patient and control populations, with leave-one-out cross validation, using standard indices of LV ejection fraction (LV-EF) and LV end-systolic volume index (LV-ESVI). This improved to 91.9% with inclusion of the RMS-P2PD biomarker and was congruent with improvements in both sensitivity for classifying patients and specificity for identifying asymptomatic controls from 82.6% up to 95.7%. RMS-P2PD, when contrasted against a collective normal reference, is a promising biomarker to investigate further in its utility for identifying quantitative signs of pathological endocardial function which may boost standard image makers as precursors of declining cardiac performance.
Keywords: Left Ventricular Function, Cardiomyopathy, Cardiac Magnetic Resonance Imaging, Bayesian Rule Learning, Classification
1. Introduction
Abnormal / discoordinated regional wall motion during left ventricular (LV) contraction is a precursor to poor systolic performance evidenced by diminished global function parameters viz. ejection fraction and stroke volume. Accurate and timely quantification of regional pathological function (hypokinesia / akinesia / dyskinesia) could be vital for early clinical risk assessment and patient management of ischemic heart disease (IHD), and evaluation of therapeutic efficacy prior to when significant changes occur to global function parameters. The unique features provided by cardiac magnetic resonance (CMR) imaging allow for evaluation of regional systolic and diastolic myocardial function in 3D at each cardiac phase. The purpose of this study is to characterize LV function through a systematic analysis of 4D (3D + time) endocardial motion over the cardiac cycle in an effort to define objective, clinically useful metrics of pathological remodeling and declining cardiac performance, using standard cardiac MRI data.
2. Materials and Methods
2.1 Image Data
LV endocardial function was studied using time-resolved short-axis cine steady state free precession CMR image data extracted from distinct patient cohorts accessed through CardiacAtlas.org [1], namely from the: a) Multi-Ethnic Study of Atherosclerosis (MESA) trial – a cohort of asymptomatic patients; and b) DETERMINE (Design for the Defibrillators to Reduce Risk by Magnetic Resonance Imaging Evaluation) trial – a cohort of symptomatic patients with a history of ischemic heart disease (IHD) or myocardial infarction. LV Ejection fraction (LV-EF) and LV end-systolic volume index (LV-ESVI) were both recorded for each patient. 3D LV endocardial surface contours were extracted at each cardiac phase from MRI data using Medviso Segment (MedvisoAB, Lund, Sweden [2]). LV endocardial motion was then quantitatively examined in 30 patients with IHD (DETERMINE) and 15 asymptomatic patients (MESA).
2.2 Image Analysis: Cardiac function quantification
An in-house plugin was developed in Paraview (Kitware, Inc., Clifton Park, NY) to compute a signed Hausdorff distance (HD) [3,4] between consecutive cardiac phases, at uniformly spaced surface points on the segmented endocardial surfaces. The HD analysis inherently establishes point-correspondences between the separate LV endocardial surfaces segmented out at consecutive cardiac phases and therefore defines a shape-derived metric of LV function. Further, time histories of displacement of the tracked surface points were recorded by tracking the motion of these points between successive cardiac phases, by leveraging the established pair-wise endocardial surface correspondences. In order to characterize an average index of regional endocardial motion over time, phase-to-phase endocardial displacement (P2PD – displacement per phase) time-history curves were prepared by averaging recordings from all tracked surface points Finally, a cumulative average and standard deviation in the P2PD time-history curves for all subjects in the asymptomatic and symptomatic (i.e. IHD) patient cohorts were compared.
2.3 Biomarker extraction & Classification
A novel biomarker of root mean squared (RMS) difference between the endocardium-average patient-specific P2PD time-history characteristic for each patient of the study cohort and that defined by the cumulative average of the considered cohort of asymptomatic patients, was established as the RMS-P2PD marker. To test the accuracy of this novel image-based biomarker for automatic classification of asymptomatic vs. IHD patients, we input the standard CMR indices, LV-EF and LV-ESVI, along with the RMS-P2PD marker to the Bayesian Rule Learning (BRL) [5] classification framework. We applied equal-frequency binning to automatically discretize the continuous numerical range of each input feature into discrete bins of values. Leave-one-out cross-validation results were recorded and reported for each tested classification exercise viz. using the standard CMR indices alone as well as using them in combination with the RMS-P2PD marker.
3. Results and Discussion
HD shape analysis resulted in an objective colored rendering of regional shape deformation (see Video 1). Fig. 1 visually demonstrates the effectiveness of the HD metric in objectively identifying the existence of hypokinetic (pale blue during diastole and yellow during systole), akinetic (green) and dyskinetic (blue at systole, red at diastole) regions. Normal endocardial function (Fig. 1, Right) entails a uniformly red HD colormap during systole and a uniformly blue HD colormap during diastole, with exceptions only near the less mobile regions adjacent to the aortic or mitral valve annuluses (i.e. at the LV base).
Video 1.
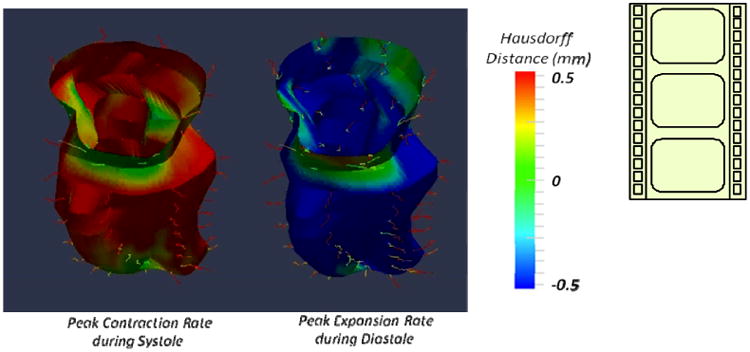
The objective colored rendering of regional shape deformation (i.e. phase to phase HD, in mm) throughout the cardiac cycle for a representative IHD patient with a small lateral wall motion abnormality seen as a green patch toward the apex of the LV during both systole and diastole, in the video. In case of normal contractile myocardium synchronous contraction with uniform colors viz. consistently blue and red during systole and diastole, respectively, is expected. Note in this example that the regions of the LV base colored in green are not regions of abnormal function but the adjacent regions of the valve annulus of the aortic and mitral valves. http://dx.doi.org/10.1117/12.2042118.1
Figure 1.
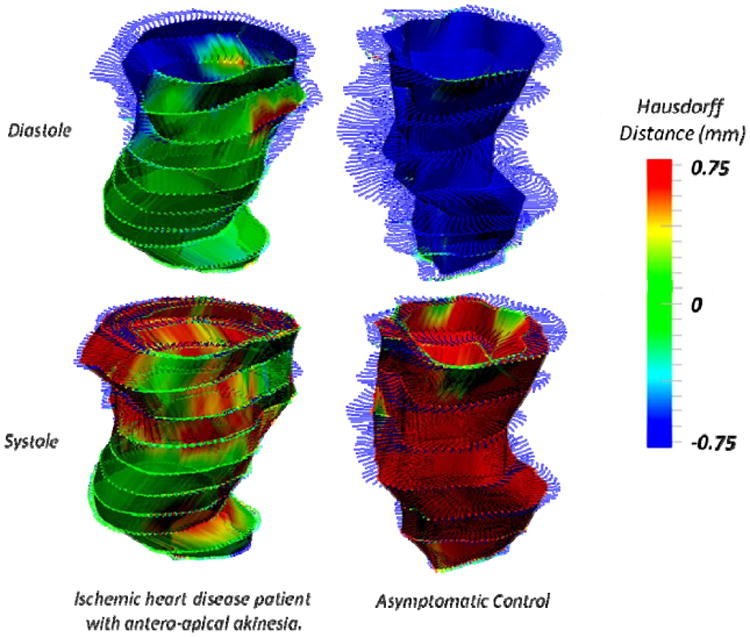
IHD patient and asymptomatic control LVs compared at instants of peak ejection (systole, top) and peak filling (diastole, bottom) rates. Normal LV contraction showed uniformly blue (contraction) and red (expansion) whereas patient LVs had large akinetic (green) territories during both systole and diastole.
Fig. 2 compares a cumulative P2PD plot (in mm/phase) for all asymptomatic patients (green / light) and IHD patients (red / dark), respectively, in an effort to characterize each cohort over the entire cardiac cycle period. Note the sign convention here where positive P2PD indicates inward surface motion i.e. contraction, and negative P2PD indicates expansion. The average asymptomatic P2PD time-history (light / green in Fig. 2) was characteristically and visibly significantly different than the IHD patient cohort (dark / red in Fig. 2). IHD patients demonstrated distinct traits of: a) diminished instantaneous peak P2PD magnitudes; b) indistinct zero crossing instants of the mean P2PD time-history curve, characterized by a more gradual slope of zero-crossing in contrast with the asymptomatic patients, indicating a time-distribution for the expected instants of end-systole and diastole across the LV endocardial surface; and c) delay in the end-systolic and end-diastolic zero-crossing instants of the mean P2PD time-history curve as compared to the asymptomatic cohort, indicating dyssynchronous contraction. Further, the resulting RMS-P2PD biomarker indices were significantly different for the patient and asymptomatic control cohorts (p<0.001).
Figure 2.
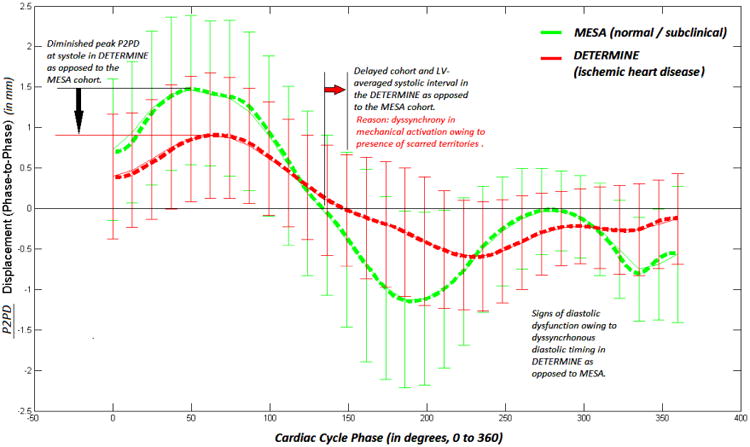
Mean P2PD compared for asymptomatic controls (green / light) and IHD patients (red / dark) with standard deviations at each cardiac phase. Discernible contraction and expansion phases of the cardiac cycle have been demarcated.
Using standard indices of LV-EF and LV-ESVI, BRL classified 83.8% of patients accurately from the patient and control populations, based upon a leave-one-out type cross validation. This improved to 91.9% with the inclusion of the RMS-P2PD biomarker. The addition of the RMS-P2PD marker was congruent with improvements in sensitivity of identifying IHD patients and improvements in specificity of identifying asymptomatic patients; each increased from 82.6% to 95.7% (see Table 1 and Figure 3).
Table 1.
BRL results, including classification sensitivity and specificity for symptomatic & asymptomatic patients.
| Accuracy (%) | Class | Sensitivity (%) | Specificity (%) | |
|---|---|---|---|---|
| RMS-P2PD only | 70.27 ± 7.62 | IHD | 65.22 ± 10.15 | 78.57 ± 11.38 |
| Control | 78.57 ± 11.38 | 65.22 ± 10.15 | ||
| LV-EF, LV-ESVI | 83.78 ± 6.14 | IHD | 82.61 ± 8.08 | 85.71 ± 9.71 |
| Control | 85.71 ± 9.71 | 82.61 ± 8.08 | ||
| LV-EF, LV-ESVI & RMS-P2PD | 91.89 ± 4.55 | IHD | 95.65 ± 4.35 | 85.71 ± 9.71 |
| Control | 85.71 ± 9.70 | 95.65 ± 4.35 |
Figure 3.
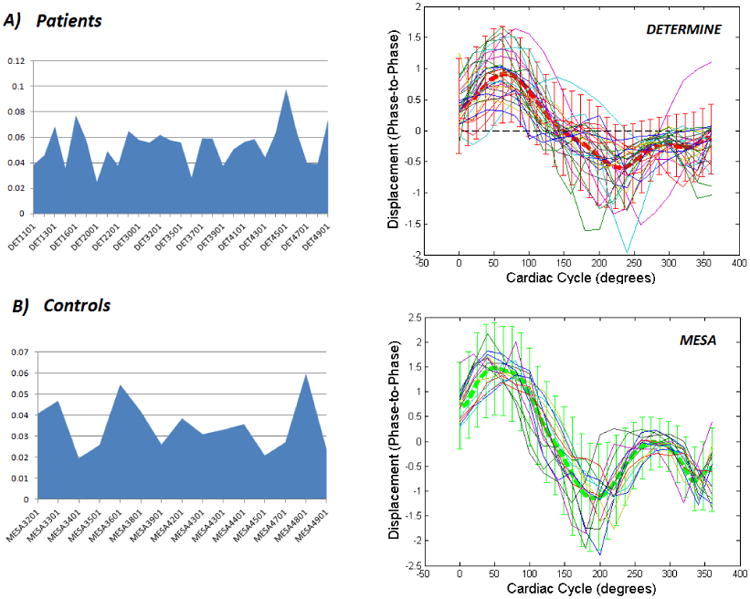
RMS-P2PD i.e. RMS difference between individual patient-specific endocardium-averaged and the mean P2PD curve over the cardiac cycle for the asymptomatic patients, presented for: a) the individual IHD patients (top); and b) the individual asymptomatic controls (bottom), considered in our study cohort. The individual P2PD characteristic curves over the cardiac cycle for each cohort are presented alongside along with a background of the mean and standard deviation for the respective cohort.
4. Conclusion
In this pilot study we demonstrate, for the first time in the literature, the value of a promising paradigm for employing regional cardiac function as a novel imaging-based biomarker for automatically classifying patients with ischemic cardiomyopathy, based on cine CMR image data. While tissue-tagged CMR image analysis is capable of measuring myocardial strain, the presented technique of HD analysis provides an equivalent metric of regional endocardial strain using standard cine CMR images alone, further resulting in objective renderings that quantify and enable spatial identification of wall-motion abnormalities. Using BRL, it was possible to quantitatively evidence the merit of the proposed novel RMS-P2PD biomarker for identifying quantitative signs of pathological endocardial function. It was also shown that when contrasted against an appropriate asymptomatic reference P2PD time-history characteristic, the RMS-P2PD marker may boost the value of routinely extracted CMR image makers (LV-EF, LV-ESVI) in their classification accuracy to act as precursors of declining cardiac performance. Shape-based imaging biomarkers of cardiac function may have potential in facilitating timely, informed and appropriate clinical attention for IHD patients. A larger group of asymptomatic controls will provide the ability to more accurately characterize a baseline P2PD time-history characteristic for the RMS-P2PD marker, which may in-turn improve classification accuracy. Therefore, a similar study with a larger patient cohort is warranted in order to validate this pilot study.
Acknowledgments
The authors gratefully acknowledge grant number R01LM010950 from the National Library of Medicine at the National Institutes of Health. VG was funded also in part by grants R01GM100387 and P50CA090440 from the National Institutes of Health. The content is solely the responsibility of the authors and does not necessarily represent the official views of the National Institutes of Health.
References
- 1.Fonseca CG, Backhaus M, Bluemke DA, Britten RD, Chung JD, Cowan BR, Dinov ID, Finn JP, Hunter PJ, Kadish AH, Lee DC, Lima JAC, Medrano-Gracia P, Shivkumar K, Suinesiaputra A, Tao W, Young AA. The Cardiac Atlas Project – An imaging database for computational modeling and statistical atlases of the heart. Bioinformatics. 2011;27(16):2288–2295. doi: 10.1093/bioinformatics/btr360. [DOI] [PMC free article] [PubMed] [Google Scholar]
- 2.Heiberg E, Sjögren J, Ugander M, Carlsson C, Engblom H, Arheden H. Design and validation of Segment - freely available software for cardiovascular image analysis. BMC Med Imaging. 2010;10:1. doi: 10.1186/1471-2342-10-1. [DOI] [PMC free article] [PubMed] [Google Scholar]
- 3.Hausdorff F. Dimension und ausseres Mass. Mathematische Annalen. 1918;79:157–179. [Google Scholar]
- 4.Adhyapak SM, Menon PG, Rao PV. Restoration of optimal ellipsoid left ventricular geometry: lessons learnt from in silico surgical modeling. Interact Cardiovasc Thorac Surg. 2013 doi: 10.1093/icvts/ivt464. Epub ahead of print. [DOI] [PMC free article] [PubMed] [Google Scholar]
- 5.Gopalakrishnan V, Lustgarten JL, Visweswaran S, Cooper GF. Bayesian Rule Learning for Biomedical Data Mining. Bioinformatics. 2010;26(5):668–675. doi: 10.1093/bioinformatics/btq005. [DOI] [PMC free article] [PubMed] [Google Scholar]