Abstract
Spatio-temporal changes in the extracellular matrix (ECM) were studied within abdominal aortic aneurysms (AAA) generated in rats via elastase-infusion. At 7, 14, and 21 days post-induction, AAA tissues were divided into proximal, mid and distal regions based on their location relative to the renal arteries and region of maximal aortic diameter. Wall thicknesses differed significantly between the AAA spatial regions, initially increasing due to positive matrix remodeling, and then decreasing due to wall thinning and compaction of matrix as the disease progressed. Histological images analyzed using custom segmentation tools indicated significant differences in ECM composition and structure, versus healthy tissue and in the extent and nature of matrix remodeling, between the AAA spatial regions. Histology and immunofluorescence (IF) labeling provided evidence of neointimal AAA remodeling characterized by presence of elastin-containing fibers. This remodeling was effected by smooth muscle alpha actin-positive neointimal cells that transmission electron microscopy (TEM) showed to morphologically differ from medial SMCs. TEM of the neointima further showed presence of elongated deposits of amorphous elastin and presence of nascent, but not mature elastic fibers. These structures appeared to be deficient in at least one microfibrillar component, fibrillin-1, which is critical to mature elastic fiber assembly. The substantial production of elastin and elastic fiber-like structures that we observed in the AAA neointima, which was not observed elsewhere within AAA tissues, provides us a unique opportunity to capitalize on this auto-regenerative phenomenon and direct it from the standpoint of matrix organization towards restoring healthy aortic matrix structure, mechanics, and function.
Introduction
Abdominal aortic aneurysms (AAA) are conditions wherein the abdominal aortic wall slowly weakens, dilates, and ultimately ruptures. Studies have shown that chronic proteolytic disruption of the structural matrix proteins elastin and collagen, contributes significantly to such wall weakening and to its bulging upon encountering hemodynamic forces (Campbell et al. 1985). With progressive matrix disruption, the elastic modulus and strength of the aortic wall reduce to attain a critical value lesser than the peak wall stress, at which time the aorta tends to rupture. The aortic wall stress tends to be maximal at sites of abrupt changes in vessel diameter, such as at the proximal (closer to renal bifurcation) and distal (closer to iliac bifurcation) necks and is dependent on the curvature of the aortal ballooning and degree of geometrical asymmetry of the AAA (Vorp et al. 1998). It is quite plausible that restoring the elastic matrix structure within these high-stress regions can potentially improve the elastic properties of the aortic wall at these critical regions and hence delay the AAA growth to rupture. Studies involving experimentally induced saccular aneurysms in porcine carotid arteries have shown remodeling to occur in the neck regions and involve abundant collagen deposition, leading to their apparent stabilization (Raymond et al. 1999). We hypothesize that such remodeling and auto-regenerative phenomena can also occur in the neck regions of nonsaccular AAAs and maybe capitalized upon to induce regenerative matrix repair to stabilize the aortic wall. A detailed investigation of such remodeling process is hence necessary. However, to date there is little information on the a) temporal and spatial matrix remodeling of the AAA, b) expression pattern of elastin, collagen and glycosaminoglycans (GAGs) in remodeling tissue, c) site specificity of such remodeling, e) cell types involved in the process, f) quality of the newly regenerated elastic matrix. To investigate these aspects, we conducted a systematic study of the spatio-temporal changes (disruptive and regenerative) in the ECM of the aneurysmal wall, in AAAs generated via an elastase-infusion method, which closely mimics human AAA pathology (Tsui 2010).
This study was designed to to identify AAA-site-specific deterioration of ECM components in an AAA wall after elastase infusion-inflicted injury and concomitant remodeling of the matrix with progression of the disease. This information can be used to correlate such matrix remodeling events to the distribution of specific cell types across the AAA wall and in future work to hemodynamic stress distribution within. Apart from that this information will also help us design drug delivery vehicles with appropriate tethering properties and loading to reinstate the damaged elastic matrix in situ.
2. Materials and Methods
2.1 Experimental Design
AAAs were induced in young-adult Sprague-Dawley rats by elastase perfusion and aneurysmal aortae harvested after 7, 14 and 21 days for analysis (n = 3 animals per time point). Harvested aortae from each time point were divided into 3 regions, proximal, mid and distal, as explained later, and analyzed using histology, immunofluorescence (IF), confocal microscopy, polarizing light microscopy and transmission electron microscopy (TEM). This yielded spatio-temporal data and microstructural information about the regenerative process.
2.2 AAA Induction in Rats
All animal procedures were conducted with approval of the Institutional Animal Care and Use Committee (IACUC) at the Cleveland Clinic, which is AAALAC accredited (# A3047-01, 4/1/13). AAAs were induced in young – adult Sprague Dawley rats (Charles River, Wilmington, MA) weighing 200-250 g via an elastase infusion procedure we have described in a previous publication (Gacchina et al. 2011). The AAAs were allowed to develop over 7, 14 and 21 days post-induction, with n = 3 animals for the 7 and 14 day time-points and n = 5 rats for the 21 day time point. At the respective post-induction times, the rats were euthanized for isolation of the AAA segments. Healthy aortal tissue (healthy control) was obtained from the supra-renal region adjoining the AAA aortae. Sham tissue was obtained by performing the surgical procedure as above but infusing 0.9% v/v saline into the aorta instead of elastase.
2.3 Tissue Harvesting and Processing
Aneurysmal aortal segments (n = 3) from the all three groups of rats were immersed in 10% v/v formalin (Sigma-Aldrich, St Louis, MO) immediately after harvest and fixed overnight at 4 °C. The aortae were then immersed in 30% w/v sucrose (VWR, Radnor, PA) to prevent ice formation during cryo-freezing. They were then divided into ‘proximal’, ‘medial’ and ‘distal’ regions, under a stereo-microscope. The region along the length of the AAA that was centered around the site exhibiting maximal expansion in diameter was designated the ‘mid’ region; this region was demarcated to extend just until the neck of the AAA. The AAA neck was defined as the region tapering into the relatively normal aortic segment towards the iliac and renal bifurcations when located between the most anterior extent of the AAA and the renal arteries the region was designated as ‘proximal neck’ and when located between the iliac bifurcation the most posterior extent of the AAA it was designated the ‘distal neck’(Walker et al. 2010). The AAA segments were cryo-embedded in Tissue-Tek Optically Clear Tissue freezing compound (OCT) (Sakura Finetek, CA, USA) and stored at −20 °C. From these blocks, 5 μm thick cryo-sections were made onto pre-treated histology slides (Fisher Scientific, Pittsburgh, PA). The sections were stained with Masson’s Trichrome stain for detection of collagen (blue) and smooth muscle cells (red) and Movat’s Pentachrome stain to identify elastin (black), collagen (yellow) and GAGs (green to azure) (Scytek Labs, Logan, Utah). Sections (1 μm) from 21 day samples were stained with Toluidine blue to visualize GAGs and proteoglycans (Tiedemann et al. 2001) associated with nascent elastic fiber deposition. For IF, tissue sections were labeled with polyclonal primary antibodies against Elastin (Rabbit × Rat, Millipore, Billerica, MA), α-smooth muscle Actin (Rabbit × Rat, Abcam, Cambridge, MA) and Fibrillin-1 (Rabbit × Rat, Abcam). To reduce interference due to auto-fluorescence from elastin and collagen in the aortic tissue, a near-infra red emitting Alexa-Flour 633 conjugated secondary goat anti-rabbit antibody (Life Technologies, Carlsbad, CA), was used to label all the samples. All IF-labeled tissue samples were mounted with Vectashield containing the nuclear dye 4′,6-diamidino-2-phenylindole (DAPI) (Vector Labs, Burlingame, CA). For the 21 day time point, harvested AAA tissue samples from two additional rats were processed for TEM by immersing in cacodylate fixative (2.5% w/v glutaradehyde and 4% w/v paraformaldehyde in 0.2 M sodium cacodylate buffer) immediately upon harvest and maintained overnight at 4 °C. The tissue was then postfixed in 1% w/v osmium tetroxide, dehydrated in graded ethanol series (50-100% w/v) and further dehydrated with propylene oxide. The samples were embedded in Epon-812 resin, sectioned (85 nm thickness) with a diamond knife, placed on copper grids, stained with uranyl acetate and lead citrate, and visualized on a Philips CS12/STEM TEM microscope (FEI Company, Hillsboro, OR). Few 1 um sections were also made, stained with toluidine blue and imaged under a brightfield microscope.
2.4 Imaging and Image Analysis
Stereomicroscopy
At 7, 14 and 21 days following AAA induction, laparotomies were performed on the rats and the aortae imaged under a stereomicroscope, along with a physical scale marker (vascular clamps). The diameters of AAAs at specified time points were quantified at the regions of maximal bulge using Image-J software (National Institutes of Health, Bethesda, MD) in reference to the scale markers.
Brightfield Microscopy
Histologically-stained sections from each designated region of the AAA of each replicate rat at each induction time point, were imaged at 20× objective magnification under a brightfield microscope (Olympus-America, Center Valley, PA). Three images were acquired per section in such a manner as to contiguously cover the entire circumference of the AAA tissue. The wall thicknesses in different regions of the AAA tissue segment were measured using Image-J on images (2× objective magnification) of Movat’s Pentachrome-stained tissue sections sourced from the proximal, mid and distal regions of the AAA and healthy supra-renal aortal segments above the AAA. Average wall thickness in each AAA region was calculated from 6 repeat measurements of each of 3 images/region/replicate rat/time point.
Bright-field histology images were imported into Image-Pro Plus (v7.0, Media Cybernetics, Silver Spring, MD, USA). The area occupied by differently-stained cell and matrix components in the histological tissue sections were analyzed using customized visual basic Image-Pro macros developed by Image-IQ, Inc. (Cleveland, OH). For each tissue section, manual and arbitrary regions-of-interest (ROIs) were drawn to separately analyze the intimal and medial tissue layers. This procedure was repeated 3 times per image and although in effect the same image was repeat-analyzed, this procedure incorporated randomization in selection of ROIs, thereby rendering the data-set more representative. This strategy was repeated for 3 images taken for each tissue section in each replicate rat per time point, leading to a large enough sample size. Images of pentachrome and trichrome-stained histological sections were analyzed quantitatively for the amount of GAGs and elastin and the amount of muscle and collagen, respectively in the intimal and medial layers. Briefly, each tissue type was segmented using a customized color palette to identify each tissue stain’s color hue. The segmentation algorithm was iteratively trained over multiple images and the parameters optimized. The area for each tissue was measured and exported to MS Excel and a pseudo-colored overlay image was saved showing the outline of the identified tissue regions. Each of the measurements was expressed as a percentage of the total area of the ROI, thereby yielding percentage content for each ECM component and cells in the ROI and then normalized to similarly acquired data from healthy tissue controls. All data generated for each AAA post induction time point and from each spatial region from the n = 3 replicate animals per time point, were pooled together and analyzed. Utilizing this approach, the relative normalized distribution of matrix components and cells were estimated as a function of AAA progression and spatial location i.e. the proximal, mid and distal regions of the AAA.
Immunofluorescence Detection of ECM Components and Cells within AAAs
Immunofluorescence images were obtained at 40× objective magnification using a confocal microscope (Leica Microsystems, Wetzlar, Germany). A fixed, but unstained tissue section was used to custom the confocal microscope settings so as to negate the background signal, if any. Healthy aortal tissue sections, as explained earlier, were immunolabeled for each marker of interest and imaged with the laser intensities and PMT gain values set to obtain images of optimal quality. These same settings were used to visualize the respective markers in tissue sections drawn from the different AAA time/spatial groups. Images spanning the entire cross-section of AAAs were obtained from each tissue section. Autofluorescence due to elastic fibers and non-fibrillar elastin was detected in the green channel under confocal settings that minimized autofluoresecnce due to collagen with adventitial collagen as point of reference. Co-localization of green autofluorescence observed, with far-red fluoresecence due to antibody based detection of elastin was used to confirm elastin and elastic fibers as the source of autofluorescence.
Characteristics of autofluorescent fiber structures in the media and neointima were determined by image analysis using customized Image-Pro macros developed in visual basic by Image-IQ, Inc. (Cleveland, OH). As done with the brightfield histological images, for each tissue section, manual regions-of-interest (ROIs) were drawn to separately analyze the neointimal and medial tissue layers. The elastic fibers were segmented using spectral filter enhancements on the color channel corresponding to elastin autofluorescence. A skeletonizing and pruning algorithm was applied to the segmented fiber image creating pixel wide line segments of the fibers’ medial axis. The fiber area, tortuosity, and diameter were estimated and automatically exported to MS Excel and a pseudo-colored overlay image was saved illustrating the skeletonized fiber objects and the ROI tissue layer boundaries.
Polarized Light Microscopy (PLM)
A CRI-Abrio polarizing microscope (Hinds instruments, Hillsboro, OR) was used to determine region-specific differences in optical retardance within AAA tissue section drawn from each of the test groups. Precaution was taken to transfer the cryo-sections only onto glass slides as plastic has optical properties that makes it unsuitable for PLM. Difference in retardance, which is a measure of differences in micro-level order in the material, was noted based on the brightness of the region under polarized light. Regions with higher retardance appeared brighter compared to regions with lower retardance. Adventitial, medial and neointimal regions were imaged in transverse aortal sections made from tissue at the designated spatial regions of AAA isolated from replicate rats at the different AAA post-induction time points. The differences in micro-structural order due to variation in the collagen and elastin matrix in tissues with post-induction time and spatial locations, were semi-quantitatively determined by 2 different volunteers who provided a measure of the extent of signal in each ROI of an image as per an ordinal scale, wherein a value of +5 represented a maximal signal and 0 represented the minimal signal extent to which matrix organization resembles that of adventitial collagen (assigned a score of 5), with each semi-quantification performed 3 times/region of AAA/time point. The polarizing micrograph for each condition was referenced against the corresponding histological micrographs to confirm the identity and localization of collagen and by its exclusion the localization of elastin/elastic matrix.
Transmission Electron Microscopy (TEM)
The ultrastructure of cells involved in neointimal remodeling at the AAA site, and their corresponding ECM was visualized using TEM. TEM was performed only for tissue sections made from the AAAs at the 21-day time point. Representative images were used to discern the phenotypes of cells involved in neointimal remodeling within the AAA wall, particularly from the standpoint of elastin and elastic fiber formation. The intra-cellular synthetic and contractile machinery and the state of the endothelium were also observed. The distribution and organization of elastin (i.e., amorphous versus fibrillar) in the neointima and that of collagen and fibrillin microfibrils were noted.
2.5 Statistical Analysis
From histograms of areas occupied by a certain color in histology images, the obtained data-sets were determined using the Shapiro-Wilk test to exhibit only a near-normal distribution. Hence, to evaluate the significance of difference between our cases, we utilized the Mann-Whitney non-parametric test available in the statistical analysis software Minitab® (Minitab Inc., State College, PA). Statistical significance of differences was deemed for a p value of <0.05. The statistical software Minitab was also used to indicate the relationship between abundance of ECM components, location within the AAA tissue and progression of the disease and whether the tissue being observed is in the medial or neointimal region. This was expressed as interaction-plots and provided a summarized illustration of the data obtained from histology sections.
3. Results
3.1 AAA diameter and wall thickness changes
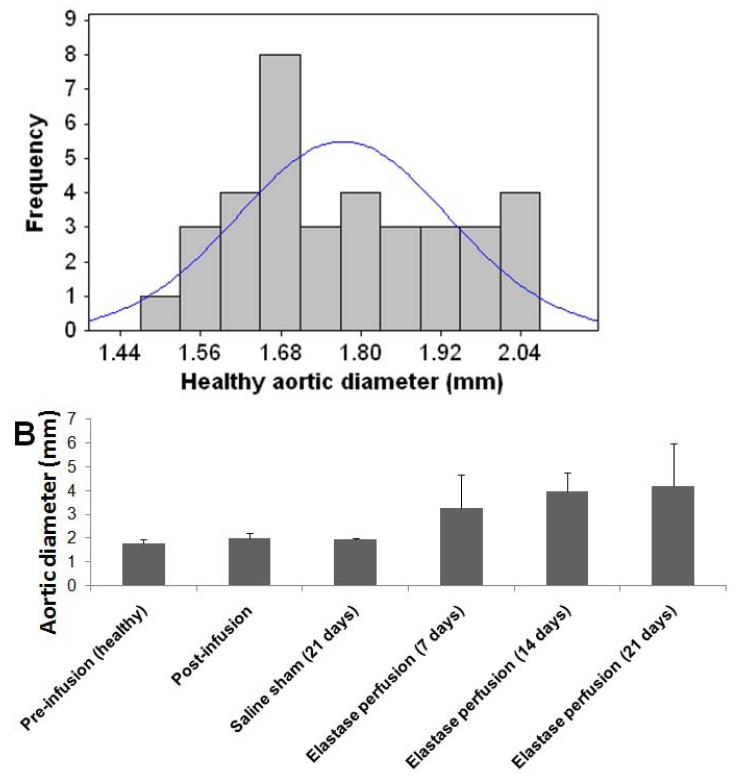
The average aortic diameter increased with progression of disease (Figure 1, Table 1), with the rate of expansion appearing to decrease in the 14 day – 21 day window as compared to the 7 day to 14 day window. On the contrary, diameter increase due to sham treatment (saline perfusion) was minimal.
Figure 1.
Outer diameter sizes of abdominal aortae in healthy rats shows near-normal distribution (A). Outer diameter of healthy rat abdominal aortic aortae (day 0; pre-perfusion) and that of rat AAAs, as measured in the region of maximal expansion and shown as a function of post-AAA induction time (B). % changes in diameter relative to healthy suprarenal aortal segments (healthy internal controls) are indicated in Table 1. Aortal expansion appeared slower between 14 and 21 days, than earlier, suggesting auto-stabilization of the AAA, perhaps via a compensatory matrix regenerative process.
Table 1.
Comparison of average diameter of healthy rat infra-renal aortae, with that of saline (sham)-perfused aortae and elastase-perfused aortae, at different time points in AAA growth. Also indicated are the mean ± SD of % change in diameter of the infrarenal aorta in each case (n = 3/case) relative to the healthy suprarenal aortal segment (internal healthy control).
| Aortic condition | Aortic diameter (mm) | Mean % increase |
|---|---|---|
| Pre-infusion (healthy) | 1.77 ± 0.16 | - |
| Post-infusion | 2.01 ± 0.20 | 13.6 ± 2.1 |
| Saline sham (21 days) | 1.94 ± 0.04 | 9.9 ± 2.0 |
| Elastase perfusion (7 days) | 3.25 ± 1.40 | 100 ± 51 |
| Elastase perfusion (14 days) | 3.97 ± 0.80 | 122 ± 36 |
| Elastase perfusion (21 days) | 4.20 ± 1.80 | 129 ± 80 |
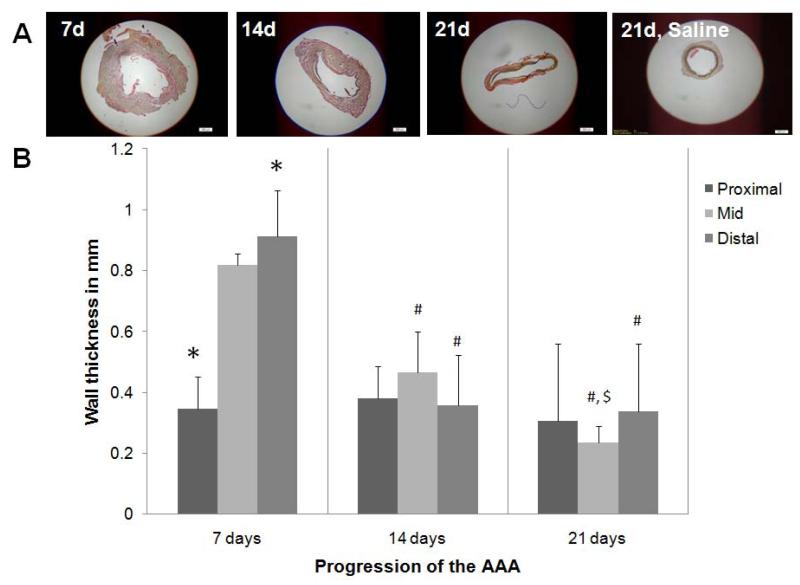
The average wall thickness of the healthy aorta was 0.15 ± 0.06 mm and that of saline treated sham aorta was 0.25 ± 0.06 mm. An increase in wall thickness was observed at 7 days (Figure 2) and was accompanied by visible disruption of the ECM, particularly elastic fibers. At 14 and 21 days, the wall thickness reduced consistently, possibly with increased ‘compaction’ of the aortic tissue as evident from histology. With disease progression, the wall thickness did not change much in the proximal regions of the AAA. Differently, wall thickness in the mid AAA region showed significant thinning with post-AAA induction time (Figure 2). The decrease in thickness was greatest within the 7- and 14-day time points.
Figure 2.
Change in wall thickness of abdominal aorta with AAA progression. Panel A shows low magnification (2×) images of Movat’s Pentachrome–stained AAA sections, sourced from the region of maximal AAA expansion. AAA wall thickness, quantified from images of the histological sections are shown in Panel B. The data shows an initial increase in wall thickness at 7 days post AAA induction, especially in the mid- and distal-regions, followed by a significant reduction in wall thickness, also in the same regions, at longer post-AAA induction periods. The wall thickness in the proximal region of the AAA remained unchanged with time. *, #, and $ represent significance of differences in diameters relative to the mid region, relative to the same region at 7 days, and relative to the same region at 14 days, respectively, deemed for p < 0.05. Analysis was based on n = 3 images/ region/time point, repeated 3 times. Scale bar is 500 μm. In comparison, the wall thickness of healthy aorta was 0.15 ± 0.06 μm and that of 21 day sham control aortae was 0.25 ± 0.06 μm.
3.2 Changes in ECM composition with progression of disease and location within AAAs
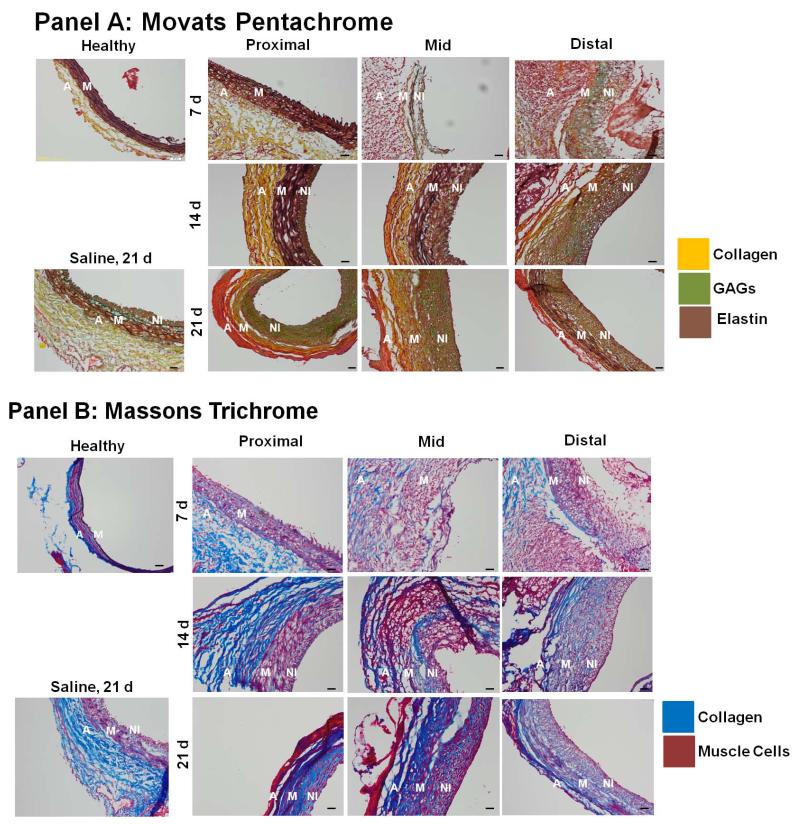
At 14 days post-AAA induction, histological staining with Masson’s Trichrome and Movat’s Pentachrome (Figure 3) showed that elastic matrix in the medial regions was disrupted early (< 7 days) and significantly in the mid and distal AAA regions, but not in the proximal region. In the proximal region, medial elastin loss was limited even at the 14-day time point. Substantial development of a neointimal layer was apparent, especially in the mid and distal AAA regions at the 14-day time point. This layer was observed to be augmented in thickness with time. Differently, in saline-treated sham aortae, neointima formation at 21 days was at most apparent as 2-3 cell thick layer. In the proximal region, neo-intima appearance was delayed (14 days), but again showed an increase in thickening by 21 days. Also to be noted in Figure 3, is that the neointimal matrix contained elastic matrix/elastin deposits (black to dark brown), though GAGs (green), collagen (yellow and blue) and muscle cells (dark pink) were also prominent.
Figure 3.
Histology indicates region- and time-specific differences in matrix disruption and remodeling within AAAs. Panel A shows sections 5 μm thick stained with Movat’s Pentachrome, which renders elastic matrix black to dark brown, collagen yellow, and GAGs green. Panel B shows results of Masson’s Trichrome staining of 5 μm thick sections, wherein collagen appears blue and muscle cells/fibers red. In general, staining outcomes suggest that disruption of medial elastin is limited and delayed in the proximal AAA regions versus the mid- and distal- sites (i.e., <14 d vs. <7 days respectively), and early and substantial neo-intimal remodeling occurs in the mid- and distal AAA regions which continues through day 21. Magnification: 20×. Scale bar is 50 μm. (Abbreviations used in the figure are: A for adventitia, M for media, NI for neointima)
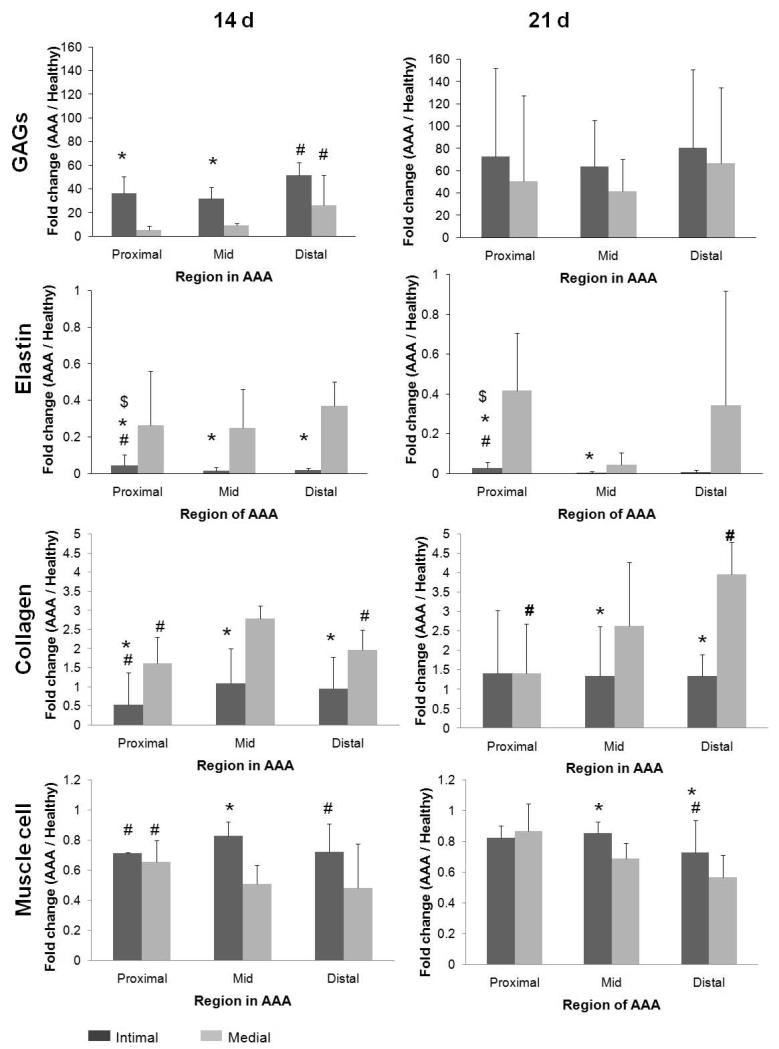
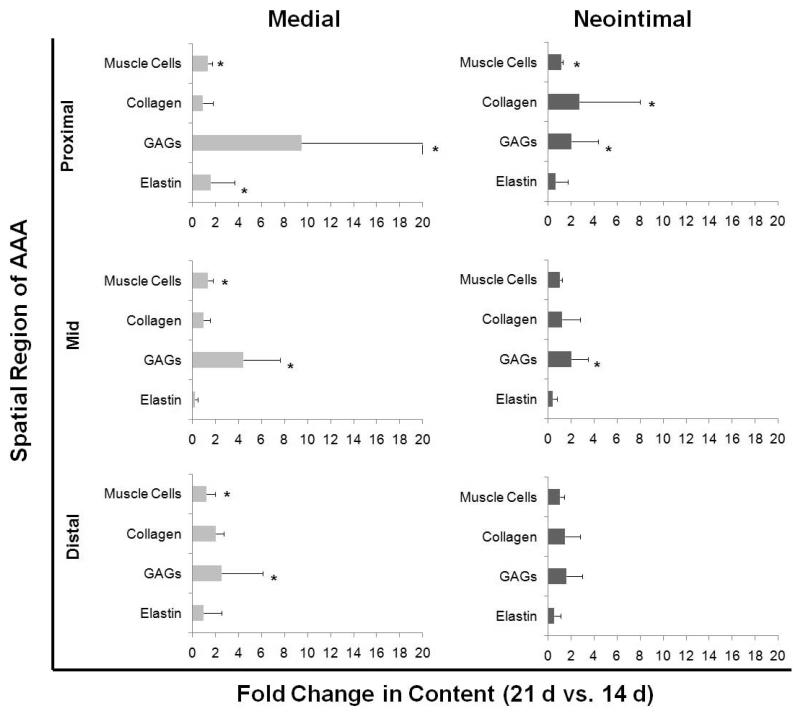
Figure 4 shows temporal changes in content of medial and neointimal matrix and cell components in the different AAA regions, normalized to the content of the same component and layer in the media of adjoining healthy AAA segments (i.e. the supra-renal aorta), as determined by image analysis. For all time points neointimal elastin content was consistently much lower than that in the medial layer of healthy aortal segments, and also lower than the AAA media in the corresponding AAA region at the same post AAA-induction time point. Neointimal elastin content was modestly but significantly greater in the proximal AAA region than in the mid and distal AAA regions at both 14 days and 21 days. In Figure 5, only the 14- and 21-day time points are compared since at the 7-day time point, the neointima was either non-existent, or too insignificant to be able to clearly demarcate from the media to allow for reliable analysis. Though elastin content in the medial layer of AAAs was significantly less than the medial layer of healthy aortal segments (as seen in Figure 4) at both the 14 and 21 day time points, no statistically significant, AAA region-specific quantitative differences were noted in the same. In the proximal region of the AAA tissue, a statistically significant increase in medial elastin content was observed at 21 days vs 14 days (Figure 5).
Figure 4.
Temporal changes in content of medial and neo-intimal matrix and cell components at proximal, mid-, and distal AAA sites, shown as fold changes versus content in media of adjoining healthy tissue segments. * and # represent statistical significance of differences compared to values for corresponding medial sections and mid region respectively, deemed for p<0.05, when analyzed using a non-parametric Mann-Whitney test. Analysis was based on n = 3 images/region/replicate animal/time point, each analyzed 5 times. While both GAG and collagen content in the media and neo-intima increased with AAA progression over healthy controls, the GAG content was in general higher in the neo-intima, and collagen content higher in the medial layer. Differently, relative to healthy aortal tissue, medial elastin within the AAA (all regions) was significantly diminished by 14 days post-AAA induction with even further loss observed at 21 days within the media of the mid AAA region. While elastin was generated in the neo-intima, levels remained low relative to medial elastin (both healthy and AAA), and were mostly unchanged between 14 and 21 days.
Figure 5.
Fold-increases in matrix and cell components in media and neo-intima of AAAs, between 14 and 21 days post induction. In all AAA regions, compared to other matrix and cell components, medial GAG content was found to show the greatest increases between the 14 and 21 time points; the increase was particularly dramatic in the proximal region. Over the same period, medial elastin showed decreases in the mid region and significant but yet modest increases in the proximal region. Within the neo-intima, collagen and GAG content again showed increases between 14 and 21 day time points, which was again the greatest in the proximal region. In the proximal and distal AAA sites, neo-intimal elastin content remained unchanged between 14 and 21 days post AAA induction, but showed a decrease in the mid region. * indicates significance of differences of 21 day samples vs. content in corresponding regions within 14-day AAAs, deemed for p< 0.5, using non-parametric Mann-Whitney statistical analysis. Analysis was based n = 3 images/region/replicate animal/time, each analyzed 5 times.
As seen in the histological images (Figure 3) and as quantified in Figure 4, GAG content (green) in the medial layer of the proximal and mid AAA regions where elastic matrix was still relatively intact, was minimal. At the same time point, the GAG content in the elastin-disrupted distal AAA media was significantly higher than the mid-region (p < 0.05) and several fold higher than that in the medial layer of the adjoining healthy aortal segment. Corresponding with continual medial elastin loss, increases in the medial GAG content in the respective AAA regions were observed at 21 days, with negation of the region-specific differences in medial GAG content that had been observed at 14 days. The greatest increases were seen in the proximal AAA region (Figure 5). Neointimal GAG content was in general higher than that in the AAA media in the corresponding AAA regions at specified post-induction times, although the differences were statistically significant (p < 0.05) only for the proximal and mid AAA regions at the 14 day time point (Figure 4). Again, at 14 days, neointimal GAG content was significantly higher in the distal region than in the mid and proximal regions. No region-specific differences in neointimal GAG content were observed at 21 days, similar to what was observed in the medial elastin in the AAAs. Neointimal GAG content appeared to be consistently higher in all AAA regions at 21 days relative to 14 days (Figure 5), though these differences were deemed statistically significant, only for the proximal and mid regions of the AAA.
At 14 days, the collagen content in the AAA media was modestly greater than in the media of the adjoining healthy aortic segment; collagen build-up was significantly higher in the mid AAA region compared to the proximal and distal regions (Figure 4). At 21 days however, only the distal AAA matrix showed further increase in collagen content over that at 14 days (Figure 5). Neointimal collagen at 14 days was close to levels estimated in the healthy aortic media at the same time point, in all 3 AAA regions, and significantly less than the levels of medial collagen in the same AAA region (Figure 4). A statistically significant increase in neointimal collagen content was observed between the 14 and 21-day time points, only at the proximal AAA site (Figure 5), , At 21 days, there were no differences between the ratios of collagen content in the AAA neontima to that in healthy medial layer, calculated for each of the spatial regions (Figure 4).
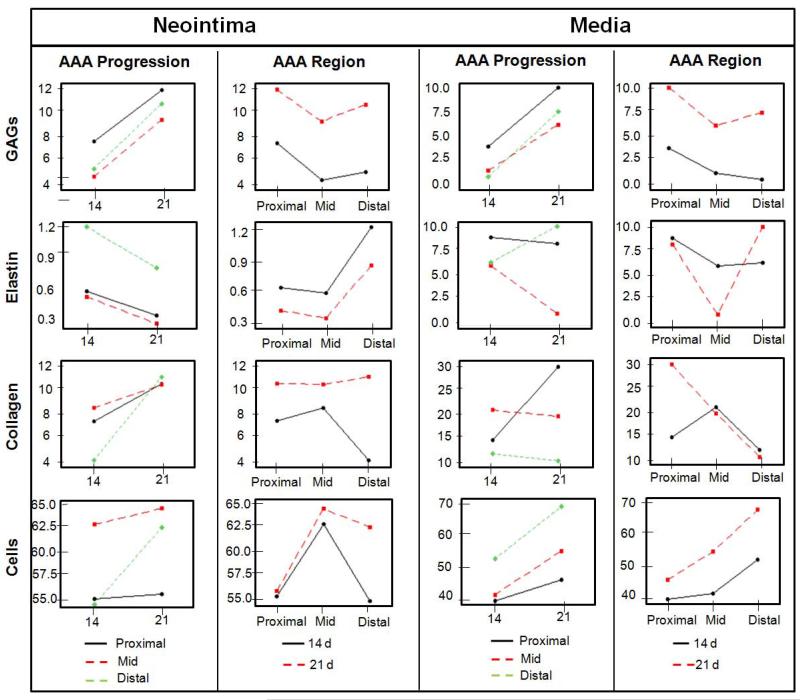
The area occupied by muscle cells in the AAA media was consistently lower than in the media of adjoining healthy aortal segments both at 14 and 21 days (Figure 4). In Figure 4, it is also apparent that (a) the difference between areas occupied by the presumably muscle (SMAA+) cells in the AAA neointima and in the healthy aortal media was the least in the mid AAA region, and (b) the area of the AAA medial layer occupied by the SMAA+ cells was the highest in the proximal region than in the mid- and distal regions, at both the 14- and 21-day time points. At both 14 and 21 days, the ratios of areas occupied by the SMAA+ cells in the AAA tissue to that in the healthy aortal media was also consistently higher in the AAA neointima than the AAA medial layer, in all AAA spatial regions, though these differences were statistically significant (p < 0.05) only for the mid-region (Figure 4). A very modest but statistically significant increase in muscle cell area was also observed in the media of all studied AAA regions, between 14 and 21 days (Figure 5). Figure 6 summarizes trends in changes to ECM and cell components with AAA progression time and across AAA spatial regions.
Figure 6.
Simplified illustration of trends showing how AAA progression and spatial regions each influence the prevalence of tissue components. The ‘Y’ axis indicates % area of the certain Field of View (FOV) occupied by each tissue component as determined by image pro based analysis of histological sections.
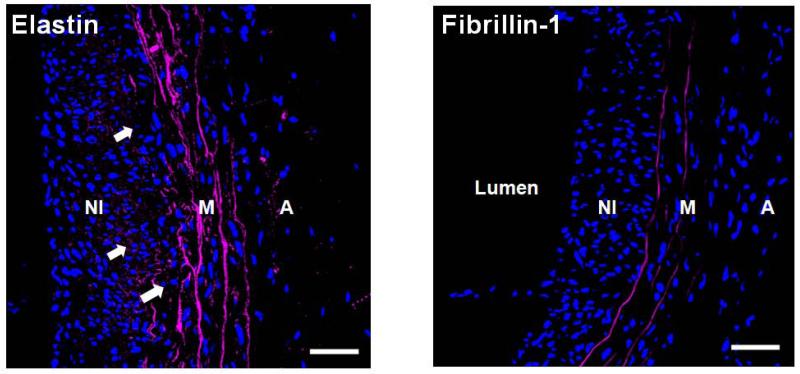
IF imaging of sections spanning the media and neointima of the AAAs confirmed the disruption of elastic lamellae in the media and elastic matrix in the neo-intima that appeared to be both amorphous and in places, organized into nascent fiber-like structures. Fibrillin-1 co-localized with elastin in medial fibers but was seen in sparsely seen in the neo-intima with no differences between 14 and 21 days (shown only at 21 days in Figure 7). TEM images (Figure 10B, Panels c-e) of 21-day AAAs, where the neo-intima was more consistently and better defined relative to that at 14 days, confirmed the presence of amorphous elastin deposits and nascent elastic fibers in the neointima. Collagen was abundant in the neointima as well (Figure 10B, Panel f). Microfibrillar structures were also observed but were not uniformly distributed in all observed regions of elastin deposition within the neo-intima (Figure 10B, Panel d). In many cases, neointimal cells were surrounded by copious amounts of ground substance resembling GAGs indicated in the histology images (Figure 10B, Panel b).
Figure 7.
Immunofluorescence imaging shows presence of elastin deposits (left panel; white arrows) but little fibrillin-1 (right panel) in the neointima (NI) of AAAs (shown mid-region of a 21 day AAA). Differently, strong fluorescence due to elastin and fibrillin-1 was associated with lamellae in the medial layer (M). Both elastic fiber components appear magenta and DAPI-stained nuclei appear blue. Magnification: 40×. The adventitial layer is labeled as ‘A’. Scale bars are 50 μm.
Figure 10.
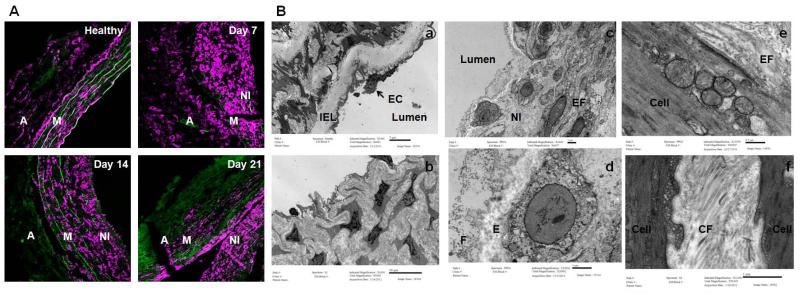
Panel A shows the confocal microscopic images showing presence of α-actin+ (in magenta) in the AAA neo-intima, in addition to the media and adventitia. Auto-fluorescence due to collagen and elastin appears green. Note that many of the α-actin+ cells in the neo-intima appear rounded relative to cells. Panel B shows TEM of healthy rat aortae and AAAs. Fig (a) shows internal elastic lamella of healthy rat aorta, with endothelial cells (ECs) lining the luminal surface. Fig (b) shows abundant matrix generated by cells in the neointima. As seen in Fig (c), at least two distinctly different sub-populations of cells, namely cells rich in vesicles indicating a synthetic phenotype, and more elongated cells rich in contractile fibers are seen in the neointima. Rounded appearance of the vesicle-rich cells may potentially also be due to their axial orientation along the direction of flow of blood unlike circumferentially aligned medial cells. See supplementary material (Fig-S1) for 3-dimensional reconstruction of confocal z-stacks indicating the cellular orientation. Fig (d) shows detail of the synthetic neo-intimal cells, with nascent elastin deposits (E) and dark staining fibrillin microfibrills in the periphery (F) suggesting ongoing fiber formation. Figs (e) and (f) show details of the some contractile neo-intimal cells. Note nascent elastic fiber (EF) being assembled (e) by the cell and the abundant deposition of collagen fibers (CF).
3.3 Characterization of nascent elastic fibers
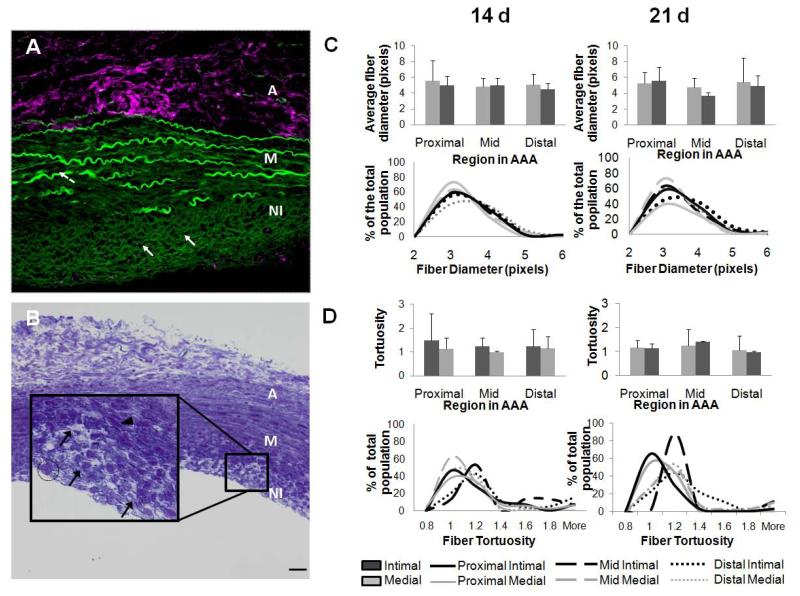
Toluidine blue staining (Figure 9B) confirmed the presence of fiber-like structures within the AAA neointima, which were also found to exhibit green auto-fluorescence (Figure 9A), visualized using a confocal microscope. The same green auto-fluorescence was also associated with elastic lamellar structures in the media, but not with the collagenous adventitia, strongly suggesting that they might represent elastin containing structures. These structures were far less bright compared to remnants of medial elastic lamellae, but much brighter than the scattered and weak green auto-fluorescence due to collagen in the adventitia. Morphometric analysis indicated no statistically significant differences (p < 0.05) in diameters of the ‘elastic fibers’ in the media and the neo-intima of AAA tissue (Figure 9C). Fiber diameters ranged between 1 and 1.4 microns. At 14 days, the media of proximal AAA regions had the highest fiber count in that range, while at 21 days this region had fewest fiber counts with the highest fiber count transitioning to the media of the mid AAA region. However, none of the observed differences in fiber counts between regions were deemed statistically significant (Figure 9D, lower panel). Differences in the tortuosity of fibers were not statistically significant either. At 14 days post AAA induction, the fiber tortuosities were somewhat uniformly distributed between ranges of 1 and 1.2. However at 21 days, there was a shift towards more tortuous fibers with nearly 80% of elastic fibers in the neointima of the mid region exhibiting a tortuosity of ~ 1.2.
Figure 9.
Neo-intima within AAAs contain fibrous structures. Panel A shows a confocal overlay of image a 5 micron-thick section made in the XYZ region of rat AAA tissue at 21 days post-induction. Green represents autofluorescence of elastin as seen in the media and as fiber like structures formed in the neo-intima. The confocal microscope settings were set to eliminate most auto-fluorescence due to collagen (note the minimal green autofluorescence due to collagen in the adventitia, which however contains abundant hyaluronan or HA, which was immunolabeled for and appears magenta). Panel B shows Toludine blue staining of 21 day AAA tissue. Magnified inset image of the neo-intimal region (100×) shows fibers (black solid arrow). Note the difference in cell phenotypes, elongated cells in the media (arrow-head) and more circular endotheloid cells in the neo-intima (encircled). Scale bars in panels A and B: 50 μm. Panel C shows a histogram of Fiber diameters in the AAA media and neo-intima. Panel D shows the distribution of fiber tortuosity values in the media and neo-intima. Analysis was based on fibers identified using custom-made image processing algorithms in n = 3 image/region/replicate animal/time point.
3.4 Micro-structural order in medial and neo-intimal matrix
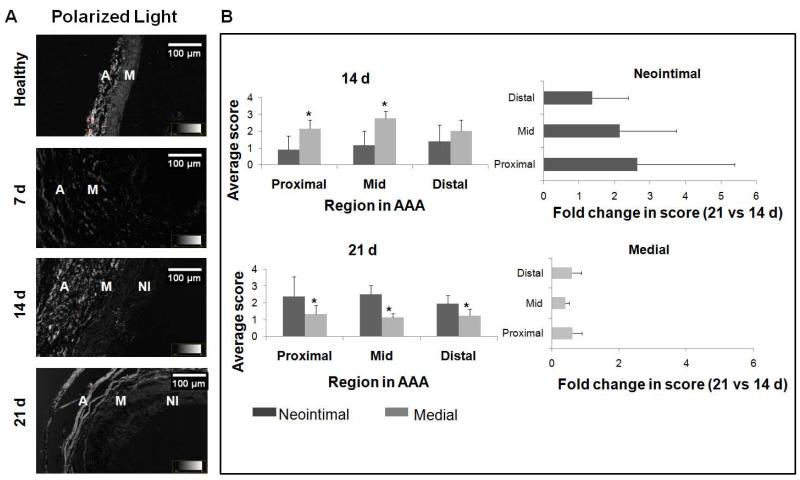
The optical retardance of circularly-polarized light in different AAA tissue regions was assessed from the observed degree of brightness, a measure of micro-level order in the matrix, and scored using an ordinal scale. Retardance of the medial layer was consistently less than the collagen-rich adventitia, and showed decreases with progression of the AAA while that of the neointima showed an apparent increase (21 days vs. 14 days), though no differences were noted between different spatial regions within the AAA (Figure 8).
Figure 8.
Semi-quantitative assessment of medial and neo-intimal matrix within AAA tissue (B) as determined from polarized light micrographs (A). The optical retardance of circularly polarized light in different AAA tissue regions was assessed from the observed degree of brightness, a measure of micro-level order in the matrix, and scored using an ordinal scale. The scale, spanning scores of 0-5, rates the extent to which matrix organization resembles that of adventitial collagen (score of 5) versus the dark luminal region where there is not tissue (score of 0). Retardance of the medial layer was consistently less than the collagen-rich adventitia, and showed decreases with progression of the AAA (21 d vs. 14 d), though no differences were noted between different spatial regions within the AAA. In the neo-intima, retardance to polarized light was significantly higher at 21 d than at 14 d, and not different across the different AAA spatial regions. In panel B, * indicates difference in ordinal score relative to values assigned to the medial layer, and deemed for p< 0.05. Non parametric test of significance in difference was based on n = 3 images/region/animal/time point.
3.5 Cell phenotype
IF images of AAA aortic sections (Figure 10A) showed the presence of smooth muscle alpha actin positive (SMAA+) cells in both the AAA media and the neointima. By 21 days post-AAA induction, there was a significant decrease in SMAA+ cells in the media and an increased incidence of SMAA+ cells in the neointima (Figure 10A). To be mentioned, SMAA+ cells in the neointima appeared to be of rounded morphology when visualized in 2-D, compared to those in the media which were elongated. Confocal microscopy assisted 3-D reconstruction of nuclei in the neointima (Supplementary figure 1), however, showed them to be so, because of their orientation along the axis of blood flow in the aorta, which make them appear rounded in AAA cross-sections. TEM images (Figure 10B) indicate the presence of a mix of cellular phenotypes in the neointima. While neointimal cells at the medial interface exhibited intra-cellular contractile fibers and clear intracellular zones with secretory vacuoles, the cells closer to the lumen appeared spherical with noticeable absence of intra-cellular contractile apparatus, and a significantly greater presence of intra-cellular vesicles. As mentioned earlier in section 3.2, these cells were seen to be surrounded by amorphous elastin (Figure 10B, Panel d). Also present in the neo-intima were cells with no apparent secretory or contractile apparatus (Figure 10B, Panel b).
4. Discussion
Contrary to earlier understanding, it is now recognized that the ratio of peak wall stress to wall strength is a better and more reliable indicator of AAA rupture than the maximal AAA diameter (Doyle et al. 2010, Fillinger et al. 2002, Fillinger et al. 2003, Maier et al. 2010). Predictive computational modeling of aortic wall stress has been previously performed using finite element analysis (Venkatasubramaniam et al. 2004), to estimate the distribution of wall stress and hence rupture risk in AAAs. Although recent studies have looked into the effect of wall thickness on AAA rupture risk (Raghavan et al. 2004), the majority of the existing knowledge is based on an underlying assumption of negligible effect of variation in wall thickness on AAA rupture risk (Fillinger et al. 2002), which may be simplistic. Similarly, knowledge of the regional ECM compositional profile within AAA tissues and its temporal changes may be utilized to predict spatial differences in AAA wall mechanics as a function of extent of disease progression, which can in turn help in generating more realistic models to predict rupture risk. Motivated by such possibilities, in this study, we have mapped changes in composition of the tissue microenvironment within experimentally induced AAAs. Our study is also motivated from the standpoint of developing in-situ matrix regenerative therapies for AAA growth deceleration, arrest or even possible regression to a healthy state. At this time, no such non-surgical therapies for AAAs are available that may be applied during the extended period of slow AAA growth leading to rupture. Also there is little information available as to the spatial and temporal sequence of matrix degenerative changes within AAAs and the extent and nature of auto-regenerative repair, if any. While enzymatic breakdown of the aortal elastic matrix is known to drive AAA growth (Pearce et al. 2006) the poor of structural recovery of the AAA tissues has been owed to the lack of regenerative repair of the elastic matrix owing to poor elastogenicity of adult SMCs (Patel et al. 2006). That said, there has not been any systematic investigation of naturally-occurring cell-mediated elastic matrix repair process within AAAs. In elucidating this aspect, this study provides evidence of new elastic matrix deposition within AAAs, insights into the cell types involved, and identifies specific irregularities or deficiencies of new elastic matrix at the site of AAA remodeling. This can guide in situ therapeutic strategies directed at improving elastic matrix assembly towards reinstatement of completely biological and structurally functional elastic matrix structures at specific AAA sites and at specific stages during progression of the disease. In this study, the extents and patterns of increase in outer vessel diameter (at the site of maximal expansion), post-AAA induction, were consistent with observations in our previous published work (Gacchina et al. 2011). The rate of diameter increase diminished with progression of the disease between the initial 7 days and the following 7 to 14 day and 14 to 21 day periods, suggesting a stabilization phenomenon due to compensatory positive tissue remodeling. This could be due to aortic wall stiffening owing to a progressive increase in cellular collagen deposition, which occurs in parallel with medial elastic matrix degeneration. This compensatory positive tissue remodeling occurs in response to enhanced wall stress perceived by the vascular cells following wall thinning due to ECM (i.e., both collagen and elastin) breakdown. Compared to healthy aortae, the wall thickness within elastase-infused aortae initially showed a massive increase by day 7, specifically in the mid and distal regions. The relatively greater levels of wall thickening in these regions compared to the proximal AAA region may be linked to response of SMCs to higher levels of wall shear stress (Papaioannou et al. 2005, Finol et al. 2002) intrinsically encountered at in the distal aorta. The subsequent decrease in wall thickness that was seen to occur with AAA disease progression suggested either a matrix ‘compaction’ event or enhanced matrix degradation as visualized by histological staining (Figures 2A and 3). The compaction of the AAA wall was again maximal in the mid region followed by the distal region, with minimal change occurring in the proximal region. Quite possibly, higher perceived stress levels and a more-dense collagenous microenvironment in the former two AAA regions could have coaxed resident SMCs to a more contractile phenotype (Rensen et al. 2007), facilitating their greater compaction of collagen matrix structures.
The brightfield images of histological sections clarified the sequence of events involved in remodeling of the AAA tissue. By 7 days after elastase-induced aortal tissue injury, we expect an acute inflammatory response. Dynamic compression of tissue, which increases following initial disruption of the structural ECM of the aorta, is known to enhance cellular GAG synthesis (Murata et al. 1988) and tissue volume. As seen in the Movat’s Pentachrome-stained sections in Figure 3, at the 7- and 14-day time points, we observed GAG buildup consistent with an inflammatory response (Cripps et al. 2005), and a much greater GAG content (green) in the distal and mid-AAA regions relative to the proximal region. The intrinsically higher hemodynamic stresses encountered in the mid and distal regions coupled with the greater stress-induced structural damage occurring after initial elastase-induced tissue damage, in those locations, could have triggered the enhanced GAG buildup relative to the proximal region. GAGs continued to be strongly retained in the neointima, and less so the media of AAA tissues, relative to healthy aortic tissue, at both the 14- and 21-day time points. This suggests a sustained wound healing response associated with continued matrix disruption in the media at these time points, and continuing nascence of the neointimal ECM despite its increasing stiffness and structural definition with organization of fibrous ECM within. The continued presence of proteoglycans and GAGs in the neointima at the later time points, when fiber like structures are increasingly detected, may also be relevant to elastic fiber assembly and extension, processes, which they have been shown to facilitate (Wu et al. 1999).
Our histological images indicated progressive medial elastin loss in the 21-day period following elastase-inflicted aortal injury. Following initial tissue injury, MMPs are over-expressed at the site, by resident cells and recruited inflammatory cells (Gacchina et al. 2011). These enzymes cause breakdown and loss of medial elastin. Results published by other groups (Sheth et al. 2010) and unpublished data acquired our own lab (Supplementary Figure 2) using MMP-Sense technology have shown that MMP activity is the highest in the maximally-expanded (here, mid) and distal regions of AAAs. This might account for the relatively limited loss of elastin in the proximal region compared to the mid- AAA region (Figure 4). As mentioned earlier, distal AAA tissues typically experience higher hemodynamic stress (DiMusto et al.) and medial SMCs under enhanced wall shear have been shown to increase production of elastin (Chiquet et al. 1996). This could explain why, despite exhibiting relatively higher levels of elastic matrix breakdown, net increases in elastin levels in the distal AAA regions in the14-21 day time period, are higher relative to the mid-AAA region (Figure 5).
The net temporal decreases in medial elastin, indicated by histology imaging, suggest a lack of efficient, if any, regenerative elastic matrix repair in the media. However, a surprising finding was the accumulation of new matrix structures in the neointima (Figure 9, panel A and B), which we confirmed via histology, IF imaging, polarized light microscopy and TEM to contain elastin. The neointima was distinguishable as a layer separate from the media, only when observed at 14 days and beyond, and was thus analyzed only at those time points. In all AAA regions, the content of neointimal elastin (normalized to medial elastin content in healthy aortae), which represents newly deposited elastin, appeared to be substantially higher than the corresponding content of medial elastin, though the differences were finally deemed statistically insignificant. Changes to optical retardance of AAA tissue observed in polarized light micrographs (Figure 8) suggested the (a) gradual loss of ordered matrix structures in the media between the 14-day and 21-day time points, likely due to elastic matrix disruption, and (b) concurrent buildup of diffusely-ordered matrix structures, in the neointima which could represent either or both elastin and collagen. However, significant green auto-fluorescence of the fiber-like structures in the neointima (Figure 9) was observed when imaged by a confocal microscope under conditions that eliminated adventitial collagen autofluorescence, strongly suggesting their identity as elastic fibers. Though elastic lamellae in the healthy aortic media exhibited similar autofluorescence, the signal was significantly stronger. This suggests the presence of elastin protein-associated matrix structures in the neointima, which are yet not mature elastic fibers. Toluidine blue staining of the neointimal tissue confirmed the presence of fiber-like structures. Toluidine blue typically stains ECM components like GAGs, which are associated with elastic fibers, since they help with fiber extension via coacervation of tropoelastin precursors for their further crosslinking. That said, toluidine blue is not specific to elastic fibers and is known to stain collagen bundles as well. However, in our case, we observed the toluidine blue-stained fiber-like structures in the neointima to resemble those which exhibited green autofluorescence due to elastin (Figure 9), which in turn was similar to IF labeled for elastin. Thus it is reasonable to deduce that a significant number, if not all, of fiber-like structures in the neointima contain some amount of elastin. Despite apparently plentiful elastin deposits in the neointima and presence of fiber-like elastic matrix structures, fibrillin-1, the glycoprotein that is an important constituent of microfibrils which serve as pre-scaffolds for crosslinking and organization of amorphous elastin into mature fibers, was very sparsely detected in the neointima (Figure 7A). Differently, fibrillin-1 co-localized with elastic matrix structures in the medial layer (Figure 7B). The overwhelming lack of association of fibrillin-1 with neointimal elastin deposits suggests aberrant elastic fiber assembly, which in a best case scenario might result in formation of nascent fiber-like structures. Substantiating this, TEM images (Figure 10, panels c-e) showed presence of large and frequently elongated deposits of amorphous elastin in the neointima, but no mature elastic fibers, which might represent outcomes of frustrated attempts at elastic fiber formation. The presence of nascent elastic structures can be attributed to the GAGs mentioned earlier as seen in histology. GAGs form substrates that can potentially aid in tropoelastin coacervation and assembly (Wu et al. 1999). The ability of neointimal cells to generate elastin in a manner not achievable by medial SMCs could potentially be due to (a) difference in phenotype from adult smooth muscle cells and/or (b) direct and enhanced perception of hemodynamic flow shear. Neointimal cells have been reported to express embryonic genes and a developmental phenotype expressing at high levels, genes typically involved in fetal development (Kim et al. 1994), along with collagen (Geary et al. 2002) and tropoelastin (Majesky et al. 1992). This may account for the ability of neointimal cells to maintain high levels of tropoelastin synthesis, unlike adult cell types (Sephel et al. 1986) including medial SMCs, which exhibit progressively diminished elastogenic capacity with aging. TEM images showed two distinguishable sub-populations of cells in the neointima, circumferentially-oriented and elongated cells rich in contractile fibers that interfaced with the medial layer and cells characterized by a large number of vesicles indicating a secretory phenotype, localized close to the lumen. The latter cells were also found to be associated with nascent fibrous structures in the neointima, as mentioned earlier. Although these cells appeared to be rounded in tissue-sections used for TEM, 3-D reconstruction performed on confocal micrographs of DAPI-stained longitudinal tissue sections (20-μm thick) showed oval nuclei along the lumen, oriented parallel to the axis of the blood vessel (Supplementary Fig 2). The axial orientation of the near-luminal neointimal cells suggests that they are more directly influenced by hemodynamic shear, and are likely to be behaviorally modulated by the same. The substantial production of elastin and elastic fiber-like structures that we observed in the AAA neointima, which is not observed anywhere else within AAA tissues, including in the tunica media, provides us a unique opportunity to capitalize on this auto-regenerative phenomenon and direct it from the standpoint of matrix organization towards restoring healthy aortic matrix structure, mechanics, and biological function. Further work needs to be done to isolate and culture these secretory neointimal cells, characterize them, and study their elastogenic potential under physiologically relevant culture conditions, when exposed to elastogenic factors identified earlier by our lab (Gacchina et al. 2011, Joddar et al. 2006, Kothapalli et al. 2010, Kothapalli et. al 2009)
5. Conclusions
This study, for the first time, chronicles the temporal site-specific changes in ECM composition within AAA tissues in an induced rat AAA model and presents evidence of neointimal AAA remodeling characterized by abundant generation of nascent elastin-containing fibers. We have shown that this remodeling is effected by SMAA+ neointimal cells which however, appear to phenotypically differ from medial SMCs, and are likely of different origin, possibly, being derived from circulating progenitors, as peripheral studies on neointima have suggested (Tanaka et al. 2008, Daniel et al. 2010). Detailed phenotypic analysis of these cells involved in neointimal remodeling and an investigation into their origin will be investigated in a subsequent manuscript. Interestingly, despite demonstrating significant generation of nascent elastic fibers in the neointima, the study also showed them to be aberrant in terms of being deficient in at least one critical microfibrillar component, fibrillin-1, which is important to mature elastic fiber assembly. Future studies will focus on characterizing these nascent elastic fibers in greater depth to identify other possible defects, aberrations of elastic fiber assembly, and seek to develop therapies to overcome or circumvent the limitations of this auto-regenerative phenomenon within AAAs and direct it from the standpoint of matrix organization towards restoring healthy aortic matrix structure, mechanics, and biological function.
Supplementary Material
Supplementary Figure 1: 3-D reconstruction of confocal microscopy images of AAA vessel sections. Note the orientation of the nuclei in the neointimal region. The red arrow indicates aortic axis.
Supplementary Figure 2: Representative image of a AAA tissue labeled with MMP-Sense 680 imaging agent gets cleaved by MMPs thereby producing infra-red signal proportional to MMP activity. The images were taken using a Xenogen-IVIS imaging system. Red indicates highest MMP activity while green shows the least. This shows the MMP activity to be highest in the mid and distal regions of the AAA.
Acknowledgments
This study was supported by NIH Grants: National Heart, Lung, and Blood Institute (R01HL 092051) Grant Awarded to Ramamurthi A.
Footnotes
Conflicts of Interest: No conflicts of interest exist
References
- Campbell GR, Campbell JH. Smooth muscle phenotypic changes in arterial wall homeostasis: Implications for the pathogenesis of atherosclerosis. Experimental and molecular pathology. 1985;42(no. 2):139–162. doi: 10.1016/0014-4800(85)90023-1. [DOI] [PubMed] [Google Scholar]
- Chiquet M, Matthisson M, Koch M, Tannheimer M, Chiquet-Ehrismann R. Regulation of extracellular matrix synthesis by mechanical stress. Biochemistry and cell biology = Biochimie et biologie cellulaire. 1996;74(no. 6):737–744. doi: 10.1139/o96-080. [DOI] [PubMed] [Google Scholar]
- Cripps JG, Crespo FA, Romanovskis P, Spatola AF, Fernández-Botrán R. Modulation of acute inflammation by targeting glycosaminoglycan–cytokine interactions. International immunopharmacology. 2005;5(no. 11):1622–1632. doi: 10.1016/j.intimp.2005.04.010. [DOI] [PubMed] [Google Scholar]
- Daniel J, Bielenberg W, Stieger P, Weinert S, Tillmanns H, Sedding DG. Time-Course Analysis on the Differentiation of Bone Marrow-Derived Progenitor Cells Into Smooth Muscle Cells During Neointima Formation. Arteriosclerosis, Thrombosis, and Vascular Biology. 2010;30(no. 10):1890–1896. doi: 10.1161/ATVBAHA.110.209692. [DOI] [PubMed] [Google Scholar]
- DiMusto PD, Upchurch GR. The Pathogenesis of Abdominal Aortic Aneurysms. Available: https://www.vascularweb.org/research/Pages/the-pathogenesis-of-abdominal-aorticaneurysms.aspx.
- Doyle BJ, Cloonan AJ, Walsh MT, Vorp DA, McGloughlin TM. Identification of rupture locations in patient-specific abdominal aortic aneurysms using experimental and computational techniques. Journal of Biomechanics. 2010;43(no. 7):1408–1416. doi: 10.1016/j.jbiomech.2009.09.057. [DOI] [PMC free article] [PubMed] [Google Scholar]
- Fillinger MF, Marra SP, Raghavan ML, Kennedy FE. Prediction of rupture risk in abdominal aortic aneurysm during observation: Wall stress versus diameter. Journal of Vascular Surgery. 2003;37(no. 4):724–732. doi: 10.1067/mva.2003.213. [DOI] [PubMed] [Google Scholar]
- Fillinger MF, Raghavan ML, Marra SP, Cronenwett JL, Kennedy FE. In vivo analysis of mechanical wall stress and abdominal aortic aneurysm rupture risk. Journal of Vascular Surgery. 2002;36(no. 3):589–597. doi: 10.1067/mva.2002.125478. [DOI] [PubMed] [Google Scholar]
- Finol EA, Amon CH. Flow-induced wall shear stress in abdominal aortic aneurysms: Part II--pulsatile flow hemodynamics. Computer methods in biomechanics and biomedical engineering. 2002;5(no. 4):319–328. doi: 10.1080/1025584021000009751. [DOI] [PubMed] [Google Scholar]
- Gacchina CE, Deb P, Barth JL, Ramamurthi A. Elastogenic Inductability of Smooth Muscle Cells from a Rat Model of Late Stage Abdominal Aortic Aneurysms. Tissue Engineering Part A. 2011;17(no. 13-14):1699–1711. doi: 10.1089/ten.tea.2010.0526. [DOI] [PMC free article] [PubMed] [Google Scholar]
- Geary RL, Wong JM, Rossini A, Schwartz SM, Adams LD. Expression Profiling Identifies 147 Genes Contributing to a Unique Primate Neointimal Smooth Muscle Cell Phenotype. Arteriosclerosis, Thrombosis, and Vascular Biology. 2002;22(no. 12):2010–2016. doi: 10.1161/01.atv.0000038147.93527.35. [DOI] [PubMed] [Google Scholar]
- Joddar B, Ramamurthi A. Elastogenic effects of exogenous hyaluronan oligosaccharides on vascular smooth muscle cells. Biomaterials. 2006;27(no. 33):5698–5707. doi: 10.1016/j.biomaterials.2006.07.020. [DOI] [PubMed] [Google Scholar]
- Kim DK, Zhang L, Dzau VJ, Pratt RE. H19, a developmentally regulated gene, is reexpressed in rat vascular smooth muscle cells after injury. The Journal of clinical investigation. 1994;93(no. 1):355–360. doi: 10.1172/JCI116967. [DOI] [PMC free article] [PubMed] [Google Scholar]
- Kothapalli CR, Ramamurthi A. Induced elastin regeneration by chronically activated smooth muscle cells for targeted aneurysm repair. Acta biomaterialia. 2010;6(no. 1):170–178. doi: 10.1016/j.actbio.2009.06.006. [DOI] [PMC free article] [PubMed] [Google Scholar]
- Kothapalli CR, Ramamurthi A. Biomimetic regeneration of elastin matrices using hyaluronan and copper ion cues. Tissue engineering.Part A. 2009;15(no. 1):103–113. doi: 10.1089/ten.tea.2007.0390. [DOI] [PMC free article] [PubMed] [Google Scholar]
- Maier A, Gee M, Reeps C, Pongratz J, Eckstein H-, Wall W. A Comparison of Diameter, Wall Stress, and Rupture Potential Index for Abdominal Aortic Aneurysm Rupture Risk Prediction. Annals of Biomedical Engineering. 2010;38(no. 10):3124–3134. doi: 10.1007/s10439-010-0067-6. [DOI] [PubMed] [Google Scholar]
- Majesky MW, Giachelli CM, Reidy MA, Schwartz SM. Rat carotid neointimal smooth muscle cells reexpress a developmentally regulated mRNA phenotype during repair of arterial injury. Circulation research. 1992;71(no. 4):759–768. doi: 10.1161/01.res.71.4.759. [DOI] [PubMed] [Google Scholar]
- Murata K, Yokoyama Y. High hyaluronic acid and low dermatan sulfate contents in human pulmonary arteries compared to in the aorta. Blood vessels. 1988;25(no. 1):1–11. doi: 10.1159/000158716. [DOI] [PubMed] [Google Scholar]
- Papaioannou TG, Stefanadis C. Vascular wall shear stress: basic principles and methods. Hellenic journal of cardiology : HJC = Hellenike kardiologike epitheorese. 2005;46(no. 1):9–15. [PubMed] [Google Scholar]
- Patel A, Fine B, Sandig M, Mequanint K. Elastin biosynthesis: The missing link in tissue-engineered blood vessels. Cardiovascular research. 2006;71(no. 1):40–49. doi: 10.1016/j.cardiores.2006.02.021. [DOI] [PubMed] [Google Scholar]
- PEARCE WH, SHIVELY VP. Abdominal Aortic Aneurysm as a Complex Multifactorial Disease. Annals of the New York Academy of Sciences. 2006;1085(no. 1):117–132. doi: 10.1196/annals.1383.025. [DOI] [PubMed] [Google Scholar]
- Raghavan M, Kratzberg J, da Silva ES. Heterogeneous, Variable Wall-Thickness Modeling of a Ruptured Abdominal Aortic Aneurysm. ASME Conference Proceedings. 2004;2004(no. 47039):271–272. [Google Scholar]
- Raymond J, Venne D, Allas S, Roy D, Oliva VL, Denbow N, Salazkin I, Leclerc G. Healing mechanisms in experimental aneurysms. I. Vascular smooth muscle cells and neointima formation. Journal of neuroradiology.Journal de neuroradiologie. 1999;26(no. 1):7–20. [PubMed] [Google Scholar]
- Rensen SS, Doevendans PA, van Eys GJ. Regulation and characteristics of vascular smooth muscle cell phenotypic diversity. Netherlands heart journal : monthly journal of the Netherlands Society of Cardiology and the Netherlands Heart Foundation. 2007;15(no. 3):100–108. doi: 10.1007/BF03085963. [DOI] [PMC free article] [PubMed] [Google Scholar]
- Sephel GC, Davidson JM. Elastin production in human skin fibroblast cultures and its decline with age. The Journal of investigative dermatology. 1986;86(no. 3):279–285. doi: 10.1111/1523-1747.ep12285424. [DOI] [PubMed] [Google Scholar]
- Sheth RA, Maricevich M, Mahmood U. In vivo optical molecular imaging of matrix metalloproteinase activity in abdominal aortic aneurysms correlates with treatment effects on growth rate. Atherosclerosis. 2010;212(no. 1):181–187. doi: 10.1016/j.atherosclerosis.2010.05.012. [DOI] [PMC free article] [PubMed] [Google Scholar]
- Tanaka K, Sata M, Natori T, Kim-Kaneyama J, Nose K, Shibanuma M, Hirata Y, Nagai R. Circulating progenitor cells contribute to neointimal formation in nonirradiated chimeric mice. The FASEB Journal. 2008;22(no. 2):428–436. doi: 10.1096/fj.06-6884com. [DOI] [PubMed] [Google Scholar]
- Tiedemann K, Bätge B, Müller PK, Reinhardt DP. Interactions of Fibrillin-1 with Heparin/Heparan Sulfate, Implications for Microfibrillar Assembly. Journal of Biological Chemistry. 2001;276(no. 38):36035–36042. doi: 10.1074/jbc.M104985200. [DOI] [PubMed] [Google Scholar]
- Tsui JC. Experimental models of abdominal aortic aneurysms. The open cardiovascular medicine journal. 2010;4:221–230. doi: 10.2174/1874192401004010221. [DOI] [PMC free article] [PubMed] [Google Scholar]
- Venkatasubramaniam AK, Fagan MJ, Mehta T, Mylankal KJ, Ray B, Kuhan G, Chetter IC, McCollum PT. A Comparative Study of Aortic Wall Stress Using Finite Element Analysis for Ruptured and Non-ruptured Abdominal Aortic Aneurysms. European Journal of Vascular and Endovascular Surgery. 2004;28(no. 2):168–176. doi: 10.1016/j.ejvs.2004.03.029. [DOI] [PubMed] [Google Scholar]
- Vorp DA, Raghavan ML, Webster MW. Mechanical wall stress in abdominal aortic aneurysm: Influence of diameter and asymmetry. Journal of Vascular Surgery. 1998;27(no. 4):632–639. doi: 10.1016/s0741-5214(98)70227-7. [DOI] [PubMed] [Google Scholar]
- Walker TG, Kalva SP, Yeddula K, Wicky S, Kundu S, Drescher P, d’Othee BJ, Rose SC, Cardella JF. Clinical Practice Guidelines for Endovascular Abdominal Aortic Aneurysm Repair: Written by the Standards of Practice Committee for the Society of Interventional Radiology and Endorsed by the Cardiovascular and Interventional Radiological Society of Europe and the Canadian Interventional Radiology Association. Journal of Vascular and Interventional Radiology. 2010;21(no. 11):1632–1655. doi: 10.1016/j.jvir.2010.07.008. [DOI] [PubMed] [Google Scholar]
- Wu WJ, Vrhovski B, Weiss AS. Glycosaminoglycans Mediate the Coacervation of Human Tropoelastin through Dominant Charge Interactions Involving Lysine Side Chains. Journal of Biological Chemistry. 1999;274(no. 31):21719–21724. doi: 10.1074/jbc.274.31.21719. [DOI] [PubMed] [Google Scholar]
Associated Data
This section collects any data citations, data availability statements, or supplementary materials included in this article.
Supplementary Materials
Supplementary Figure 1: 3-D reconstruction of confocal microscopy images of AAA vessel sections. Note the orientation of the nuclei in the neointimal region. The red arrow indicates aortic axis.
Supplementary Figure 2: Representative image of a AAA tissue labeled with MMP-Sense 680 imaging agent gets cleaved by MMPs thereby producing infra-red signal proportional to MMP activity. The images were taken using a Xenogen-IVIS imaging system. Red indicates highest MMP activity while green shows the least. This shows the MMP activity to be highest in the mid and distal regions of the AAA.


