

Abstract
Ovarian cancer is often diagnosed in late stages with few treatment options and poor long-term prognosis. New clinical tools for early detection of ovarian malignancies will significantly help reduce mortality and improve current long-term survival rates. The objective of this work was to identify ovarian tumor-specific single-stranded DNA aptamers that bind to malignant ovarian tumor cells and internalize with high affinity and specificity. Aptamers can identify unique tumor biomarkers, can aid in early detection and diagnosis of neoplastic disorders, and can be functionalized by conjugation to small molecules. To identify aptamers from random single-stranded DNA pools (60 bases long), we used whole Cell-SELEX (systematic evolution of ligands by exponential enrichment) to enrich and isolate tumor-specific aptamers that bind to tumor-specific receptors in their native state on the cell surface. Next-Generation sequencing identified seven novel aptamers and detailed analyses of three are described. Aptamers bound to, and were internalized by, target Caov-3 cell populations, but not nontarget nonmalignant ovarian epithelial HOSE 6-3 cells or multiple other epithelial tumor cell lines. Furthermore, aptamers showed unique binding affinities with apparent dissociation constants (Kd) measuring in the submicromolar range supporting their physiological relevance and potential use in clinical applications.
Introduction
Epithelial ovarian cancer (EOC) is one of the most common and highly malignant diseases affecting women. In 2014, almost 22,000 new cases of EOC were diagnosed, with over 14,000 EOC-related deaths in the Unites States alone [1]. Since the majority of EOC are diagnosed at stage II or later, there are fewer treatment options for patients and poor long-term prognosis with a 5-year mean survival rate of 44%. Moreover, the relative survival rate decreases to 27% when EOC is diagnosed at stage III, which constitutes almost 62% of all new cases each year [1]. Current treatment regimens include surgical resection of malignant tissue followed by adjuvant platinum–taxane combination therapy giving a high rate of initial response, but 60%–75% of patients demonstrate local recurrence [2,3].
There remains limited understanding of the pathogenesis of ovarian tumors due to the heterogeneous nature of the disease. Subtypes include serous, endometrioid, mucinous, clear cell, transitional cell, squamous cell, mixed epithelial, and undifferentiated [4]. Furthermore, the origin of tumors is difficult to understand since the physical development of cyst-like structures within the ovary is uncharacteristic of normal epithelial ovarian tissue [5] and at least a portion of serous ovarian tumors likely originate within the fallopian tube [5].
Genome-wide studies on the proteome and transcriptome abnormalities of EOC generated a large number of potential tumor biomarkers, including CA-125 and WFDC2 (HE4) proteins [6–8]. A widely accepted Risk of Malignancy Index (RMI) is used to differentiate between a malignant and benign abdominal mass [9]. The criteria used include a woman's age, ultrasound score, menopausal status, a clinical impression score, and serum CA-125 count. The Risk of Malignancy Algorithm (ROMA) improved upon RMI by including an additional biomarker HE4 [10], and the OVA1 blood tests include a panel of five biomarkers, which include CA-125, HE4, transferrin, prealbumin, and β2 microglobulin [11]; however, comprehensive serum studies evaluating the effectiveness of RMI, ROMA, and OVA1 blood tests have given conflicting results and still fail to promote early detection of EOC [6,12].
Alternative approaches to generate more sensitive diagnostic tools to aid in early detection of EOC include recognition of novel or existing tumor markers and membrane structures in their native state on the cell surface of EOC cells. Aptamers are single-stranded (ss) DNA/RNA oligonucleotides that fold into complex secondary and tertiary structures that enable them to bind with antibody-like properties to multiple targets. Aptamers have been used as probes for diagnostic identification of tumors in vivo, as single-molecule antagonists, and as directed therapy agents when conjugated to chemotherapeutics or small-molecule vehicles both in vitro and in vivo [13–19]. The potential clinical significance of aptamers has grown significantly [20] with reports of several clinical trials, including Macugen (pegaptanib) to inhibit VEGF165-mediated ocular neovascularization in age-related macular degeneration (AMD) [21,22] and Fovista, the anti-platelet derived growth factor β (anti-PDGF-β) aptamer to treat wet AMD [23]. Additional antagonistic aptamers disrupt complement component 5 (ARC1905) [24] and bind tumor-specific antigens such as B-cell receptors on human lymphoma and leukemia [25], as well as a proapoptotic AS1411 aptamer that targets nucleolin and inhibits nuclear factor-κB and Bcl-2 [26,27]. Since biomarkers on the surface of specific tumor subtypes are not always known, protocols such as whole Cell-SELEX (systematic evolution of ligands by exponential enrichment) can be used to screen for unique aptamers based on their ability to bind to the target tumor cells. Notably, aptamers have been identified by whole Cell-SELEX that can bind to the HGC-27 gastric cancer cell line and to paraffin-embedded primary gastric tumor sections [28].
To identify EOC cell-specific aptamers, we adopted and modified whole Cell-SELEX and identified aptamers that distinguish between neoplastic epithelial cells and nontransformed epithelial cells. We identified novel target-specific DNA aptamers recognizing human epithelial ovarian adenocarcinoma cells with no prior knowledge of target molecules. These aptamers specifically recognize target cells with an apparent equilibrium dissociation constant (Kd) measured in the nanomolar range, but show minimal interaction with physiologically similar epithelial tumor cells and nontransformed cell lines. Furthermore, aptamers internalize into target cells and thus have the potential to be utilized clinically as a diagnostic tool for detection, visualization, including metastasis, or for direct delivery of chemotherapeutics for treatment.
Materials and Methods
Cell lines
The human ovarian adenocarcinoma cell lines Caov-3 (HTB-75), SK-OV-3 (HTB-77), and SW626 (HTB-78) were obtained from ATCC and maintained in tissue culture at 37°C 5% CO2. Caov-3 cell lines were maintained in Dulbecco's Minimal Essential Medium (DMEM; Gibco) supplemented with 10% fetal bovine serum (FBS; Gibco) and 1% penicillin–streptomycin (Gemini). SK-OV-3 cell lines were maintained in McCoys5a media (ATCC) supplemented with 10% FBS (heat-inactivated; Gibco) and 1% penicillin–streptomycin (Gemini). SW626 cell lines were maintained in Leibovitz's media (ATCC) supplemented with 10% FBS (heat-inactivated; Gibco), 1% penicillin–streptomycin (Gemini), and 1% sodium bicarbonate (7.5% w/v; Cellgro). The pancreatic carcinoma cell line Hs766T (HTB-134; ATCC) and Suit-2 [29], human cervical adenocarcinoma HeLA (CCL-2; ATCC), breast adenocarcinoma cell lines MCF-7 (HTB-22; ATCC) and MDA-MB-231 (CRM-HTB-26; ATCC), and murine embryonic fibroblast NIH/3T3 (CRL-1658; ATCC) were all maintained in DMEM supplemented with 10% FBS (heat-inactivated; Gibco) and 1% penicillin–streptomycin (Gemini). The normal epithelial cell line HEK293 (CRL-1573; ATCC) was maintained in DMEM supplemented with 10% FBS (heat-inactivated; Gibco) and 1% penicillin–streptomycin (Gemini). The human papilloma virus (HPV) immortalized human ovarian epithelial (HOSE 6-3) cells [30] were maintained in Medium199/MCDB105 media (1:1; Sigma Aldrich) supplemented with 10% FBS (heat-inactivated; Gibco), 1% penicillin–streptomycin (Gemini), and 1% sodium bicarbonate (7.5% w/v; Cellgro).
Whole Cell-SELEX
A high-performance liquid chromatography (HPLC) purified ssDNA aptamer library [Integrated DNA Technologies (IDT)] contained a centralized random sequence of 20 nucleotides flanked by fixed 5′ and 3′ 20 nucleotide sequences for polymerase chain reaction (PCR) enrichment (5′-CTCCTCTGACTGTAACCACG-N20-GCATAGGTAGTCCAGAAGCCA-3′). Two microliters of the aptamer library (100 μM) in Tris-EDTA (TE) was added to 8 μL H2O with target Caov-3 cells. Samples were denatured at 95°C for 5 min and cooled on ice for 5 min before treating target cells. Cooled suspension was added to 980 μL binding buffer (BB) and phosphate-buffered saline (PBS) (Gibco) supplemented with 1% w/v bovine serum albumin (BSA; Cellgro), 4.5 g/L glucose (Sigma Aldrich), and 5 mM MgCl2 (Sigma Aldrich). Aptamers were incubated on a monolayer of Caov-3 cells (seeded at 2.0×10⁶ 48 h prior, 37°C 5% CO2) in a T25 flask at 4°C for 30 min under constant agitation in the absence of a competitor. After washing with PBS (3×) for 1 min, adhesive cells were collected. Cells with aptamers were centrifuged 12,000 rpm for 2 min in a microcentrifuge. The supernatant was discarded and bound aptamers were eluted at 95°C for 5 min in 50 μL 1×PBS. Eluted aptamers were collected, resuspended in 950 μL BB, and used for negative selection against HOSE 6-3 cells (seeded at 2.0×10⁶ 48 h prior, 37°C 5% CO2) in the T25 flask at 4°C for 30 min under constant agitation in the absence of a competitor. One milliliter of BB was collected and aptamers eluted by ethanol precipitation resuspended in 20 μL TE. The collected aptamers were amplified by PCR (GE HEALTHCARE illustra PuReTaq Ready-To-Go PCR beads): Primer A: 5′-gaggagactgacattggtgc, Primer B: cgtatccatcaggtcttcgga-5′, Cycle: 94°C 5 min, (35 cycles) 94°C 30 s, 62°C 30 s, and 72°C 45 s, followed by elongation 72°C 10 min. The PCR product was concentrated using DNA Clean & Concentrator™-5 (Zymo Research) and the total volumes of recovered aptamers were used for proceeding rounds of selection. Concentrations, as detected by NanoDrop, were significantly less than the initial starting concentration at the conclusion of round 1. The subsequent treatment concentration of aptamers was maintained (∼100 ng) following elution of aptamers and PCR enrichment. The first and second rounds of SELEX did not utilize the counter selection step, but were introduced during the third, fifth, seventh, and subsequent odd rounds of selection. A total of 15 rounds of whole Cell-SELEX were performed on the target cell line. Wash strength was enhanced gradually from 1 to 2 min, and flask sizes increased from T25 to T75 following and including round 10 of positive selection. To monitor the presence of aptamers through rounds of selection, aptamers from rounds 5, 8, and 12 were cloned into Escherichia coli by the manufacturer's recommendations using a One Shot TOPO10A Cloning Kit (Invitrogen) then analyzed by the Sequetech DNA Sequencing Service. Global sequence panels were obtained after 15 rounds of selection by Ion Torrent Next-Generation Sequencing [University of North Carolina, Charlotte (UNC Charlotte)].
Next-Generation Ion Torrent sequencing
One hundred nanograms of dsDNA PCR products was confirmed by the Quant-iT™ PicoGreen® dsDNA Assay Kit (Invitrogen) and used as template in the Ion Xpress Plus Fragment Library Kit (Invitrogen) following the protocol for short amplicons. Amplification of the prepared library was required; therefore, the protocol to amplify and purify the library was followed. The amplified library was quantified using the KAPA Biosystems Library Quantification Kit for the Ion Torrent platform on a Bio-Rad MyiQ iCycler to determine the template dilution factor to be used with the Ion PGM Template OT2 200 Kit and the OneTouch 2 instrument. After emulsion PCR, the clonally amplified sample was run on the Ion Torrent PGM instrument using the Ion PGM Sequencing 200 Kit v2 and a 314 chip. Run conditions included 260 flows on the PGM instrument for sample 1 and 500 flows for sample 2.
Flow cytometry (binding kinetics)
To test the binding capacity of selected ovarian aptamers, RLA01, RLA02, and RLA03 were obtained from IDT labeled with a Cy5 fluorescent dye. The binding affinity of aptamers was determined by incubating cell lines on six-well plates (seeded at 1.0×10⁶, incubated 48 h) with varying concentrations of Cy5-labeled aptamers. Twenty-five microliters of aptamer pool in TE was added to 1 mL of cell line-specific media and incubated at 37°C 5% CO2 for 2 h, agitating slightly every 30 min. Cells were then washed twice with 2 mL 1×PBS, scraped in 1 mL 1×PBS, and filtered through a 35-μm nylon mesh cell strainer polystyrene tube (BD Falcon). Cells were subjected to flow cytometric analysis within 1 min, and fluorescent events were determined with a Becton Dickinson LSRFortessa Flow Cytometer by counting 50,000 events. A Cy5-labeled randomized unselected 60-mer oligo was used as negative control. Mean fluorescent events (n=3) were recorded and used to calculate an apparent dissociation constant (Kd) for specific binding. The Kd of the fluorescent aptamers was obtained by fitting the dependence of fluorescence intensity of specific binding on the concentration of the ligands to the equation Y=Bmax*X^h/(Kd^h+X^h) using GraphPad Prism software. When calculating respective Kd values, baseline fluorescence for untreated cells was not presubtracted off since the detected initial autofluorescence made no significant impact on the calculated Kd values. Concentrations of Cy5 aptamer conjugates were brought to 1,600 nM to saturate the system and obtain sigmoidal curves giving the most accurate Kd values for post hoc analysis.
Flow cytometry (endosomal internalization)
To determine the percent internalization of Cy5 aptamer conjugates, pHrodo® Red Transferrin Conjugate was used (Invitrogen). Aptamers (500 nM) were added to 1 mL cell-specific media, incubated on Caov-3 cells (six-well plates seeded at 1.0×10⁶ 48 h prior, 37°C 5% CO2), and observed at 30, 60, 90, and 120 min posttreatment. Thirty minutes before predetermined time points, staining with the endosomal-specific marker pHrodo Transferrin Conjugate was done by the manufacturer's recommended protocol (25 μg/mL). Cells were then washed twice with 2 mL 1×PBS, scraped in 1 mL 1×PBS, and filtered through a 35-μm nylon mesh cell strainer polystyrene tube (BD Falcon). Cells were subjected to flow cytometric analysis within 1 min, and fluorescent events were determined with a Becton Dickinson LSRFortessa Flow Cytometer by counting 100,000 events. Percent internalization was calculated by the following equation: (No. of dual Cy5 pHrodo Red events−No. of pHrodo Red untreated background)/No. of Cy5 events.
Confocal imaging
Cells were seeded at 5.0×10⁴ per well/plate and incubated at 37°C 5% CO2 for 48 h. Two microliters of Cy5 aptamer conjugates at concentration ranges of 1–25 μM was added to 1 mL cell-specific media and incubated on target cells at 37°C 5% CO2 for 2 h agitating slightly every 30 min on a 35, 0/10-mm glass-bottomed culture dish and 35, 0/10-mm glass-bottomed 24-well plate (Greiner Bio-One). Cells were washed with PBS (3×) and fixed with 2 mL heptane [1:8.25 PBS: 37% formaldehyde (Sigma Aldrich)] at 37°C for 10 min. For endosomal internalization-specific microscopy, cells were treated with pHrodo Red Transferrin Conjugates by the manufacturer's recommended protocol 30 min before fixing. Endosomal internalization was observed at 30-, 60-, 90-, and 120-min time points postinitial treatment with Cy5 aptamer conjugates. Cells were washed with PBS (3×) and fixed with 2 mL heptane [1:8.25 PBS: 37% formaldehyde (Sigma Aldrich)] at 37°C for 10 min. Subsequent staining of fixed cells was performed with DAPI (10 ng/μL, 10 min) or cell membrane stain Wheat Germ Agglutinin Alexa 488 conjugate (1 μg/μL, 10 min; Invitrogen) using standard procedures. Imaging of the cells was done with an Olympus FluoView 1000 confocal microscope using DAPI (blue), Alexa448 (green), pHrodo Red (orange), and Cy5 (red) filters.
Results
Identification of Caov-3-specific aptamers
Whole Cell-SELEX was utilized to identify aptamers that bind and internalize into Caov-3 ovarian epithelial adenocarcinoma cells [31,32]. The Caov-3 adenocarcinoma cell line corresponds to late-stage EOC and has been shown to express upregulated tumor biomarkers such as NB/70K, Ca-1, carcinoembryonic antigen (CEA), and Ba-2 [33]. To ensure aptamer target cell specificity, rounds of negative selection were carried out on HPV immortalized human ovarian surface epithelial cells (HOSE 6-3) [30]. Morphologically, HOSE 6-3 cells exhibited structurally identical cytoskeleton filaments with that of normal ovarian epithelial cells and show no upregulation of known ovarian tumor-specific markers such as CA-125 after immortalization [30]. The nontransformed immortalized HOSE 6-3 cell line has demonstrated to be nontumorigenic when inoculated into nude mice after 20 passages [30]. The use of HOSE 6-3 cells for negative selection was deemed significant for potential in vivo therapeutic applications, in which aptamers would need to bind to malignant cells, but not to neighboring nontumor cells of otherwise similar cell type or origin. Potential aptamers were identified from an initial randomly generated ssDNA 60 bp oligonucleotide library in a dual-positive and dual-negative selection process consisting of selection rounds, followed with PCR enrichment before the subsequent round. Negative selection was performed at rounds 3, 5, 7, 9, 11, and 13, which promoted identification of aptamers highly specific to malignant cells.
Monitoring aptamer selection and identification of ovarian tumor-specific aptamers
To confirm that full-length aptamers were being selected for and enriched through consecutive rounds, we used TOPO cloning. Complete 60-mer aptamer sequences were identified after rounds 3, 8, and 12 of whole Cell-SELEX. Clones analyzed from round 3 showed 11 distinct aptamer species with one subgroup representing 67% of the population. Sequencing of clones from round 12 of selection provided 10 distinct aptamer species with one of these aptamer species representing 33% of the sequenced population. In addition, the enrichment process was also monitored by way of flow cytometry with Cy5-labeled aptamers. Aptamers were amplified from indicated rounds of Cell-SELEX (Fig. 1) by PCR using a 5′-Cy5-labeled primer and an antisense 5′-biotin-labeled primer. The removal of the 60-mer aptamer antisense strands was done by denaturing the double-stranded PCR product (95°C 5 min) and isolating biotin-labeled strands with streptavidin with subsequent exposure to a magnetic field. This ensured that the remaining supernatant was rich with Cy5-labeled aptamers. The Cy5-labeled aptamers (100 ng) were incubated with target Caov-3 cells, collected by scraping, and analyzed by flow cytometry. Baseline fluorescent values were determined using a Cy5-labeled initial random library (red). A right shift in the fluorescent cell population can be seen when fluorescently labeled aptamers from rounds 3, 8, and 12 of Cell-SELEX were incubated with Caov-3 cells (Fig. 1). This shift in fluorescent populations indicates enrichment of cell-specific aptamers that bind and internalize into cells. Moreover, the observed difference in Cy5 fluorescently labeled Caov-3 cell populations significantly increases when comparing aptamer pools from round 3 (blue) to round 8 (orange) of Cell-SELEX (Fig. 1). The observed shift in the fluorescently labeled Caov-3 cell populations seen between round 8 and round 12 (green) aptamer pools is significantly less, which suggests that aptamer pools are nearing the threshold of potential aptamer enrichment. To characterize the complete aptamer population, we used Next-Generation Ion Torrent (NGIT) sequencing. We obtained 53% loading efficiency resulting in over 293,000 ssDNA reads. From an initial random pool of ∼420 sequences, NGIT sequencing identified seven full-length aptamers (Table 1) within the aptamer pool, and here we report on three of these aptamers RLA01, RLA02, and RLA03. Given the flow cytometry data and the identification of seven unique aptamers in sequencing data from our initial randomized pool, we terminated our Cell-SELEX protocol after 15 rounds.
FIG. 1.
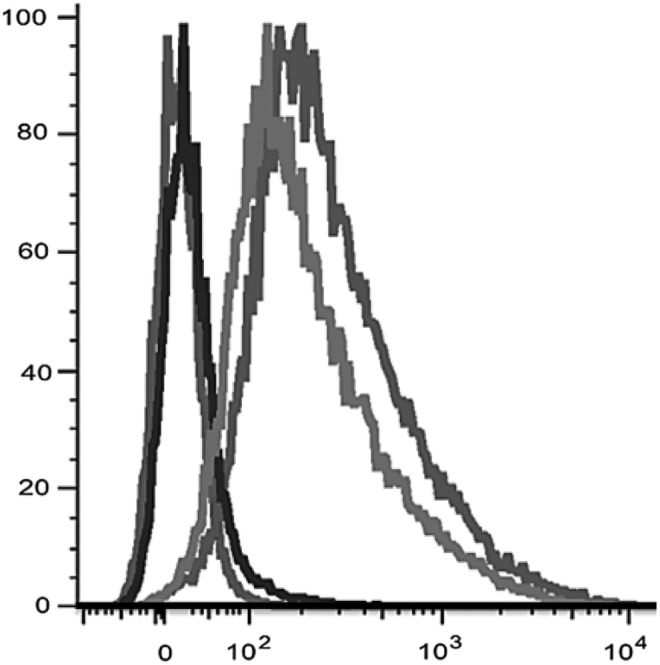
Monitoring the enrichment of Caov-3-specific aptamers from rounds 3, 8, and 12 of Cell-SELEX by flow cytometry. Flow cytometry histograms are shown for Cy5-labeled aptamer pools from successive rounds of Cell-SELEX. A right shift in fluorescence of the cell populations is indicative of increases in aptamer binding and internalization. Aptamer rounds of selection: initial random library ( ), round 3 (
 ), round 8 (
 ), and round 12 () of Cell-SELEX.
Table 1.
Sequences of Identified Aptamers by Cell-SELEX Specific for Caov-3 Ovarian Tumor Cell Lines
| Aptamer | Sequence |
|---|---|
| RLA01 | CTCCTCTGACTGTAACCACGCGGAAAGCATCAGGGTTGAGCATAGGTAGTCCAGAAGCCA |
| RLA02 | CTCCTCTGACTGTAACCACGAGAAGGTCCAGAGAGTAGTGGCATAGGTAGTCCAGAAGCCA |
| RLA03 | CTCCTCTGACTGTAACCACGCTACGGTTCGGAGGACACCCGCATAGGTAGTCCAGAAGCCA |
| RLA04 | CTCCTCTGACTGTAACCACGCGAGGGGCGGACAGGGGAGGCATAGGTAGTCCAGAAGCCA |
| RLA05 | CTCCTCTGACTGTAACCACGGATCAGGGGAAACTCCAGTGGCATAGGTAGTCCAGAAGCCA |
| RLA06 | CTCCTCTGACTGTAACCACGTGACTAATTAGAGGTGGATCGCATAGGTAGTCCAGAAGCCA |
| RLA07 | CTCCTCTGACTGTAACCACGTTATGAATTGGCGCCGGGGAGCATAGGTAGTCCAGAAGCCA |
| Scrambled aptamer | ACTCAACGAACGCTGTGGATGCGACATAGCTAGCAGCGCATATGTATGTACATGGACATCT |
Specificity of aptamer binding and internalization to target cells
Flow cytometry was used to quantify the aptamer-binding activity. RLA01, RLA02, and, RLA03 were evaluated to determine the binding kinetics of each and calculate apparent equilibrium dissociation constants (Kd). The aptamers were conjugated to cyanine dye Cy5 on the 5′ end to enable detection by flow cytometry and quantify the number of cells that bind to the target aptamer. In addition, a random scrambled aptamer also conjugated to Cy5 was used as a negative control to demonstrate specificity (Table 1). Target EOC Caov-3 cells as well as EOC cell lines SK-OV-3 and SW626 were treated with increasing molar concentrations of Cy5 aptamers for 2 h. Following washing of excess unbound aptamers, cells were analyzed by flow cytometry to quantify Cy5 fluorescence. To establish baseline fluorescence, untreated Caov-3 cells were also analyzed and gating of the background fluorescence was set to 0.01% of the total population analyzed (data not shown). As expected, no fluorescent events above the background gate were observed when Caov-3 cells were incubated with the random scrambled aptamer at concentrations 1 –1.6 μM; data not shown. RLA01, RLA02, and RLA03 all demonstrated a dose-dependent increase (1 –1.6 μM) in binding to target Caov-3 cells, as demonstrated by the increased number of fluorescent events (Fig. 2A–C, closed circles, respectively). Binding of each of the aptamers to Coav-3 cells was highly specific since minimal binding events were detectable by flow cytometry when any were incubated with either of the analogous epithelial ovarian tumor cell lines SK-OV-3 or SW626 (Fig. 2). Similar to Caov-3, SK-OV-3 cells are derived from epithelial ovarian adenocarcinoma, but also characterized as resistant to multiple cytotoxic drugs [34]. Although SW626 was isolated as an ovarian adenocarcinoma, genome expression evidence recently indicated it likely originated as a colorectal tumor metastasized to the ovary [35]. From the flow cytometry data (Fig. 2), respective apparent Kd values for RLA01, RLA02, and RLA03 to Caov-3 cells were calculated in the nanomolar range as 365.3±24.14, 225.5±48.29, and 505±70.64 nM, respectively (Table 2).
FIG. 2.

Binding kinetics of ovarian tumor-specific aptamers to determine equilibrium dissociation constants (Kd) to ovarian tumor cell lines. To assess target cell and aptamer binding affinities, we used flow cytometry to quantify Cy5 aptamer conjugate binding and specificity to ovarian epithelial malignant cell lines Caov-3 (●), SK-OV-3 (■), and SW626 (▲). Data points represent the average fluorescent events observed (n=3, error bars±SD) at indicated nM concentrations. (A) Cy5-RLA01 aptamer conjugates with Caov-3 target cells and nontarget SK-OV-3 and SW626 cell lines in increasing nM doses. (B) Cy5-RLA02 aptamer conjugates with Caov-3 target cells and nontarget SK-OV-3 and SW626 cell lines in increasing nM doses. (C) Cy5-RLA03 aptamer conjugates with Caov-3 target cells and nontarget SK-OV-3 and SW626 cell lines in increasing nM doses. Individual apparent Kd values were calculated by using the equation Y=Bmax*X^h/(Kd^h+X^h) for the three DNA aptamers.
Table 2.
Characterization of Identified Caov-3 Aptamer Binding Kinetics with Target and Nontarget Cells
| Ovarian | Normal | Cervical | Breast | Pancreatic | Murine | ||||||
|---|---|---|---|---|---|---|---|---|---|---|---|
| Caov-3 | SK-OV-3 | SW626 | HEK293 | HOSE 6-3 | HeLa | MDA-MB-231 | MCF-7 | Suit-2 | Hs766t | NIH 3T3 | |
| +++ | + | + | |||||||||
| RLA01 | 365.3±24.14 | 627.1±65.67 | — | — | — | 645.3±60.91 | — | — | — | — | — |
| + | |||||||||||
| RLA02 | 225.5±48.29 | — | — | — | — | — | — | — | — | — | — |
| ++ | |||||||||||
| RLA03 | 505±70.64 | — | — | — | — | — | — | — | — | — | — |
Kd=nM.
+++, >15% of total cell population showing Cy5 fluorescent events; ++, 10%–15% of total cell population showing Cy5 fluorescent events; +, <10% of the total cell population showing Cy5 fluorescent events; —, <1% of total cell population showing Cy5 fluorescent events-Kd undetermined.
Aptamer specificity was further demonstrated by comparison of Cy5 aptamer binding to a large panel of cell lines. Incubation with both 400 nM (Fig. 3A, blue) and 800 nM (Fig. 3A, green) Cy5-RLA01 for 2 h produced a right shift in the fluorescent Caov-3 cell population over untreated cells, consistent with an increase in the aptamer–cell interaction. By contrast, minimal shift of the population above baseline was observed with either nontransformed HOSE 6-3 cells or kidney epithelial HEK293 cells when incubated with increasing molar concentrations of Cy5-RLA01, Cy5-RLA02, or Cy5-RLA03 (Fig. 3A). This was further demonstrated by confocal microscopy as seen in Figure 3C. Aptamer–cell interactions were observed with Cy5-RLA01 when incubated with SK-OV-3 and HeLa cell lines (Fig. 3D), and apparent Kd values of 627.1±65.67 and 645.3±60.91 nM were determined (Table 2). Although flow cytometry confirms aptamer–cell binding for both HeLa and SK-OV-3 cell lines, the average fluorescent events observed were significantly less for both when compared to RLA01 binding to Caov-3 cells and showed no interaction with the scrambled aptamer at equal doses (Fig. 3D).
FIG. 3.

Dose-dependent and time-dependent specificity of RLA01, RLA02, and RLA03 aptamers binding to target cells. RLA01 aptamers were incubated at increasing concentrations and times to normal and malignant epithelial cell lines. (A) Flow cytometry analysis of Cy5-RLA01, RLA02, and RLA03 incubated with indicated cell lines for 2 h. Aptamer doses corresponding to colored histograms are control ( ), 400 (
 ), and 800 nM (
 ) concentrations. (B) Cy5-RLA01 incubated with indicated cell lines for 4 h. (C) Confocal imaging of indicated cell lines treated with Cy5-RLA01 imaged at 60×using a nuclear stain (DAPI as blue), a membrane stain (WGA-Alexa Fluor 488 as green), and Cy5 aptamers (Cy5 pseudocolored as yellow). (D) Binding kinetics of RLA01 when increasing molar concentrations are incubated with Caov-3 (•), SK-OV-3 (▪), and HeLa (▴). Data points represent the average fluorescent events observed (n=3, error bars±SD) at indicated nM concentrations, and individual apparent Kd values were calculated by using the equation Y=Bmax*X^h/(Kd^h+X^h).
Specificity of all three aptamers was further demonstrated with a large panel of immortalized nonmalignant epithelial and multiple malignant epithelial cell lines, including two malignant pancreatic epithelial carcinomas (Suit-2, Hs766t), two mammary epithelial adenocarcinomas (MCF-7, MDA-MB-231), one cervical epithelial adenocarcinoma (HeLa), two ovarian epithelial adenocarcinoma cell lines (SK-OV-3, SW626), as well as kidney epithelial cells (HEK293), and murine fibroblast NIH/3T3 cells. Kidney epithelial tissue was chosen because kidneys play a major role in the removal of organic waste from the bloodstream and thus would impact potential clinical use by intravenous delivery of aptamers. Aptamer-binding events were minimal or undetectable as shown by flow cytometry when incubated with malignant cell lines in increasing molar concentrations (Table 2). Binding of aptamers was also time dependent (Fig. 3B). Increasing incubation time of Cy5-RLA01 with Caov-3 cells from 2 to 4 h produced 275% more fluorescent events, while fluorescent events in HOSE 6-3 cells remained similar to baseline controls (Fig. 3B).
Specific binding and internalization of RLA01, RLA02, and RLA03 to Caov-3 cells were demonstrated by flow cytometry and confocal imaging (Fig. 4). Cell membranes were identified by wheat germ agglutinin conjugates labeled with Alexa Fluor® 488 enabling identification of two key cellular structures: (1) the cell membrane where Cy5 aptamer conjugates are predicted to localize upon initial target recognition and (2) the internal endosomal membranes where aptamers are expected to localize to if efficiently internalized into cells. Images of aptamer-specific binding and endosomal internalization were assessed as early as 30 min and up to 2 h postinitial treatment of Cy5 aptamer conjugates ranging in dosages of 1 –25 μM. Supporting the flow cytometry data, no internalization at any dose was observed with scrambled aptamer (Table 1). Aptamers RLA01, RLA02, or RLA03 (pseudocolored yellow) localized on and around membranes of Caov-3 cells (Fig. 4A). The observed Cy5 fluorescent signals appeared at or near the membranes similarly to that of the Alexa Fluor WGA stain. All three aptamers localized to the cell membranes (Fig. 4A). In addition, all three localized to multiple compartments within the cytoplasm proximal to the membranes, suggesting endosomal internalization. Internalization of Cy5 aptamer (500 nM) conjugates was measured by flow cytometry at 30, 60, 90, and 120 min postinitial treatment with aptamer RLA01 on Caov-3 cells (Fig. 4B). In addition, the percent of internalization events over the same range of time is shown in Figure 4C. These data were further confirmed by confocal imaging. We used the endosomal marker pHrodo Red Transferrin Conjugate to identify colocalization of Cy5 aptamer conjugates (5 μM) and endosomal structures. As seen in Figure 4D, pHrodo Red-stained endosomal structures (pseudocolored red) colocalize with Cy5 fluorescent aptamers (pseudocolored yellow). These data are highly suggestive that the internalization of aptamers into Caov-3 cells is regulated by endocytic pathways. Moreover, Z-stack imaging (20 stacks, 2 μm range) further demonstrated Cy5 fluorescence within cells consistent with internalization of aptamers (Supplementary Fig. S1A, B; Supplementary Data are available online at www.liebertpub.com/nat). Thus, confocal imaging of all three Cy5 aptamer conjugates demonstrated a fluorescent activity consistent with the average max fluorescent events observed by flow cytometry (Figs. 2A–C and 4).
FIG. 4.

Internalization of RLA01, RLA02, and RLA03 aptamers into Caov-3 cells occurs through the endocytic pathway. (A) Caov-3 cells were treated with Cy5-conjugated RLA01, RLA02, or RLA03 aptamers. Untreated (-) and Cy5-conjugated RLA01, RLA02, and RLA03 aptamer-treated cells were imaged at 60×using a nuclear stain (DAPI as blue), a membrane stain (WGA-Alexa Fluor 488 as green), and Cy5 aptamers (Cy5 pseudocolored as yellow). (B) Graphic representation of Cy5-RLA01 (500 nM) fluorescent events by flow cytometry observed over a 2-h time course. (C) Graphic representation of percentage of cells showing positive endocytic internalization of Cy5-RLA01 (500 nM) confirmed using pHrodo Red Transferrin Conjugate. (D) Caov-3 cells were treated with 5 μM Cy5-conjugated RLA01, RLA02, or RLA03 aptamers. Cells were imaged at 60× using a nuclear stain (DAPI as blue), an endosomal-specific marker (pHrodo Red pseudocolored as red), and Cy5 aptamers (Cy5 pseudocolored as yellow).
Confocal imaging was also employed to further demonstrate aptamer specificity. The three Caov-3 target aptamers were incubated with a panel of selected EOCs, malignant epithelial, and nonmalignant immortalized cell lines (Supplementary Fig. S2). Consistent with the flow cytometry histograms shown in Figures 3A, Cy5-RLA01, fluorescent events were not detected above baseline untreated control levels when increasing molar concentrations of Cy5-RLA03 were administered to nonmalignant HOSE 6-3 and HEK293 epithelial cell lines (Supplementary Fig. S2). In addition, incubation of Cy5-RLA03 conjugates with malignant epithelial cell lines produced minimal fluorescent events similar to those of untreated control samples. Overall, the full range of Cy5-RLA03 concentrations used for incubation with malignant epithelial cells showed no fluorescent events after a 2-h incubation period, and this was further supported by confocal imaging (Supplementary Fig. S2). Cy5-RLA02 conjugates produced similar data to the Cy5-RLA03 conjugates. Cy5-RLA02 demonstrated no binding to the panel of malignant and nonmalignant cell lines (data not shown). Despite observing detectable fluorescent events when SK-OV-3 and HeLa cell lines were incubated with increasing molar concentrations of RLA01 (Fig. 3D), data obtained by flow cytometry against the panel of malignant and nonmalignant cell lines showed no total fluorescent events above untreated control baseline levels, also supported by confocal imaging (data not shown).
Predicting tertiary structures of aptamers
To predict the most stable structure for RLA01, RLA02, and RLA03, we used UNAfold (Rensselaer Polytechnic Institute). Ranking of the stability for aptamers RLA01, RLA02, and RLA03 is based on Gibbs free energy and yielded ΔG values of −2.4, −4.91, −4.24 kcal/mol, respectively. RLA01 and RLA02 exhibit a large central loop with small hairpin structures radiating from the main loop. RLA03 will form a longer structure consisting of a double hairpin with a central loop. Figures detailing the top energetically stable secondary structures of aptamers RLA01, RLA02, and RLA03 are available in Supplementary Fig. S3.
Discussion
As expected, all three aptamers RLA01, RLA02, and RLA03 bound with high affinity to the target Caov-3 cells used in the initial screen for their identification. RLA02 and RLA03 demonstrated exclusive specificity with minimal to undetectable interaction with any of the malignant or nonmalignant epithelial cell lines tested except the target Caov-3 cells. It is interesting to note that RLA01 showed binding interactions with both SK-OV-3 and HeLa cells, compared to controls. However, the max fluorescent events observed in the other cell lines were lower than the binding kinetics to Caov-3. One possible explanation for these results could be the existence of a commonly shared receptor among the three cell lines expressed at highest levels in Caov-3 cells and moderate or low levels on the other two. A second explanation could be that structurally similar or related proteins are present on the membranes of the three cell lines, with RLA01 having the highest binding affinity for the one that is expressed on Caov-3 cells. Ovarian surface epithelium and cells in the Mullerian tract are derived from common embryonic coelomic progenitors [36]. Since Caov-3 and SK-OV-3 cells were isolated from ovarian epithelial tissue, it is likely that a common receptor is shared between the two cell lines. However, a study comparing EOC cell lines involving karyotyping, surface markers, and drug resistance indicated that Caov-3 cell lines display a unique genetic lesion on the long arm of chromosome 3 (del(3)(p13) not seen in SK-OV-3 cell lines [33,37]. This could result in altered morphology in common surface structures such as dysregulated glycosylation of common receptors on Caov-3 versus SK-OV-3 cells. In addition, the heterogeneity observed in EOC development could further explain the common expression of surface structures seen in ovarian tumor subtypes and cervical carcinomas, which are known to originate from squamocolumnar junctions of the cervix [38]. Data suggest that ovarian tumors manifest from cells expressing Mullerian tract differentiation. Although fallopian, ovarian, and pelvic cancers are treated as three distinct neoplastic diseases, it is believed that the majority of them originate from a common Mullerian progenitor and/or distal fimbriae tubes of the ovary [5,36,39–41]. It is possible that these malignant cell lines share a common receptor that is up- or downregulated depending on a particular context, abnormality, or in response to external stimuli such as hormones. SK-OV-3 cells originate from an epithelial adenocarcinoma similar to Caov-3 cells; however, they also demonstrate levels of resistance to multiple cytotoxic drugs, including platinum–taxanes [33,34], and thus could differ from Caov-3 at a minimum in their expression of ABC multiple drug resistance transporters on the cell surface. However, the similarity of characteristics of these cell lines is in their origin in the female reproductive tract rather than as epithelial cells per se, since no binding events were detected by either flow cytometry or confocal imaging when RLA01 was incubated with epithelial cells from other tissues.
The three aptamers have apparent Kd values in the nanomolar range which show that they bind with high affinity to target cells. Physiologically relevant apparent equilibrium dissociation values for therapeutic molecules are considered to be in the nanomolar to picomolar range. Initial dosing of pegaptanib (Macugen) to inhibit VEGF165 in HUVEC cells had an IC50 value between 0.75 and 1.4 nM with total inhibition of VEGF165 binding observed at 10 nM [42]. However it is important to note that pegaptanib is an inhibitory aptamer with a single agonist and was developed in a sequential process in the presence of a purified target molecule only [43]. Another non-SELEX identified aptamer AS1411, formerly ARGO100, showed initial inhibition of MDA-MD-231 cell proliferation after a 15 μM dose [44,45]. Several aptamers have been identified through positive and negative whole Cell-SELEX. The reported DOV-3 aptamer with an apparent Kd 132±32 nM [46] identified as binding to Caov-3 cells, similar to this study, was counterselected against malignant cervical HeLa cells, which may not be as relevant for identification of ovarian tumor-specific aptamers. Additional whole Cell-SELEX aptamers with nanomolar Kd values target Axl (GL21 aptamer apparent Kd 221 nM) [47], B-cell receptors of Burkitt's lymphoma cell lines (TD05 apparent Kd 74.7±8.7 nM) [25,48], and the liver cancer MEAR cell line (TLS6 apparent Kd 157.0±16.9 nM) [49]. In addition to reporting apparent Kd values in the nanomolar range, our reporting of higher total fluorescent events over a range of aptamer doses supports the use of these aptamers as attractive candidates to chaperone chemotherapeutic drugs or small-molecule vehicles directly to the tumor sites. We hypothesize that the number of events observed by flow cytometry directly correlates to the effective dose of aptamer–drug conjugates internalized. This could increase the efficacy of current treatment protocols by delivering more cytotoxic drugs to the tumor, while reducing systemic cytotoxic side effects typically seen with them.
Furthermore, confocal imaging clearly supports significant internalization of aptamers into specific cell types. Typically, it is believed that aptamers internalize into cells through canonical endosomal pathways. Our raw confocal images utilizing an endosomal-specific marker, as well as Z-stack, generated images that support colocalization of Cy5 aptamer signal to internal endosomal membranes.
The three aptamers are similar in their 5′ and 3′ sequences, which were used as anchors for PCR amplification during Cell-SELEX. Despite these known identities, the aptamers have different stable predicted structures and hairpin loops that would produce unique surfaces for interactions with target cell membranes. Further support that these aptamers are unique comes from the independent equilibrium binding kinetics of each on Caov-3 cells. The confocal imaging was consistent with the total fluorescent events observed by flow cytometry using Cy5-conjugated aptamers with highest levels of internalized aptamers observed with RLA01, followed by RLA03, and lowest with RLA02. Furthermore, RLA01 was determined to bind to a broader spectrum of cell types, as discussed above. Although others reported identification of ovarian carcinoma-specific aptamers, sequence alignment of the three described here shows that they are unique from those previously reported.
To be most physiologically relevant for future therapeutic uses, it is believed that aptamers should interact with the target malignant cells and not other nonmalignant cells, which would be neighboring cells and likely of the same original cell origin. Notably, our adapted Cell-SELEX protocol included negative selection against nonmalignant ovarian epithelial cells. Flow cytometry and confocal analysis supported nonreactivity of the aptamers to nonmalignant epithelial cells of both ovarian and kidney origin. By contrast to this report, others utilized HeLa cells, a known neoplastic immortalized line for negative selection [46]. That our protocol yielded aptamers unique from those previously reported highlights that individual Cell-SELEX strategies used will be a key factor in determining what aptamers are identified. Large bioinformatics approaches for comparison of multiple parallel aptamer pools and a large panel of cell types could reveal similar sequence patterns for aptamers that bind to related disorders.
In conclusion, we modified whole Cell-SELEX to identify three DNA-based aptamers that bind with high affinity to the EOC cell line Caov-3, but importantly not to the nonmalignant epithelial HOSE 6-3 cell line. The modified protocol described here is unique, in that we identified EOC aptamers specific to Caov-3 following negative selection against a nontransformed epithelial cell line. Specificity of all three aptamers was shown across a panel of tumor types, including breast, cervical, and pancreatic malignancies. In addition, the differences in aptamer binding kinetics demonstrated here can be used to infer particular molecular characteristics of the target cells. The identified aptamers can potentially be used to enhance the sensitivity of current clinical diagnostic tools to identify ovarian neoplasms. The lack of interactions observed with nontumor epithelial cells suggests that aptamer-based therapies can minimalize interaction with nonmalignant tissues and improve upon the incidence of false-positive results regarding benign versus malignant diagnosis or to potentially deliver cytotoxic drugs to distal tumor sites in the body. Thus, overall, our data suggest these aptamers are attractive candidates for further analysis to direct and localize chemotherapeutics to tumor sites and potentially aid in the early diagnosis of ovarian malignancies.
Supplementary Material
Acknowledgments
C.R. and this report was funded through a Faculty Research Grant, UNC Charlotte, the Charlotte Research Institute, UNC Charlotte, and the Center for Biomedical Engineering and Science, UNC Charlotte. We gratefully acknowledge Cory Brouwer (College of Computing and Informatics, UNC Charlotte) for providing Ion Torrent Sequencing reagents, George S.W. Tsao for HOSE 6-3 cells, David Gray for confocal imaging and flow cytometry expertise and technical assistance, and Deborah Nwafor and Noelle Cornelio for technical assistance.
Author Disclosure Statement
No competing financial interests exist.
References
- 1.Choi M, Fuller CD, Thomas CR., Jr. and Wang SJ. (2008). Conditional survival in ovarian cancer: results from the SEER dataset 1988–2001. Gynecol Oncol 109:203–209 [DOI] [PubMed] [Google Scholar]
- 2.Kroep JR. (2012). Advances in epithelial ovarian cancer therapy. Curr Pharm Des 18:3735–3740 [DOI] [PubMed] [Google Scholar]
- 3.Bicaku E, Xiong Y, Marchion DC, Chon HS, Stickles XB, et al. (2012). In vitro analysis of ovarian cancer response to cisplatin, carboplatin, and paclitaxel identifies common pathways that are also associated with overall patient survival. Br J Cancer 106:1967–1975 [DOI] [PMC free article] [PubMed] [Google Scholar]
- 4.Conic I, Dimov I, Tasic-Dimov D, Djordjevic B. and Stefanovic V. (2011). Ovarian epithelial cancer stem cells. ScientificWorldJournal 11:1243–1269 [DOI] [PMC free article] [PubMed] [Google Scholar]
- 5.Dubeau L. (2008). The cell of origin of ovarian epithelial tumours. Lancet Oncol 9:1191–1197 [DOI] [PMC free article] [PubMed] [Google Scholar]
- 6.Cohen JG, White M, Cruz A. and Farias-Eisner R. (2014). In 2014, can we do better than CA125 in the early detection of ovarian cancer? World J Biol Chem 5:286–300 [DOI] [PMC free article] [PubMed] [Google Scholar]
- 7.Hellstrom I. and Hellstrom KE. (2008). SMRP and HE4 as biomarkers for ovarian carcinoma when used alone and in combination with CA125 and/or each other. Adv Exp Med Biol 622:15–21 [DOI] [PubMed] [Google Scholar]
- 8.Sorace JM. and Zhan M. (2003). A data review and re-assessment of ovarian cancer serum proteomic profiling. BMC Bioinformatics 4:24. [DOI] [PMC free article] [PubMed] [Google Scholar]
- 9.Jacobs I, Oram D, Fairbanks J, Turner J, Frost C, et al. (1990). A risk of malignancy index incorporating CA 125, ultrasound and menopausal status for the accurate preoperative diagnosis of ovarian cancer. Br J Obstet Gynaecol 97:922–929 [DOI] [PubMed] [Google Scholar]
- 10.Moore RG, McMeekin DS, Brown AK, DiSilvestro P, Miller MC, et al. (2009). A novel multiple marker bioassay utilizing HE4 and CA125 for the prediction of ovarian cancer in patients with a pelvic mass. Gynecol Oncol 112:40–46 [DOI] [PMC free article] [PubMed] [Google Scholar]
- 11.Zhang Z, Bast RC, Jr., Yu Y, Li J, Sokoll LJ, et al. (2004). Three biomarkers identified from serum proteomic analysis for the detection of early stage ovarian cancer. Cancer Res 64:5882–5890 [DOI] [PubMed] [Google Scholar]
- 12.Yip P, Chen TH, Seshaiah P, Stephen LL, Michael-Ballard KL, et al. (2011). Comprehensive serum profiling for the discovery of epithelial ovarian cancer biomarkers. PLoS One 6:e29533. [DOI] [PMC free article] [PubMed] [Google Scholar]
- 13.Kruspe S, Meyer C. and Hahn U. (2014). Chlorin e6 conjugated interleukin-6 receptor aptamers selectively kill target cells upon irradiation. Mol Ther Nucleic Acids 3:e143. [DOI] [PMC free article] [PubMed] [Google Scholar]
- 14.Zhu J, Huang H, Dong S, Ge L. and Zhang Y. (2014). Progress in aptamer-mediated drug delivery vehicles for cancer targeting and its implications in addressing chemotherapeutic challenges. Theranostics 4:931–944 [DOI] [PMC free article] [PubMed] [Google Scholar]
- 15.Brody EN. and Gold L. (2000). Aptamers as therapeutic and diagnostic agents. J Biotechnol 74:5–13 [DOI] [PubMed] [Google Scholar]
- 16.Zhou W, Huang PJ, Ding J. and Liu J. (2014). Aptamer-based biosensors for biomedical diagnostics. Analyst 139:2627–2640 [DOI] [PubMed] [Google Scholar]
- 17.Shum KT, Zhou J. and Rossi JJ. (2013). Nucleic acid aptamers as potential therapeutic and diagnostic agents for lymphoma. J Cancer Ther 4:872–890 [DOI] [PMC free article] [PubMed] [Google Scholar]
- 18.Jalalian SH, Taghdisi SM, Shahidi Hamedani N, Kalat SA, Lavaee P, et al. (2013). Epirubicin loaded super paramagnetic iron oxide nanoparticle-aptamer bioconjugate for combined colon cancer therapy and imaging in vivo. Eur J Pharm Sci 50:191–197 [DOI] [PubMed] [Google Scholar]
- 19.Cunningham ET, Jr., Adamis AP, Altaweel M, Aiello LP, Bressler NM, et al. (2005). A phase II randomized double-masked trial of pegaptanib, an anti-vascular endothelial growth factor aptamer, for diabetic macular edema. Ophthalmology 112:1747–1757 [DOI] [PubMed] [Google Scholar]
- 20.Research B. (2013). Aptamers market—technology trend analysis by applications—therapeutics, diagnostics, biosensors, drug discovery, biomarker discovery, research applications with market landscape analysis—global forecasts to 2018. Available at www.marketsandmarkets.com
- 21.Ng EW. and Adamis AP. (2006). Anti-VEGF aptamer (pegaptanib) therapy for ocular vascular diseases. Ann N Y Acad Sci 1082:151–171 [DOI] [PubMed] [Google Scholar]
- 22.Ng EW, Shima DT, Calias P, Cunningham ET, Jr., Guyer DR, et al. (2006). Pegaptanib, a targeted anti-VEGF aptamer for ocular vascular disease. Nat Rev Drug Discov 5:123–132 [DOI] [PubMed] [Google Scholar]
- 23.Tolentino MJ, Dennrick A, John E. and Tolentino MS. (2014). Drugs in phase II clinical trials for the treatment of age-related macular degeneration. Expert Opin Investig Drugs:24:183–199 [DOI] [PubMed] [Google Scholar]
- 24.Biesecker G, Dihel L, Enney K. and Bendele RA. (1999). Derivation of RNA aptamer inhibitors of human complement C5. Immunopharmacology 42:219–230 [DOI] [PubMed] [Google Scholar]
- 25.Mallikaratchy PR, Ruggiero A, Gardner JR, Kuryavyi V, Maguire WF, et al. (2011). A multivalent DNA aptamer specific for the B-cell receptor on human lymphoma and leukemia. Nucleic Acids Res 39:2458–2469 [DOI] [PMC free article] [PubMed] [Google Scholar]
- 26.Soundararajan S, Chen W, Spicer EK, Courtenay-Luck N. and Fernandes DJ. (2008). The nucleolin targeting aptamer AS1411 destabilizes Bcl-2 messenger RNA in human breast cancer cells. Cancer Res 68:2358–2365 [DOI] [PubMed] [Google Scholar]
- 27.Girvan AC, Teng Y, Casson LK, Thomas SD, Juliger S, et al. (2006). AGRO100 inhibits activation of nuclear factor-kappaB (NF-kappaB) by forming a complex with NF-kappaB essential modulator (NEMO) and nucleolin. Mol Cancer Ther 5:1790–1799 [DOI] [PubMed] [Google Scholar]
- 28.Zhang X, Zhang J, Ma Y, Pei X, Liu Q, et al. (2014). A cell-based single-stranded DNA aptamer specifically targetsgastric cancer. Int J Biochem Cell Biol 46:1–8 [PubMed] [Google Scholar]
- 29.Iwamura T, Katsuki T. and Ide K. (1987). Establishment and characterization of a human pancreatic cancer cell line (SUIT-2) producing carcinoembryonic antigen and carbohydrate antigen 19–9. Jpn J Cancer Res 78:54–62 [PubMed] [Google Scholar]
- 30.Tsao SW, Mok SC, Fey EG, Fletcher JA, Wan TS, et al. (1995). Characterization of human ovarian surface epithelial cells immortalized by human papilloma viral oncogenes (HPV-E6E7 ORFs). Exp Cell Res 218:499–507 [DOI] [PubMed] [Google Scholar]
- 31.Zhan SB. and Zeng Y. (2013). [Recent progress on SELEX and its applications]. Bing Du Xue Bao 29:573–577 [PubMed] [Google Scholar]
- 32.Daniels DA, Chen H, Hicke BJ, Swiderek KM. and Gold L. (2003). A tenascin-C aptamer identified by tumor cell SELEX: systematic evolution of ligands by exponential enrichment. Proc Natl Acad Sci U S A 100:15416–15421 [DOI] [PMC free article] [PubMed] [Google Scholar]
- 33.Buick RN, Pullano R. and Trent JM. (1985). Comparative properties of five human ovarian adenocarcinoma cell lines. Cancer Res 45:3668–3676 [PubMed] [Google Scholar]
- 34.Abouzeid AH, Patel NR. and Torchilin VP. (2014). Polyethylene glycol-phosphatidylethanolamine (PEG-PE)/vitamin E micelles for co-delivery of paclitaxel and curcumin to overcome multi-drug resistance in ovarian cancer. Int J Pharm 464:178–184 [DOI] [PMC free article] [PubMed] [Google Scholar]
- 35.Furlong MT, Hough CD, Sherman-Baust CA, Pizer ES. and Morin PJ. (1999). Evidence for the colonic origin of ovarian cancer cell line SW626. J Natl Cancer Inst 91:1327–1328 [DOI] [PubMed] [Google Scholar]
- 36.Hennessy BT, Coleman RL. and Markman M. (2009). Ovarian cancer. Lancet 374:1371–1382 [DOI] [PubMed] [Google Scholar]
- 37.Beaufort CM, Helmijr JC, Piskorz AM, Hoogstraat M, Ruigrok-Ritstier K, et al. (2014). Ovarian cancer cell line panel (OCCP): clinical importance of in vitro morphological subtypes. PLoS One 9:e103988. [DOI] [PMC free article] [PubMed] [Google Scholar]
- 38.Herfs M, Yamamoto Y, Laury A, Wang X, Nucci MR, et al. (2012). A discrete population of squamocolumnar junction cells implicated in the pathogenesis of cervical cancer. Proc Natl Acad Sci U S A 109:10516–10521 [DOI] [PMC free article] [PubMed] [Google Scholar]
- 39.Masiakos PT, MacLaughlin DT, Maheswaran S, Teixeira J, Fuller AF Jr., et al. (1999). Human ovarian cancer, cell lines, and primary ascites cells express the human Mullerian inhibiting substance (MIS) type II receptor, bind, and are responsive to MIS. Clin Cancer Res 5:3488–3499 [PubMed] [Google Scholar]
- 40.Saad AF, Hu W. and Sood AK. (2010). Microenvironment and pathogenesis of epithelial ovarian cancer. Horm Cancer 1:277–290 [DOI] [PMC free article] [PubMed] [Google Scholar]
- 41.Crum CP, Drapkin R, Kindelberger D, Medeiros F, Miron A, et al. (2007). Lessons from BRCA: the tubal fimbria emerges as an origin for pelvic serous cancer. Clin Med Res 5:35–44 [DOI] [PMC free article] [PubMed] [Google Scholar]
- 42.Bell C, Lynam E, Landfair DJ, Janjic N. and Wiles ME. (1999). Oligonucleotide NX1838 inhibits VEGF165-mediated cellular responses in vitro. In Vitro Cell Dev Biol Anim 35:533–542 [DOI] [PubMed] [Google Scholar]
- 43.Ruckman J, Green LS, Beeson J, Waugh S, Gillette WL, et al. (1998). 2′-Fluoropyrimidine RNA-based aptamers to the 165-amino acid form of vascular endothelial growth factor (VEGF165). Inhibition of receptor binding and VEGF-induced vascular permeability through interactions requiring the exon 7-encoded domain. J Biol Chem 273:20556–20567 [DOI] [PubMed] [Google Scholar]
- 44.Bates PJ, Kahlon JB, Thomas SD, Trent JO. and Miller DM. (1999). Antiproliferative activity of G-rich oligonucleotides correlates with protein binding. J Biol Chem 274:26369–26377 [DOI] [PubMed] [Google Scholar]
- 45.Ireson CR. and Kelland LR. (2006). Discovery and development of anticancer aptamers. Mol Cancer Ther 5:2957–2962 [DOI] [PubMed] [Google Scholar]
- 46.Van Simaeys D, Lopez-Colon D, Sefah K, Sutphen R, Jimenez E, et al. (2010). Study of the molecular recognition of aptamers selected through ovarian cancer cell-SELEX. PLoS One 5:e13770. [DOI] [PMC free article] [PubMed] [Google Scholar]
- 47.Cerchia L, Esposito CL, Camorani S, Rienzo A, Stasio L, et al. (2012). Targeting Axl with an high-affinity inhibitory aptamer. Mol Ther 20:2291–2303 [DOI] [PMC free article] [PubMed] [Google Scholar]
- 48.Tang Z, Shangguan D, Wang K, Shi H, Sefah K, et al. (2007). Selection of aptamers for molecular recognition and characterization of cancer cells. Anal Chem 79:4900–4907 [DOI] [PubMed] [Google Scholar]
- 49.Shangguan D, Meng L, Cao ZC, Xiao Z, Fang X, et al. (2008). Identification of liver cancer-specific aptamers using whole live cells. Anal Chem 80:721–728 [DOI] [PubMed] [Google Scholar]
Associated Data
This section collects any data citations, data availability statements, or supplementary materials included in this article.