

SUMMARY
Functional heterogeneity within tumors presents a significant therapeutic challenge. Here we show that quiescent, therapy-resistant Sox2+ cells propagate sonic hedgehog subgroup medulloblastoma by a mechanism that mirrors a neurogenic program. Rare Sox2+ cells produce rapidly cycling doublecortin+ progenitors that, together with their postmitotic progeny expressing NeuN, comprise tumor bulk. Sox2+ cells are enriched following anti-mitotic chemotherapy and Smoothened inhibition, creating a reservoir for tumor regrowth. Lineage traces from Sox2+ cells increase following treatment, suggesting that this population is responsible for relapse. Targeting Sox2+ cells with the antineoplastic mithramycin abrogated tumor growth. Addressing functional heterogeneity and eliminating Sox2+ cells presents a promising therapeutic paradigm for treatment of sonic hedgehog subgroup medulloblastoma.
INTRODUCTION
Medulloblastoma (MB) arises in the cerebellum and is the most common malignant pediatric brain tumor. Aggressive yet nonspecific multimodal therapy has significantly improved MB outcomes but leaves survivors with debilitating secondary sequelae (Crawford et al., 2007). Cases of disease relapse are almost uniformly fatal (Zeltzer et al., 1999). It is essential to define the mechanism of tumor growth and relapse to develop tailored therapies to selectively ablate cells responsible for MB expansion and recurrence while sparing the developing brain.
Medulloblastoma was named for its histological similarity to the embryonic brain (Bailey and Cushing, 1925) and exhibits significant intratumoral heterogeneity. The constituent MB cell types heterogeneously express stem, astroglial, and neuronal markers, with each population’s contribution to tumor expansion unclear. Although both mouse and human MBs are functionally heterogeneous for the ability to self-renew in tumor-propagating cell assays, whether the transplantable cells drive primary tumor growth and relapse in situ remains unresolved (Read et al., 2009; Singh et al., 2004; Ward et al., 2009). Recently, the cancer stem cell hypothesis was tested using genetic lineage tracing of primary tumors in mouse models of colon adenocarcinoma and squamous skin cancer (Driessens et al., 2012; Schepers et al., 2012). Both studies found that developmental hierarchies were preserved in tumors that were dependent upon the proliferation of stem-like cells for continued expansion. These results suggest that the stem cell hierarchies inferred from transplantation studies exist in primary cancers, but this remains unsubstantiated (Meacham and Morrison, 2013).
Transient withdrawal from the cell cycle into a quiescent state is a defining characteristic of many somatic stem cells, including neural stem cells (Li and Clevers, 2010). Quiescent, self-renewing cancer cells have been identified in several malignancies (Guan et al., 2003; Holyoake et al., 1999; Roesch et al., 2010; Saito et al., 2010) and are often resistant to conventional chemotherapy and radiation, thus acting as a reservoir for recurrence. A prior study reported that MB cells expressing the neural stem cell marker nestin withdraw from the cell cycle in response to radiation, although their tumor-propagating capacity was not defined (Hambardzumyan et al., 2008). This study suggests that the self-renewing MB population may be quiescent, but proliferative heterogeneity and the detailed definition of lineage relationships between heterogeneous MB cell types and their links to self-renewal were not explored.
Medulloblastomas comprise four clinically and molecularly distinct subgroups (Northcott et al., 2012). Thirty percent of MB diagnoses present aberrant sonic hedgehog (SHH) signaling because of loss of function in negative regulators, including PTCH1 and SUFU, activating mutations in positive transducers such as SMO, and amplifications in transcriptional effectors like GLI2 (Northcott et al., 2012). SHH pathway inhibitors are entering MB clinical trials to define subgroup-specific therapy, but laboratory and clinical reports of resistance suggest that an insensitive cell type may be spared (Kool et al., 2014; LoRusso et al., 2011; Rudin et al., 2009; Yauch et al., 2009).
Here we dissect SHH subgroup MB heterogeneity at the cellular level to investigate the principles of tumor expansion and their clinical implications.
RESULTS
Ptc Medulloblastoma Resembles a Dysregulated Neurogenic System
We studied the irradiated Ptch1+/−− (Ptc) mouse model of SHH subgroup MB (Goodrich et al., 1997), where postnatal day 0 irradiation increases tumor incidence from 20% to more than 80% (Pazzaglia et al., 2006). Characterization of these tumors’ phenotypic heterogeneity by immunohistochemistry revealed the ectopic expression of stem and progenitor markers reminiscent of the developing cerebellum. Cells expressing the neural stem cell markers Sox2 and nestin were relatively rare, with Sox2+ cells comprising less than 5% of the tumor (Figure 1A; Figure S1A available online). The rarity of Sox2+ cells was confirmed in a number of other Ptc tumor models (Figure S1B). Cells expressing glial-fibrillary acidic protein (GFAP) were found throughout the tumor (Figure S1C). The neural progenitor marker doublecortin (DCX) was expressed by approximately 60% of all cells (Figure 1A). Neuronal nuclei (NeuN), normally expressed by nascent and mature neurons, was found in 30% of cells, exhibiting some overlap with DCX, as occurs in cerebellar neurogenesis (Figure 1A; Figure S1D) (Hatten and Roussel, 2011). Sox2+ cells are mutually exclusive from DCX+ and NeuN+ cells (Figures S1E and S1F). Mature markers of cerebellar neuronal subtypes, including granule neurons, interneurons, and Purkinje cells, were not detectable within the tumor, reflecting a lack of terminal differentiation in this malignancy (Figures S1G–S1P).
Figure 1. Sox2+ Ptc MB Cells Are Quiescent.
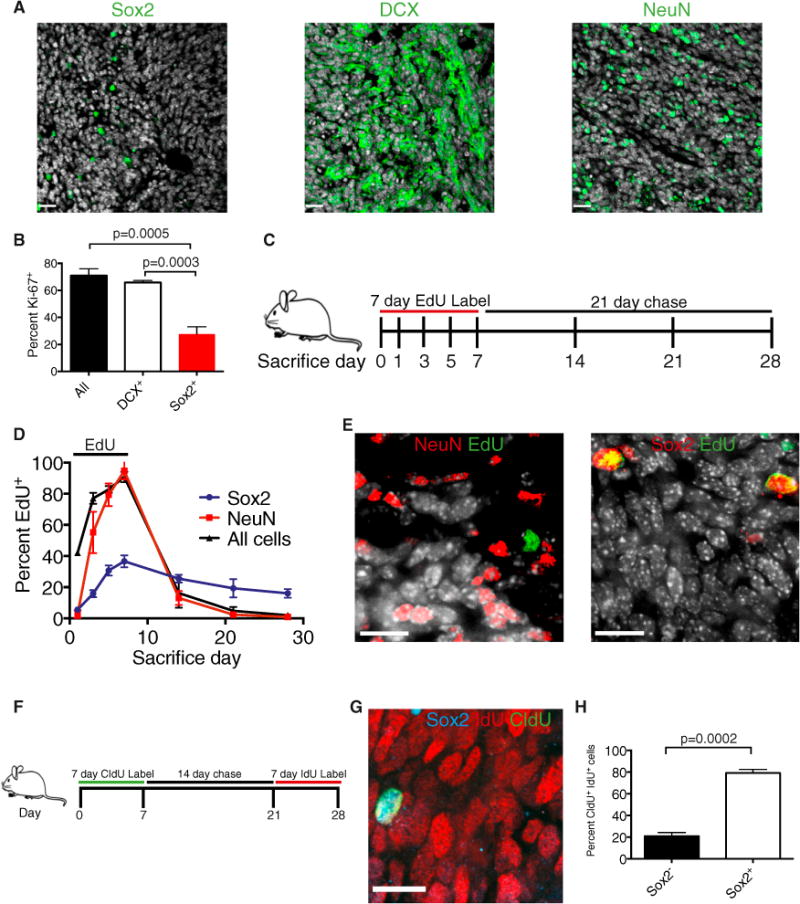
(A) Representative images of Ptc MB containing Sox2+ cells (<5%), DCX-expressing cells (60%), and NeuN-expressing cells (30%). DAPI is shown in white. Scale bars, 25 μm.
(B) Frequency of Ki67 expression in primary tumor cells: all counts, DCX+ cells, and Sox2+ cells (n = 3, mean ± SEM, two-tailed unpaired t test).
(C) Experimental design for (D) and (E). 31-day-old Ptc mice were administered 0.82 mg/mL EdU drinking water for 7 days (experimental days 0–7), followed by a 21-day chase. Mice were sacrificed on the indicated days of label or chase.
(D) The frequency of all EdU+ cells as well as NeuN+ and Sox2+ cells that are also EdU+ was quantified from primary tumor sections throughout the labeling and chase (n = 3 per group, mean ± SEM).
(E) Representative immunofluorescence images at the end of the chase (day 28). DAPI is shown in white. Scale bars, 14 μm.
(F) Experimental design for (G) and (H). 31-day-old Ptc mice were administered (0.74 mg/ml) CldU drinking water for 7 days, returned to normal drinking water for 2 weeks, and were then administered (1 mg/ml) IdU drinking water for 7 days. Mice were sacrificed at the end of the IdU labeling (day 28).
(G) A representative immunofluorescence image of a Sox2+ cell that retained the CldU label and acquired IdU. Scale bar, 14 μm.
(H) The frequency of Sox2-expressing cells within the CldU+ IdU+ population at day 28 (n = 3 per group, mean ± SEM, two-tailed unpaired t test). See also Figure S1.
Sox2-Expressing Cells Are Quiescent Compared with Rapidly Cycling Tumor Bulk
In many tissues, the cells with the greatest capacity for growth are cycling slowly. To address proliferative heterogeneity in Ptc MB, we detected Ki67 using flow cytometry of primary tumor cells and found that most cells and the majority of DCX+ cells were Ki67+ and, therefore, cycling. In contrast, Sox2+ cells were largely Ki67− and, thus, could be a quiescent population (Figure 1B). We then used a chronic thymidine analog label-chase experiment as a functional assay to define tumor-proliferative dynamics. Five-week-old mice were administered drinking water containing 5-ethynyl-2′deoxyuridine (EdU) for 7 days and sacrificed on successive days of the label and a 21-day chase (Figure 1C). As a whole, tumors rapidly acquired and diluted the EdU label, confirming a high degree of cell proliferation and turnover (Figure 1D). At the end of 7 days, nearly 90% of tumor cells were EdU+. With a delay relative to all tumor cells, NeuN+ cells also labeled extensively but did not retain EdU throughout the chase period because of label dilution or cell loss (Figures 1D and 1E). Interestingly, Sox2+ cells acquired EdU more slowly, labeled to a lesser extent, and maintained the label longer throughout the chase, all of which are characteristic of a quiescent cell population (Figures 1D and 1E). To determine whether Sox2+ cells cycle continually, mice were subjected to a pulse-chase-pulse regimen of 7 days of 5-chloro-2′-deoxyuridine (CldU) drinking water, 2-week chase, and 7 days of drinking water containing 5-iodo-2′-deoxyuridine (IdU) (Figure 1F). Slowly cycling cells were marked with both CldU and IdU, having retained the first label (CldU), and divided at least once during the week of IdU labeling prior to sacrifice. Only rare cells (<0.5%) were positive for both proliferative markers, but nearly all double-labeled cells were Sox2+, confirming this population to be continuously cycling slowly and not merely label retaining (Figures 1G and 1H). Less than 10% of Sox2+ cells were double labeled, having divided during the initial CldU pulse and again during the 7 days prior to sacrifice.
NeuN+ cells Are the Short-Lived Progeny of DCX+ Cells
NeuN+ cells were almost uniformly Ki67− (Figure S2), a finding that was inconsistent with their EdU labeling kinetics. To address this, we injected Ptc mice with a single dose of EdU to birthdate a cohort of dividing cells and sacrificed the mice at successive time points thereafter to follow the EdU marker in a lineage trace (Figure 2A). Immediately after injection, the EdU label was found almost exclusively in the DCX+ population, with only rare Sox2+ cells labeled (Figures 2B and 2C). Virtually no NeuN+ cells were labeled at 3 hr postinjection. Thus, few cells in this population were passing through S phase (Figures 2B and 2D). Indeed, the EdU label was not detected in NeuN-expressing cells until 3 days postinjection, when the absolute number of labeled cells and EdU+ DCX+ cells was decreasing (Figures 2B and 2D). This suggests that NeuN+ cells inherit the EdU label from DCX+ cells that differentiate and begin to express NeuN as they exit the cell cycle, establishing a lineage relationship between these populations. Differentiated NeuN+ MB cells are the progeny of DCX+ progenitor-like tumor cells, produced in a pattern similar to the one that occurs in cerebellar development (Hatten and Roussel, 2011). The frequency of labeled Sox2+ cells decreased minimally throughout the chase, consistent with their quiescent status (Figure 2B).
Figure 2. NeuN+ Cells Are the Short-Lived, Differentiated Progeny of Cycling DCX+ Cells.
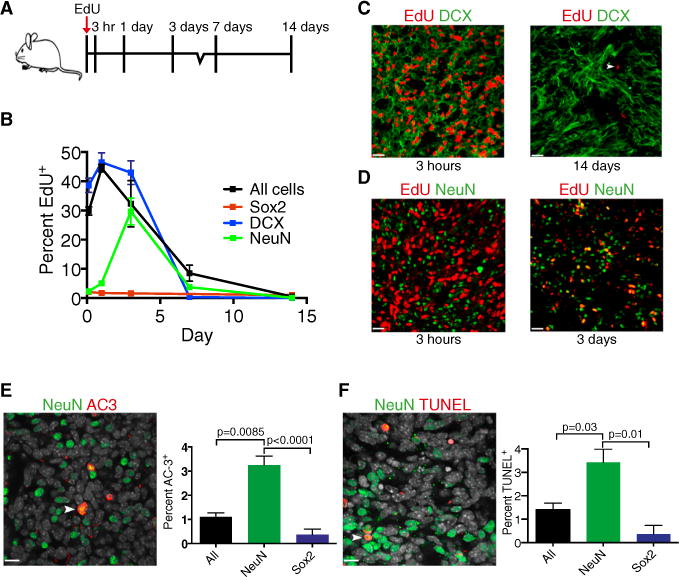
(A) Experimental design for (B–D). Ptc mice were injected with 30 mg/kg EdU and sacrificed at successive time points thereafter.
(B) The frequency of all EdU+ cells as well as DCX+, NeuN+, and Sox2+ cells that were also EdU+ was quantified in primary tumor sections at each postinjection time point (n = 3 per group, mean ± SEM).
(C) Representative immunofluorescence images of DCX and EdU at 3 hr and 14 days postinjection. The arrowhead indicates a rare EdU+ label-retaining cell. Scale bars, 20 μm.
(D) Representative immunofluorescence images of NeuN and EdU at 3 hr and 3 days postinjection. Scale bars, 20 μm.
(E) Representative image of activated caspase 3+ (AC3) NeuN+ cells (arrowhead). The frequency of AC3 events in all cells, NeuN+ cells, and Sox2+ primary tumor cells is quantified (n = 3 [all], n = 3 [Sox2], n = 8 [NeuN], mean ± SEM, two-tailed unpaired t test [NeuN versus all and NeuN versus Sox2]). DAPI is shown in white. Scale bars, 14 μm.
(F) Representative image of TUNEL staining in NeuN+ cells (arrowhead). The frequency of TUNEL events in all, NeuN+ cells, and Sox2+ primary tumor cells is quantified (n = 3 per group, mean ± SEM, two-tailed unpaired t test [NeuN versus all and NeuN versus Sox]). DAPI is shown in white. Scale bars, 14 μm.
See also Figure S2.
As in the chronic EdU label-chase experiment, the frequency of labeled NeuN+ cells dropped precipitously following their peak labeling at chase day 3 (Figure 2B). A decrease in the frequency of labeled cells in a population can be attributed to a combination of label dilution through cell division, cell replacement by newborn cells, and cell loss. Because NeuN+ cells are Ki67− and do not exhibit linear labeling kinetics, we hypothesized that cell loss is a principal cause of the decrease in the frequency of EdU+ NeuN+ cells. We found that the levels of apoptosis, as assessed by activated caspase 3 and TUNEL staining, are significantly higher in NeuN+ cells when compared to all tumor cells or Sox2+ cells (Figures 2E and 2F). Together, these data confirm the slow-cycling longevity of Sox2+ cells and suggest that NeuN+ cells, comprising nearly one third of the tumor, are the short-lived, postmitotic progeny of the DCX+-amplifying progenitor population.
Tumor-Propagating Cells Express Sox2
Many quiescent stem cell populations, including Sox2-expressing neural stem cells, exhibit greater self-renewal than their proliferating progeny. To determine whether Sox2+ MB cells self-renew in tumor-propagating cell assays, we crossed Sox2-eGFP reporter mice to the Ptc MB model for functional analysis, specifically marking Sox2+ cells with GFP (Figure S3). Sox2-expressing cells were isolated as a discrete eGFPhigh population from primary tumors depleted of microglia, leukocytes, and red blood cells (Figure 3A). On average, CD15/Lewis-x/SSEA-1 marks 40% of Ptc tumor cells and can be used to enrich cells with a tumor-propagating capacity (Read et al., 2009; Ward et al., 2009). More than 80% of Sox2+ cells are CD15+, and Sox2+ cells comprise a minority (<10%) of the CD15+ population (Figures 3B and 3C). We initially measured self-renewal using an in vitro colony-forming assay performed at limiting dilutions and found that Sox2+ cells were significantly enriched for colony-forming ability (Figure 3D). The current gold standard for tumor cell self-renewal is to perform orthotopic allografts at limiting dilutions in immunodeficient mice. In our in vivo limiting dilution analysis (LDA), primary Sox2+ cells exhibited a significantly higher tumor-propagating potential than the Sox2− cells comprising the tumor bulk (p < 0.001) (Figure 3E). Sox2− cells exhibited a limited self-renewal capacity, reliably forming tumors only at the highest cell dose injected (Figure 3E). Importantly, subclonal dilutions of uniform Sox2+ cells recapitulated the heterogeneity of the primary tumors from which they were derived, containing rare Sox2+ cells and abundant DCX+ and NeuN+ cells (Figures 3F–3I). Therefore, Sox2+ cells both self-renew and differentiate in vivo and are MB-propagating cells (MPCs).
Figure 3. Sox2+ MB Cells Are Tumor Propagating.
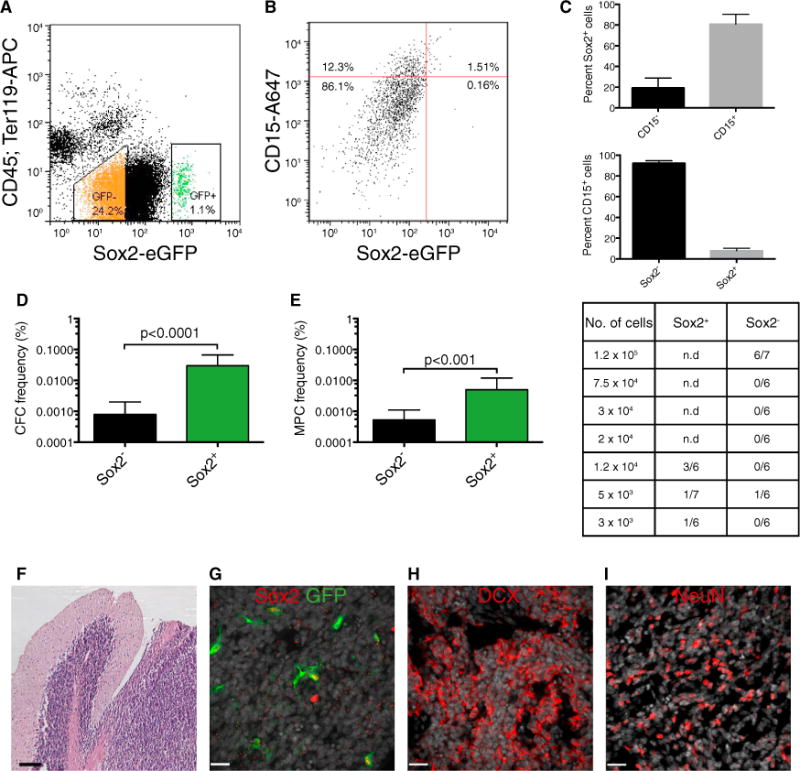
(A) Representative gating scheme with typical GFP+ and GFP− frequencies for FACS of a Ptc; Sox2-eGFP tumor depleted for cells expressing CD45 or Ter-119.
(B) Typical FACS plot showing CD15+ and Sox2+ cell frequencies in primary Ptc; Sox2-eGFP tumor cells.
(C) Breakdown of Sox2+ cells by their expression of CD15 (top) and CD15+ cells by their expression of Sox2 (bottom) (n = 3 per group, mean ± SEM). n.d., no data.
(D) In vitro limiting dilution analysis comparing colony-forming cell (CFC) frequency in primary Sox2+ and Sox2− Ptc tumor cells. (estimate plus upper limit, χ2 = 34.0, p < 0.0001).
(E) In vivo limiting dilution analysis comparing medulloblastoma-propagating cell (MPC) frequency of primary Sox2+ and Sox2− Ptc tumor cells. A summary of the frequency of allograft formation at each cell dose injected is shown at the right (estimate plus upper limit, χ2 = 11.1, p < 0.001).
(F) Representative hematoxylin and eosin stain of an allograft tumor derived from Sox2-eGFP+ cells. Scale bar, 100 μm.
(G) Representative Sox2 and GFP colocalization in an allograft tumor derived from Sox2-eGFP+ cells. DAPI is shown in white. Scale bar, 20 μm.
(H and I) Representative DCX (H) and NeuN (I) expression in an allograft tumor derived from Sox2-eGFP+ cells. DAPI is shown in white. Scale bar, 20 μm.
See also Figure S3.
Lineage Tracing Confirms That Sox2+ Cells Are Tumor-Propagating
Genetic lineage tracing has recently been used to demonstrate the hierarchical nature of squamous skin tumors and intestinal adenomas (Driessens et al., 2012; Schepers et al., 2012). One outstanding question is whether cells from tumors manipulated ex vivo that transplant malignancies in immunodeficient mice also sustain primary tumor growth. To determine whether Sox2+ cells self-renew and differentiate in situ in primary tumors, we crossed Sox2-creERT2 (Arnold et al., 2011) and Rosa26 CAG-loxP-stop-loxP-tdTomato mice to Ptc mice to genetically mark Sox2+ tumor cells upon administration of tamoxifen (Figure 4A). To define the lineage of Sox2+ cells, 6-week-old mice were administered a single 5-mg dose of tamoxifen and sacrificed on successive days thereafter. Recombination was initially highly specific to Sox2-expressing cells (Figure S4). The frequency of marked Sox2+ cells remained constant throughout the tracing period, confirming that this population is self-renewing (Figure 4B). Over time, the frequency of tdTomato+ tumor cells increased progressively until, after 6 weeks, nearly one-third of tumor cells were positive and, thus, derived from the Sox2+ cells marked at the time of injection (Figures 4C and 4D). At 21 days post-tamoxifen, tdTomato expression was maintained in the Sox2+ fraction and also observed in cells expressing the neuronal markers DCX, βIII-tubulin, and NeuN as well as in cells expressing the glial markers GFAP or S100-β (Figures 5A–5D; Figure S5). Therefore, rare Sox2+ cells both self-renew and differentiate into the fast-dividing progenitor-like cells and postmitotic neuron-like cells that comprise the majority of the tumor. The frequency of tdTomato+ cells expressing NeuN increased with similar kinetics to tumor labeling, suggesting that tumor growth mimics neurogenesis (Figure 5E). Collectively, these data support a model for MB growth in primary tumors and allografts driven by self-renewing Sox2+ cells.
Figure 4. Sox2+ Cells Propagate Ptc MBs In Situ.
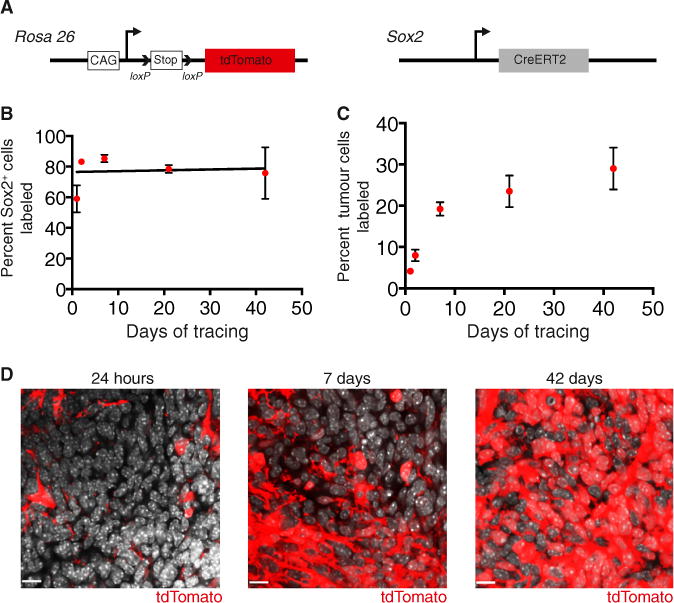
(A) To perform lineage tracing in MB, mice with a loxP-stop-loxP tdTomato reporter gene at the Rosa 26 locus and Sox2creER knock in mice were crossed to the Ptc model.
(B) Quantification of the frequency of cells labeled with tdTomato within the Sox2+ tumor population following a 5 mg tamoxifen injection (n = 3–5 per time point, mean ± SEM).
(C) Quantification of tdTomato labeling of tumor cells following a 5 mg tamoxifen injection (n = 4–6 per time point, mean ± SEM).
(D) Representative images of tumor labeling with tdTomato at 24 hr, 7 days, and 42 days post-tamoxifen. DAPI is shown in white. Scale bar, 11 μm.
See also Figure S4.
Figure 5. Sox2+ Cells Self-renew and Differentiate to grow Ptc MB.
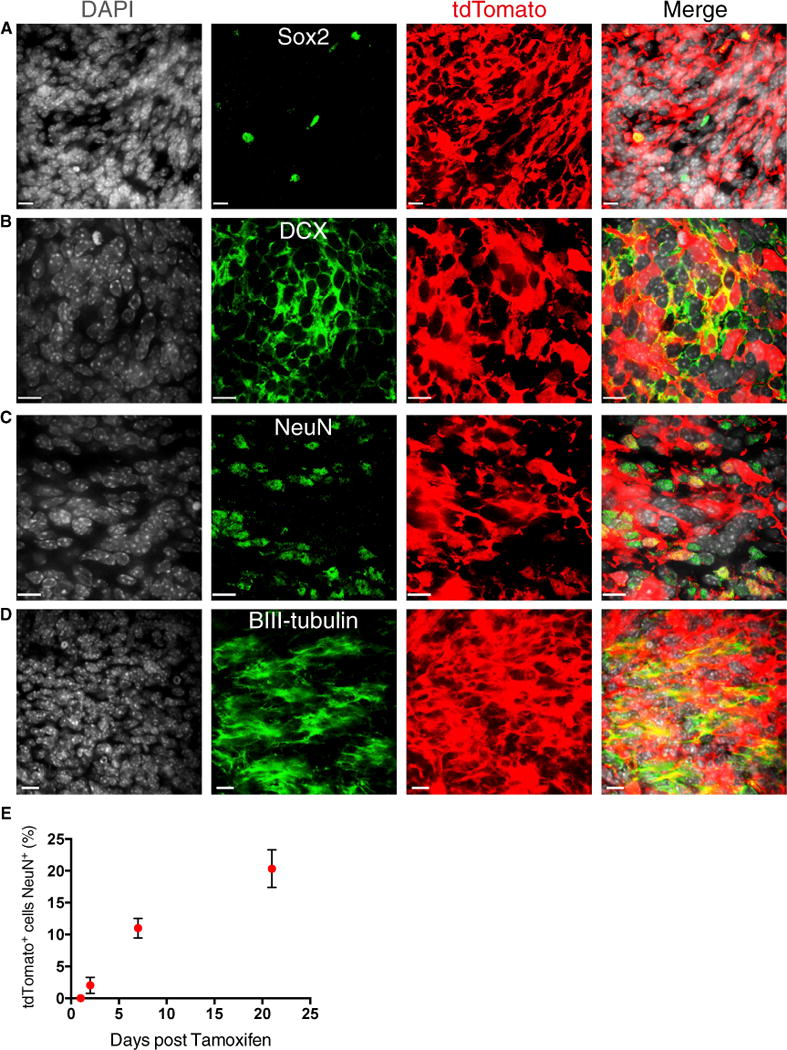
(A–D) Representative image of tdTomato labeled Sox2+ (A), DCX+ (B), NeuN+ (C), and βIII-tubulin+ (D) cells at 21 days of tracing. Scale bars, 11 μm.
(E) The fraction of tdTomato+ tumor cells that are NeuN+ increases over time (n = 3 per time point, mean ± SEM). Scale bars, 11 μm.
See also Figure S5.
MPCs Are Enriched following Antimitotic and Shh-Targeted Therapy
Conventional therapies ablate the majority of acute myeloid leukemia (AML) cells and control the disease burden but spare quiescent leukemia-initiating cells, the believed source of relapse (Saito et al., 2010). To test the effects of antimitotic therapy on primary MBs, 70-day-old tumor-bearing mice were infused intracranially with saline vehicle or 2% Ara-C (cytarabine) for 5 days and injected with EdU 3 hr prior to sacrifice (Figure 6A). Ara-C is an S phase-specific chemotherapy agent that has been administered intrathecally to MB patients and to mice in prior studies of quiescent neural stem cells (Doetsch et al., 1999; Partap et al., 2011). EdU incorporation 3 hr post-treatment was reduced significantly in Ara-C-treated mice, indicating the successful targeting of mitotic cells (Figure 6B; Figure S6A). Interestingly, the frequency of Sox2+ tumor cells increased significantly after mitotic inhibition (Figure 6C; Figure S6B). Together, these results show that MPCs are resistant to antimitotic therapy and suggest that they may act as a reservoir for disease relapse.
Figure 6. MPCs Are Enriched following Antimitotic Chemotherapy and Smoothened Inhibition.
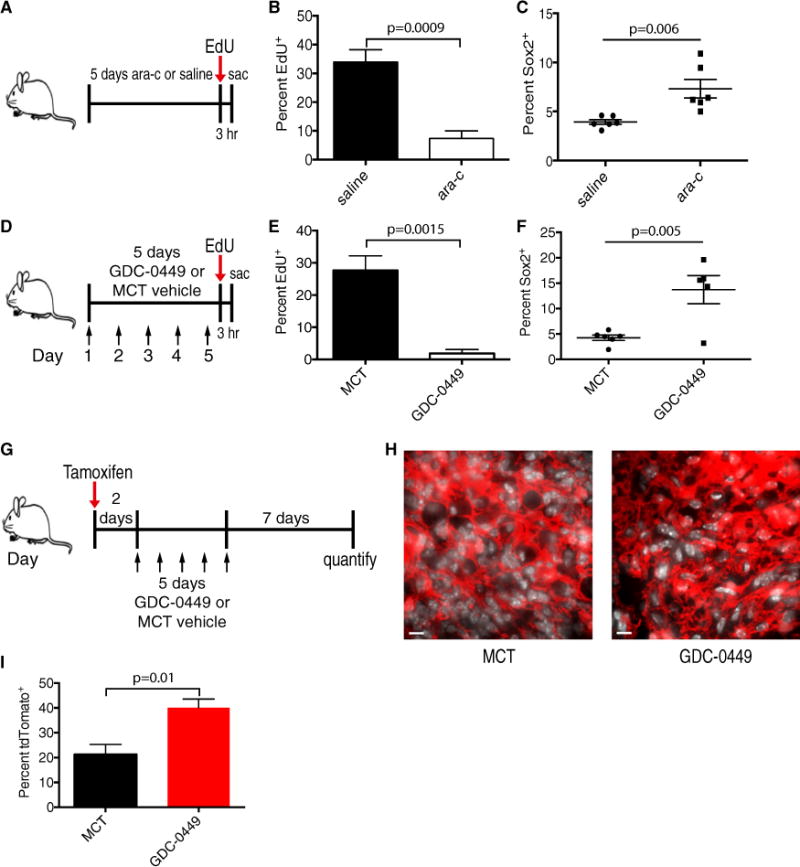
(A) Day 70 Ptc mice were administered 2% Ara-C or saline vehicle intracranially bymicro-osmotic pump for 5 days and then injected with 30 mg/kg EdU 3 hr prior to sacrifice (sac) on treatment day 5.
(B) Quantification of EdU incorporation in saline- and Ara-C-treated Ptc tumors (n = 4 per group, mean ± SEM, two-tailed unpaired t test).
(C) Quantification of Sox2+ cell frequency in saline and Ara-C treated Ptc tumors (n = 6 per group, mean ± SEM, two-tailed unpaired t test).
(D) Day 70 Ptc mice were administered methylcellulose Tween 80 (methylcellulose Tween [MCT]) vehicle or 50 mg/kg GDC-0449 once daily for 5 days (arrows) and injected with 30 mg/kg EdU 3 hr prior to sacrifice.
(E) Quantification of EdU incorporation in MCT- and GDC-0449-treated tumors (n = 5 per group, mean ± SEM, two-tailed unpaired t test).
(F) Quantification of Sox2+ cell frequency in MCT- and GDC-0449-treated tumors (n = 5 per group, mean ± SEM, two-tailed unpaired t test).
(G) Day70 Ptc; Sox2creER; loxP-stop-loxP tdTomato mice were administered tamoxifen 48 hr prior toa 5-day treatment with 50 mg/kg GDC-0449 orMCT vehicle once daily (arrows) and were chased for 7 days post-therapy.
(H) Representative images of tdTomato labeling in MCT vehicle- or GDC-0449-treated tumors 7 days post-treatment. DAPI is shown in white. Scale bars, 40 μm.
(I) Quantification of (H) (n = 4 mice per group, mean ± SEM, two-tailed unpaired t test).
See also Figure S6.
GDC-0449 (vismodegib), an inhibitor of the SHH signaling transducer Smoothened, is used to treat basal cell carcinoma patients and is in clinical trials to abrogate dysregulated, oncogenic SHH signaling in MB and other SHH-driven cancers (Robarge et al., 2009). To examine the sensitivity of MPCs to GDC-0449, day 70 Ptc mice were treated once daily with GDC-0449 or vehicle for 5 days and injected with EdU 3 hr prior to sacrifice (Figure 6D; Figures S6C and S6D). EdU incorporation was abolished in GDC-0449-treated tumors (Figure 6E and Figure S6E), indicating a dependence of proliferating tumor cells on Shh signaling. GDC-0449 treatment also increased apoptosis and decreased the frequency of DCX+ cells (Figures S6G and S6H). Accordingly, Sox2+ cells were significantly enriched in the residual tumors (Figure 6F; Figure S6F).
To exclude the possibility that therapy induces the expression of Sox2 and to test the contribution of MPCs to tumor regrowth, we performed lineage traces in vehicle- and GDC-0449-treated Ptc mice (Figure 6G). Tumor-bearing mice were injected with tamoxifen to genetically mark Sox2+ cells 48 hr prior to a 5-day course of GDC-0449 or vehicle treatment and sacrificed 7 days after the final dose. Tumors from GDC-0449-treated mice contained significantly higher frequencies (40 ± 3.5 versus 21 ± 4%, p = 0.01) of tdTomato+ cells, indicating that cells expressing Sox2 prior to treatment are selected by Smoothened inhibition (Figures 6H and 6I). Collectively, this indicates that MPCs are spared by therapies that target cycling cells in the tumor bulk and are likely responsible for tumor relapse following therapy.
MPCs Express a Quiescent Stem Cell Gene Signature
To investigate the biology of MPCs, we sorted Sox2+ and Sox2− cells from primary Sox2-eGFP mouse tumors (Figure 3A) and compared the gene expression profiles of the two populations. Sox2+ and Sox2− derived samples clustered separately in a 3D principal component analysis, indicating nonoverlapping molecular profiles (Figure 7A). MPCs are, therefore, functionally and transcriptionally distinct from the tumor bulk. Sox2+ cells exhibited a distinct gene expression profile defined by differential expression of 628 genes (false directory rate (FDR), 0.05), including many expressed by neural stem cells such as Sox2, Gfap, Olig1, Olig2, Blbp, and Pdgfra (Figure 7B; Table S1). Genes encoding several CD15 carrier proteins, including Lrp1 and Ptprz1, were highly expressed in Sox2+ cells. Sox2− cells expressed a more differentiated gene expression profile, being significantly enriched for neuronal lineage genes, including Pax6, Atoh1, Dcx, Rbfox3 (NeuN), and Zic2 (Figure 7B; Table S1). Differential expression levels of several genes were confirmed by quantitative PCR analysis (Figure S7A).
Figure 7. Sox2+ MB Cells Have a Quiescent Stem Cell Gene Signature that Predicts a Poor Prognosis in Human SHH MB.
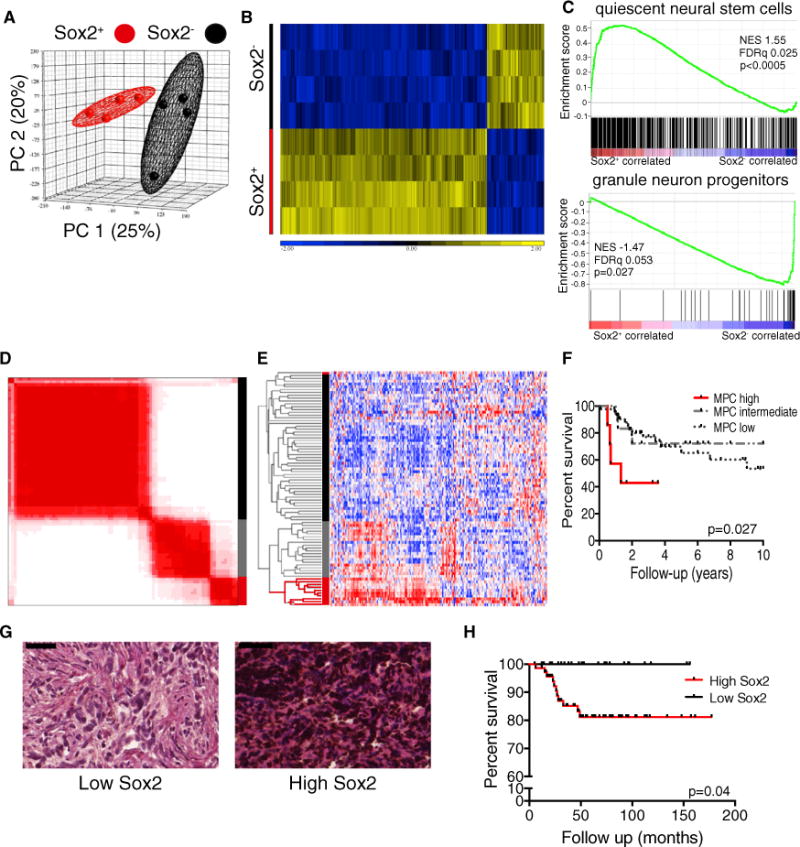
(A) Principle component analysis of gene expression profiles of primary Sox2+ and Sox2− Ptc cells (n = 4 per group).
(B) Hierarchical clustering of four matched primary Sox2+ and Sox2− samples based on the 628 genes expressed differentially between the two groups (one-way ANOVA, FDR < 0.05, fold change is shown).
(C) GSEA comparing Sox2+ and Sox2− cells for enrichment of a quiescent neural stem cell gene set (top) and a granule neuron progenitor gene set (bottom). NES, normalized enrichment score.
(D) Consensus clustering by k-means of 82 SHH subgroup MBs based on a mouse MPC gene signature yields three distinct groups.
(E) Hierarchical clustering of 82 SHH subgroup MBs based on a mouse MPC gene signature yields three identical groups to consensus clustering except for one outlier.
(F) Kaplan-Meier curve showing overall survival of patients with high, intermediate, or low expression of a MPC gene signature (n = 76, log rank test).
(G) Representative images from a tissue microarray of human MB samples exhibiting low and high frequency of SOX2+ cells. SOX2 reactivity was detected using 3,3′-diaminobenzidine (brown), and tissues were counterstained with hematoxylin and eosin. Scale bar, 50 μm.
(H) Kaplan-Meier curve showing overall survival of SHH MB patients with high or low frequencies of Sox2+ cells (n = 98, log rank test).
Interrogating Sox2+ and Sox2− expression profiles using both ingenuity pathway analysis and gene set enrichment analysis (GSEA) suggested no differences in Shh pathway activation between the two populations (data not shown). These results were confirmed by quantitative PCR analysis of Shh pathway target genes Gli1 and Hhip, which were expressed at similar levels in Sox2+ and Sox2− cells (Figure S7B). Therefore, Sox2+ cells exhibit active Shh signaling but are resistant to the Smoothened inhibitor GDC-0449.
Next, we used GSEA to investigate transcriptional similarities between MPCs expressing Sox2 and previously characterized quiescent cell populations. Sets of genes significantly upregulated in multiple quiescent stem cell populations, including neural stem cells (Martynoga et al., 2013), were highly enriched in Sox2-expressing cells (Figure 7C; Figure S7C). A gene set derived from rapidly cycling granule neuron progenitor cells (Li et al., 2013) was enriched significantly in the Sox2− population, confirming these cells’ proliferative and differentiated character (Figure 7C). Therefore, MPCs exhibit a quiescent stem cell gene signature and may utilize common molecular mechanisms to maintain their quiescence and self-renewal ability.
An MPC Signature Defines SHH MB Patients with a Poor Prognosis
For multiple malignancies, patients whose cancer exhibits a greater expression of stem cell genes have a significantly worse prognosis (Eppert et al., 2011; Liu et al., 2007; Merlos-Suárez et al., 2011; Zheng et al., 2013). To determine whether this was also true for MB, we derived a MPC gene signature from the human homologs of genes expressed significantly differentially in mouse MPCs (Figure 7B) and analyzed gene expression profiles from 83 SHH subgroup human MBs for their relative expression of these genes. Consensus clustering and unsupervised hierarchical clustering revealed three distinct groups with high, intermediate, and low levels of MPC signature expression (Figures 7D and 7E; Figures S7D and S7E). The three groups were highly reproducible between the two methods, with only one discordant case. Patients with tumors of the MPC high group comprised 12% percent of all SHH subgroup MBs and had a significantly worse prognosis (p = 0.03) than those in the MPC intermediate and low groups (Figure 7F; Figure S7F). Patients with a high expression of the MPC signature were significantly enriched for tumors with large cell anaplastic histology (Figure S7G).
To substantiate the correlation between the MPC signature and patient outcome, we assessed a clinically well annotated MB tissue microarray containing more than 300 primary tumor samples. The SOX2 protein level was classified in a semiquantitative fashion, segregating tumors in to two groups: high SOX2 and low SOX2 (Figure 7G). High SOX2-expressing tumors with 20% or greater immunoreactivity were significantly more common within SHH subgroup and group 3 MBs (Figure S7H). We found that high SOX2 expression was associated with significantly worse overall survival in SHH subgroup patients from this independent cohort (Figure 7H). Remarkably, no patients with low SOX2 immunoreactivity died during follow-up. Taken together, these findings indicate a clinical relevance for SOX2+ MB cells.
Targeting Sox2+ Cells in SHH MB
Our data suggest that targeting SOX2+ cells in SHH MB could improve patient outcome. To identify pharmaceuticals that affect SOX2+ cells, we turned to primary patient-derived cultures from human SHH MB tumors that uniformly express SOX2 when grown under serum-free conditions (Figure 8A). Human SHH MB cultures did not respond to GDC-0449 at therapeutically relevant doses (Figure 8B). Self-renewal of primary Ptc and two freshly resected human SHH MBs (M693 and M698) was not affected by 5 μM GDC-0449 in in vitro LDAs (Figure 8C–8E). Whole genome sequencing of M693 and RNA sequencing of M698 identified stereotyped activating mutations in the SHH pathway that are predicted to respond to GDC-0449 (Figures S8A and S8B), suggesting that cell type-specific drug responses may also occur in human tumors. We then screened our four human patient-derived SHH MB cultures with the 97-compound National Cancer Institute (NCI) oncology drug set in search of agents to which SOX2+ MB cells are sensitive. The top 15 hits (Figure 8F) included two aureolic acids, dactinomycin and mithramycin (MM). Because MM is known to cross the blood-brain barrier, it was prioritized for follow-up. Human SHH medulloblastoma primary cultures were sensitive to nano-molar concentrations of MM (Figure 8G). Similarly, 25 nM MM significantly inhibited sphere formation by primary Ptc cells, indicating a similar effectiveness against mouse cells (Figure 8H). Secondary sphere formation was abrogated in MM-treated Ptc cells even in the absence of drugs (Figure 8I). Strikingly, MM treatment prevented the growth of subcutaneous Ptc tumor allografts (Figure 8J). Drugs like MM, whose targets include SOX2+ cells, may present an effective therapeutic avenue for SHH MB.
Figure 8. SOX2+ Cells Can Be Targeted Using Mithramycin.
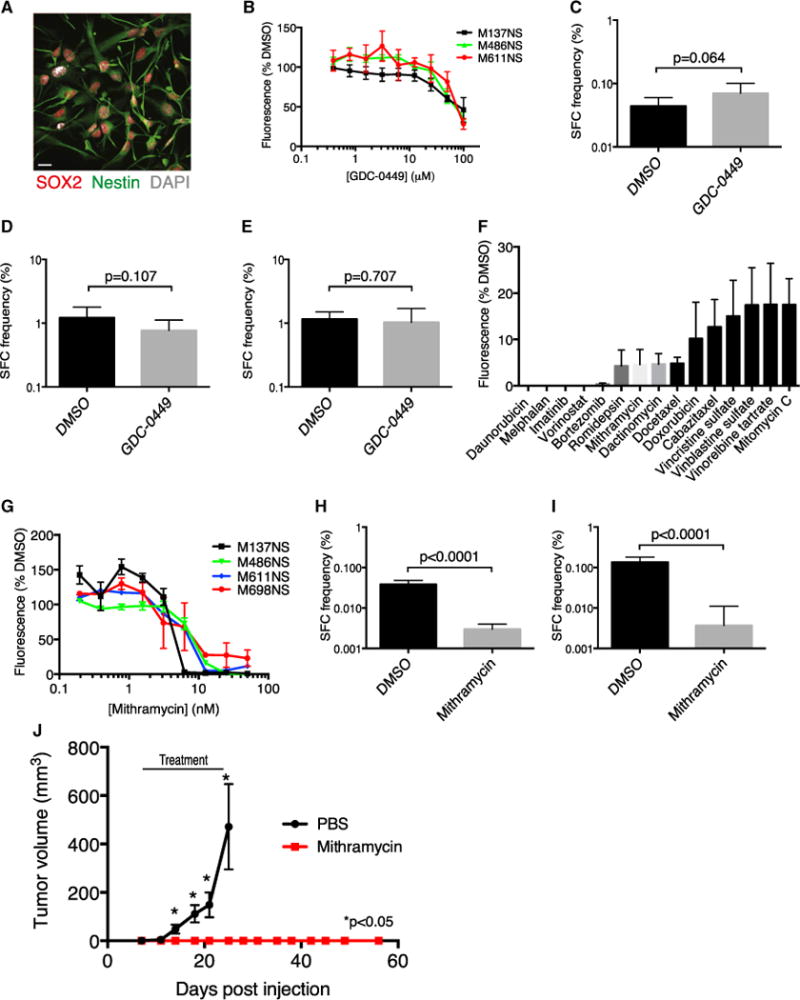
(A) A representative immunofluorescence image of cells derived from a human SHH MB tumor expressing SOX2 and the neural stem cell marker nestin. Scale bar, 20 μm.
(B) Human SHH MB cell viability was measured by Alamar Blue fluorescence at 591 nm after 5 days of treatment with increasing concentrations of GDC-0449 (mean ± SEM normalized to DMSO control).
(C) In vitro LDA comparing sphere-forming cell (SFC) frequency of primary Ptc cells treated with the DMSO control or 5 μM GDC-0449 (χ2 = 03.42, p = 0.064). (D and E) Primary human SHH MB cells from patient M693 (χ2 = 2.6, p = 0.107 [D]) or patient M698 (χ2 = 0.141, p = 0.707 [E]) were plated in an in vitro LDA comparing SFC frequency in neural stem cell medium containing DMSO or 5 μM GDC-0449.
(F) The top 15 hits from a screen of four human SHH MB cultures with the NCI oncology drug set. Cell viability was assessed by Alamar Blue fluorescence at 591 nm (n = 4, mean ± SEM, normalized to DMSO).
(G) Human SHH-MB cell viability was measured by Alamar Blue fluorescence at 591 nm after 5 days of treatment with increasing doses of mithramycin (mean ± SEM, normalized to DMSO).
(H) In vitro LDA comparing SFC frequency between primary Ptc cells treated with the DMSO control or 25 nM mithramycin (n = 4 tumors, χ2 = 219, p < 0.0001).
(I) Secondary LDA of primary spheres from (H) plated without drug (n = 3 tumors, χ2 = 95.2, p < 0.0001).
(J) NSG mice engrafted subcutaneously with 5 × 10⁵ Ptc cells were randomized to receive PBS or 1 mg/kg mithramycin on Monday, Wednesday, and Friday when tumors were first palpable and were treated until mice treated with PBS reached the end point (day 25) (n = 10per group, mean ± SEM).*, p<0.05, two-tailed unpaired t test.
Bar charts for LDAs in (C–E), (H), and (I) are shown as estimate plus upper limit. See also Figure S8.
DISCUSSION
Here we dissect the role of SHH MB’s constituent cell types in tumor maintenance and relapse to establish a paradigm for disease progression as a hierarchy that mirrors a neurogenic program. We characterized a functionally defined MB-propagating cell population as cycling slowly. This has important clinical implications because most MB therapies, including chemotherapeutic agents and ionizing radiation, preferentially affect cycling cells. Perivascular nestin+ cells were radiation-resistant in another Shh-driven MB model (Hambardzumyan et al., 2008), and a more recent study found that quiescent nestin+ glioma cells contribute to tumor regrowth following chemotherapy (Chen et al., 2012). Therefore, as in hematological malignancies, quiescence may be a common trait of multiple types of brain tumor stem cells. Understanding the mechanisms that govern the quiescent Sox2+ state may present opportunities for tailored therapy that could extend beyond MB. Breaking the quiescence of chronic myelogenous leukemia stem cells by inhibiting prosurvival B cell lymphoma 2 (BCL2) family members or blocking promyelocytic leukemia sensitizes them to tyrosine kinase inhibition or Ara-C ablation, respectively (Goff et al., 2013; Ito et al., 2008). Disrupting regulators of the quiescent state is an appealing therapeutic option for MB that may sensitize MPCs to conventional therapies.
Our label-chase studies and apoptotic analysis revealed that the majority of differentiated Ptc tumor cells constantly turn over but exhibit limited self-renewal in functional assays. Interestingly, SHH MB models in which proapoptotic genes are deleted exhibit the paradox of increased differentiation and reduced tumor latency (Garcia et al., 2013). We propose that, in such models, NeuN+ cells accumulate because of impaired apoptosis, inflating tumor volume causing mass effects, disease manifestation, and death. In retrospective studies, patients whose MBs showed higher levels of neuronal differentiation experienced greater overall survival (Grotzer et al., 2000; Miyahara et al., 2014).
Adult and developmental neurogenesis, including generation of the granule neurons in the cerebellum, begins with multipotent neural stem cell differentiation into a progenitor pool that expands transiently and, ultimately, produces mature neurons (Hatten and Roussel, 2011; Ming and Song, 2011). Targeting constitutively active Smo mutations or Ptch1 deletions to cells expressing GFAP and stem cell markers in the embryonic day 14 (E14) rhombic lip (Schüller et al., 2008), Sox2+ cells in the E14.5 external germinal layer (EGL) (Ahlfeld et al., 2013), or unipotent nestin+ progenitors in the postnatal EGL (Li et al., 2013) induces formation of Shh-subgroup MBs. Our work suggests that continued tumor growth and relapse are driven by cells expressing these same markers.
The modern definition of a cancer stem cell is one that can be isolated prospectively from a primary malignancy to engraft an immunodeficient mouse and phenocopy the original disease (Nguyen et al., 2012; Reya et al., 2001). Immunophenotype alone has been shown subsequently to be inadequate for cancer stem cell identification (Goardon et al., 2011), and cancers for which tumor-propagating cells are not rare have been cited as evidence in favor of a stochastic versus hierarchical model for tumor growth (Goardon et al., 2011; Quintana et al., 2010; Son et al., 2009). More recently, studies using animal models of intestinal adenocarcinoma and squamous skin tumors demonstrated clonal-level hierarchical tumor growth from phenotypical stem cells that self-renew and differentiate, presenting strong evidence in favor of the cancer stem cell hypothesis (Driessens et al., 2012; Schepers et al., 2012). Our work reconciles transplantation and lineage tracing approaches by using both prospective isolation and genetic fate mapping to show that Sox2+ cells propagate MB. That both methods support a Sox2+ cell-driven model suggests that functionally defined tumor-propagating cells from human tumors may also drive growth in patients’ cancers, which would make them essential therapeutic targets.
As predicted by prior transplantation studies, our results support a hierarchical model for MB growth. MPCs expressing Sox2 were long-lived, self-renewing, and drove growth in primary and allograft tumors. Sorted Sox2− cells exhibited a 10-fold lower tumor-propagating cell frequency, indicating diminished self-renewal. Despite being highly proliferative, DCX+ cells differentiated into postmitotic NeuN-expressing cells that are short-lived, minimizing their impact on long-term growth. Fate mapping from differentiated cell types will be necessary to confirm the hierarchical nature of tumors, including MB, and address the possible reacquisition of stem cell properties by stochastic fate switching between differentiated and stem cell states in vivo (Meacham and Morrison, 2013).
The prognostic significance of SOX2 expression programs and SOX2+ cell frequency in human tumors confirms the clinical relevance of MPCs. Tumor progression likely selects cells with a long-term propagating potential, thus enriching for these cells in advanced disease (Kreso and Dick, 2014). Stem cell signatures shared by hematopoietic and leukemia stem cells predicted AML patient survival despite leukemia stem cells’ quiescence and low frequency within AML samples (Eppert et al., 2011). Similarly, in breast, colon, and non-small cell lung cancer, stem cell signature expression correlates inversely with outcome (Liu et al., 2007; Merlos-Suárez et al., 2011; Zheng et al., 2013). In pediatric and adult brain tumors, samples with high frequencies of functionally defined stem cells come from patients experiencing worse outcomes (Laks et al., 2009; Panosyan et al., 2010). In these cancers and MB, we propose that the degree of the stem or propagating cell signature at the gene or protein level relates to the size of the clinically essential pool that can cause relapse. The high frequency of Sox2+ cells in many SHH MB patient samples indicates that not every positive cell is necessarily a tumor-propagating or stem cell. As in glioblastoma, the combinatorial expression of critical stem cell regulators likely defines the MPC state (Suvà et al., 2014). Greater numbers of SOX2+ cells may reflect an increase in MPC frequency and the persistence of treatment resistant biology in tumor bulk that together correlate with the likelihood that a patient will relapse.
Tumor-propagating cells in multiple model systems exhibit resistance to traditional therapies that effectively target the tumor bulk (Chen et al., 2012; O’Brien et al., 2012; Zheng et al., 2013). We show that, despite exhibiting Shh-pathway activity, MPCs are enriched following antimitotic and Smoothened inhibition and that SOX2+ cells from human SHH MB do not respond to GDC-0449 in vitro. Drug sensitivity is, therefore, a functional property that varies between the heterogeneous cell types comprising MB. Greater lineage traces from Sox2+ cells following therapy suggests that MPCs are the units of selection responsible for MB relapse. Current treatment may successfully control disease bulk but spare critical cells that regrow the tumor. Mithramycin, a drug that is highly effective against Sox2+ mouse and human SHH MB cells in vitro, stops allograft tumor growth. Therefore, MM may be effective in preventing disease relapse. Because DCX+ cells are cycling rapidly and Sox2− transplants are engrafted reliably at high cell doses, this fraction possesses some tumor-propagating capacity. Solely targeting a rare, relatively quiescent tumor propagating population may, therefore, be insufficient to control disease. Indeed, in glioma-bearing mice, the tumor burden was most reduced when quiescent nestin+ cells were ablated genetically in parallel to temozolomide treatment of cycling cells (Chen et al., 2012). Eradicating quiescent MPCs in parallel to tumor debulking using GDC-0449 or other agents may be required for optimal therapeutic specificity yielding the most durable MB remission.
EXPERIMENTAL PROCEDURES
Mice
Ptch1+/− mice (Goodrich et al., 1997) were maintained by breeding with CD1 mice from The Jackson Laboratory. Sox2creER mice (Arnold et al., 2011) and Sox2-eGFP mice (Ellis et al., 2004) (provided by Dr. Freda Miller, Toronto Hospital for Sick Children) were crossed to CD1 Patched1+/− mice. B6;129S6-Gt(ROSA)26Sortm9(CAG-tdTomato)Hze/J (Rosa-CAG-LSL-tdTomato) and 5- to 7-week-old NOD.Gc-Prkdcscid Il2rgtm1Wjl/SzJ (NSG) mice were purchased from The Jackson Laboratory. Experimental Ptc mice were administered 3 Gy γ-radiation from a cesium 137 source at birth. 50 mg/kg GDC-0449 (Selleck Chemical) was administered once daily in 0.5% methylcellulose 0.2% Tween 80 buffer by gastric gavage. Cytarabine (Ara-C, Sigma) or 0.9% saline vehicle was delivered by intracranial micro-osmotic pump for 5 days as described previously (Doetsch et al., 1997). Cre recombination for lineage tracing was achieved by injecting 6-week-old mice intraperitoneally with 5 mg tamoxifen (Sigma) dissolved in sesame oil. Subcutaneous tumor-bearing NSG mice were administered mithramycin (Cayman Chemical) by intraperitoneal injection in PBS vehicle on Mondays, Wednesdays, and Fridays for a total of nine doses. Mice were housed at The Hospital for Sick Children Laboratory Animal Services. All experimental procedures were approved by The Hospital for Sick Children’s Animal Care Committee. Further experimental details are provided in the Supplemental Experimental Procedures.
Patient Samples
All tumor samples were procured after receiving informed consent from patients, and all experimental procedures were performed in accordance with the Research Ethics Board at The Hospital for Sick Children (Toronto, Canada) and the respective collaborating institutions. Approval to link laboratory data to clinical and pathological data was obtained from the respective institutional review boards.
Fluorescence-Activated Cell Sorting
Primary tumors from Ptc; Sox2-eGFP mice were dissociated in PBS, and cell sorting was performed on either a Beckman Coulter MoFlo or Beckman Coulter MoFlo-XDP. Data were analyzed using FloJo software. Gates were established using CD1 Ptc tumor cells and fluorescence −1 controls. Microglia, hematopoietic cells, and red blood cells were depleted from sorted samples by gating out CD45+ cells (microglia and hematopoietic cells) and Ter-119+ cells (red blood cells).
Gene Expression Analysis
Microarray analysis was performed using the Affymetrix Mouse Gene 2.0 ST array on four biological replicates of matched pooled primary Sox2+ and Sox2− cells from primary Ptc; Sox2-eGFP fluorescence-activated cell sorting) FACS-sorted tumors (three pooled sorts of Sox2+ or Sox2− cells to one biological replicate). Microarray data were first processed using robust multichip analysis normalization. Principal component analysis and hierarchical clustering were performed using Partek Genomics Suite 6.6. Differentially expressed genes were detected by one-way ANOVA in Partek Genomics Suite 6.6 with an FDR of < 0.05 and analyzed by ingenuity pathway analysis (Ingenuity Systems). GSEA was performed using GSEA v2.0.12 with probes ranked by t test, and significance was determined by 2000 phenotype permutations (Subramanian et al., 2005). The minimum gene set size was 8, and the maximum was 650. Multiple probe sets per gene were collapsed using the median of probes.
Statistical Methods
Data were analyzed and statistics performed using GraphPad Prism v6.0b. Limiting dilution analyses were analyzed using extreme limiting dilution analysis (Hu and Smyth, 2009). Pooled data are reported as the mean ± SEM.
Supplementary Material
Significance.
Cell populations enriched for their tumor-propagating ability have been identified in many cancers, but whether and how tumor-propagating cells contributeto primary tumor growth isunknown. Here we show that rare, quiescent cells expressing Sox2 are mouse medulloblastoma-propagating cells (MPCs) in allograft transplants and in situ primary tumors. We demonstrate that medulloblastoma growth parallels a developmental stem cell hierarchy and is driven by Sox2+ cells. MPCs were resistant to antimitotic and Shh-targeted therapy and are likely responsible for disease relapse. Accordingly, a MPC signature is predictive of poor outcome in SHH-medulloblastoma patients. Tumor growth was stopped by targeting Sox2+ cells with the aureolic acid mithramycin, which may have therapeutic potential for SHH-medulloblastoma.
Acknowledgments
P.D. and M.T. hold Garron Family Research Chairs in Childhood Cancer Research and are supported by grants from the Canadian Institutes of Health Research (CIHR), the Ontario Institute for Cancer Research with funds from the Government of Ontario, and Genome Canada. P.D. also receives funding from the Canadian Cancer Society, the Hospital for Sick Children Foundation, Jessica’s Footprint Foundation, the Hopeful Minds Foundation, and B.R.A.I.N. Child. M.T.’s lab is also supported by Genome BC, the Terry Fox Research Institute, the Pediatric Oncology Group Ontario, funds from the family of Kathleen Lorette and the Clark H. Smith Brain Tumour Centre, the Montreal Children’s Hospital Foundation and the Hospital for Sick Children Sonia and Arthur Labatt Brain Tumour Research Centre, the Chief of Research Fund, the Cancer Genetics Program, and B.R.A.I.N. Child. K.H. is supported by an NIH grant (5R01DK096034-02). R.V. is funded by a CIHR Vanier Canada graduate scholarship. We would like to thank the Sickkids-UHN Flow
Footnotes
ACCESSION NUMBERS
The GenBank accession numbers for the microarray data described in this publication are GSE48766 (mouse) and GSE50765 (human). The European Bioinformatics Institute accession number for DNA and RNA sequencing data described in this publication is EGAD00001000818.
Supplemental Information includes Supplemental Experimental Procedures, eight figures, and one table and can be found with this article online at http://dx.doi.org/10.1016/j.ccr.2014.05.005.
References
- Ahlfeld J, Favaro R, Pagella P, Kretzschmar HA, Nicolis S, Schüller U. Sox2 requirement in sonic hedgehog-associated medulloblastoma. Cancer Res. 2013;73:3796–3807. doi: 10.1158/0008-5472.CAN-13-0238. [DOI] [PubMed] [Google Scholar]
- Arnold K, Sarkar A, Yram MA, Polo JM, Bronson R, Sengupta S, Seandel M, Geijsen N, Hochedlinger K. Sox2(+) adult stem and progenitor cells are important for tissue regeneration and survival of mice. Cell Stem Cell. 2011;9:317–329. doi: 10.1016/j.stem.2011.09.001. [DOI] [PMC free article] [PubMed] [Google Scholar]
- Bailey P, Cushing H. Medulloblastoma cerebelli: A common type of midcerebellar glioma of childhood. Arch Neurol Psychiatry. 1925;14:192–224. [Google Scholar]
- Chen J, Li Y, Yu TS, McKay RM, Burns DK, Kernie SG, Parada LF. A restricted cell population propagates glioblastoma growth after chemotherapy. Nature. 2012;488:522–526. doi: 10.1038/nature11287. [DOI] [PMC free article] [PubMed] [Google Scholar]
- Crawford JR, MacDonald TJ, Packer RJ. Medulloblastoma in childhood: new biological advances. Lancet Neurol. 2007;6:1073–1085. doi: 10.1016/S1474-4422(07)70289-2. [DOI] [PubMed] [Google Scholar]
- Doetsch F, García-Verdugo JM, Alvarez-Buylla A. Cellular composition and three-dimensional organization of the subventricular germinal zone in the adult mammalian brain. J Neurosci. 1997;17:5046–5061. doi: 10.1523/JNEUROSCI.17-13-05046.1997. [DOI] [PMC free article] [PubMed] [Google Scholar]
- Doetsch F, Caillé I, Lim DA, García-Verdugo JM, Alvarez-Buylla A. Subventricular zone astrocytes are neural stem cells in the adult mammalian brain. Cell. 1999;97:703–716. doi: 10.1016/s0092-8674(00)80783-7. [DOI] [PubMed] [Google Scholar]
- Driessens G, Beck B, Caauwe A, Simons BD, Blanpain C. Defining the mode of tumour growth by clonal analysis. Nature. 2012;488:527–530. doi: 10.1038/nature11344. [DOI] [PMC free article] [PubMed] [Google Scholar]
- Ellis P, Fagan BM, Magness ST, Hutton S, Taranova O, Hayashi S, McMahon A, Rao M, Pevny L. SOX2, a persistent marker for multipotential neural stem cells derived from embryonic stem cells, the embryo or the adult. Dev Neurosci. 2004;26:148–165. doi: 10.1159/000082134. [DOI] [PubMed] [Google Scholar]
- Eppert K, Takenaka K, Lechman ER, Waldron L, Nilsson B, van Galen P, Metzeler KH, Poeppl A, Ling V, Beyene J, et al. Stem cell gene expression programs influence clinical outcome in human leukemia. Nat Med. 2011;17:1086–1093. doi: 10.1038/nm.2415. [DOI] [PubMed] [Google Scholar]
- Garcia I, Crowther AJ, Gama V, Ryan Miller C, Deshmukh M, Gershon TR. Bax deficiency prolongs cerebellar neurogenesis, accelerates medulloblastoma formation and paradoxically increases both malignancy and differentiation. Oncogene. 2013;32:2304–2314. doi: 10.1038/onc.2012.248. [DOI] [PMC free article] [PubMed] [Google Scholar]
- Goardon N, Marchi E, Atzberger A, Quek L, Schuh A, Soneji S, Woll P, Mead A, Alford KA, Rout R, et al. Coexistence of LMPP-like and GMP-like leukemia stem cells in acute myeloid leukemia. Cancer Cell. 2011;19:138–152. doi: 10.1016/j.ccr.2010.12.012. [DOI] [PubMed] [Google Scholar]
- Goff DJ, Court Recart A, Sadarangani A, Chun HJ, Barrett CL, Krajewska M, Leu H, Low-Marchelli J, Ma W, Shih AY, et al. A Pan-BCL2 inhibitor renders bone-marrow-resident human leukemia stem cells sensitive to tyrosine kinase inhibition. Cell Stem Cell. 2013;12:316–328. doi: 10.1016/j.stem.2012.12.011. [DOI] [PMC free article] [PubMed] [Google Scholar]
- Goodrich LV, Milenković L, Higgins KM, Scott MP. Altered neural cell fates and medulloblastoma in mouse patched mutants. Science. 1997;277:1109–1113. doi: 10.1126/science.277.5329.1109. [DOI] [PubMed] [Google Scholar]
- Grotzer MA, Janss AJ, Fung K, Biegel JA, Sutton LN, Rorke LB, Zhao H, Cnaan A, Phillips PC, Lee VM, Trojanowski JQ. TrkC expression predicts good clinical outcome in primitive neuroectodermal brain tumors. J Clin Oncol. 2000;18:1027–1035. doi: 10.1200/JCO.2000.18.5.1027. [DOI] [PubMed] [Google Scholar]
- Guan Y, Gerhard B, Hogge DE. Detection, isolation, and stimulation of quiescent primitive leukemic progenitor cells from patients with acute myeloid leukemia (AML) Blood. 2003;101:3142–3149. doi: 10.1182/blood-2002-10-3062. [DOI] [PubMed] [Google Scholar]
- Hambardzumyan D, Becher OJ, Rosenblum MK, Pandolfi PP, Manova-Todorova K, Holland EC. PI3K pathway regulates survival of cancer stem cells residing in the perivascular niche following radiation in medulloblastoma in vivo. Genes Dev. 2008;22:436–448. doi: 10.1101/gad.1627008. [DOI] [PMC free article] [PubMed] [Google Scholar]
- Hatten ME, Roussel MF. Development and cancer of the cerebellum. Trends Neurosci. 2011;34:134–142. doi: 10.1016/j.tins.2011.01.002. [DOI] [PMC free article] [PubMed] [Google Scholar]
- Holyoake T, Jiang X, Eaves C, Eaves A. Isolation of a highly quiescent subpopulation of primitive leukemic cells in chronic myeloid leukemia. Blood. 1999;94:2056–2064. [PubMed] [Google Scholar]
- Hu Y, Smyth GK. ELDA: extreme limiting dilution analysis for comparing depleted and enriched populations in stem cell and other assays. J Immunol Methods. 2009;347:70–78. doi: 10.1016/j.jim.2009.06.008. [DOI] [PubMed] [Google Scholar]
- Ito K, Bernardi R, Morotti A, Matsuoka S, Saglio G, Ikeda Y, Rosenblatt J, Avigan DE, Teruya-Feldstein J, Pandolfi PP. PML targeting eradicates quiescent leukaemia-initiating cells. Nature. 2008;453:1072–1078. doi: 10.1038/nature07016. [DOI] [PMC free article] [PubMed] [Google Scholar]
- Kool M, Jones DT, Jäger N, Northcott PA, Pugh TJ, Hovestadt V, Piro RM, Esparza LA, Markant SL, Remke M, et al. Genome sequencing of SHH medulloblastoma predicts genotype-related response to smoothened inhibition. Cancer Cell. 2014;25:393–405. doi: 10.1016/j.ccr.2014.02.004. [DOI] [PMC free article] [PubMed] [Google Scholar]
- Kreso A, Dick JE. Evolution of the cancer stem cell model. Cell Stem Cell. 2014;14:275–291. doi: 10.1016/j.stem.2014.02.006. [DOI] [PubMed] [Google Scholar]
- Laks DR, Masterman-Smith M, Visnyei K, Angenieux B, Orozco NM, Foran I, Yong WH, Vinters HV, Liau LM, Lazareff JA, et al. Neurosphere formation is an independent predictor of clinical outcome in malignant glioma. Stem Cells. 2009;27:980–987. doi: 10.1002/stem.15. [DOI] [PMC free article] [PubMed] [Google Scholar]
- Li L, Clevers H. Coexistence of quiescent and active adult stem cells in mammals. Science. 2010;327:542–545. doi: 10.1126/science.1180794. [DOI] [PMC free article] [PubMed] [Google Scholar]
- Li P, Du F, Yuelling LW, Lin T, Muradimova RE, Tricarico R, Wang J, Enikolopov G, Bellacosa A, Wechsler-Reya RJ, Yang ZJ. A population of Nestin-expressing progenitors in the cerebellum exhibits increased tumorigenicity. Nat Neurosci. 2013;16:1737–1744. doi: 10.1038/nn.3553. [DOI] [PMC free article] [PubMed] [Google Scholar]
- Liu R, Wang X, Chen GY, Dalerba P, Gurney A, Hoey T, Sherlock G, Lewicki J, Shedden K, Clarke MF. The prognostic role ofagene signature from tumorigenic breast-cancer cells. N Engl J Med. 2007;356:217–226. doi: 10.1056/NEJMoa063994. [DOI] [PubMed] [Google Scholar]
- LoRusso PM, Rudin CM, Reddy JC, Tibes R, Weiss GJ, Borad MJ, Hann CL, Brahmer JR, Chang I, Darbonne WC, et al. Phase I trial of hedgehog pathway inhibitor vismodegib (GDC-0449) in patients with refractory, locally advanced or metastatic solid tumors. Clin Cancer Res. 2011;17:2502–2511. doi: 10.1158/1078-0432.CCR-10-2745. [DOI] [PMC free article] [PubMed] [Google Scholar]
- Martynoga B, Mateo JL, Zhou B, Andersen J, Achimastou A, Urbán N, van den Berg D, Georgopoulou D, Hadjur S, Wittbrodt J, et al. Epigenomic enhancer annotation reveals a key role for NFIX in neural stem cell quiescence. Genes Dev. 2013;27:1769–1786. doi: 10.1101/gad.216804.113. [DOI] [PMC free article] [PubMed] [Google Scholar]
- Meacham CE, Morrison SJ. Tumour heterogeneity and cancer cell plasticity. Nature. 2013;501:328–337. doi: 10.1038/nature12624. [DOI] [PMC free article] [PubMed] [Google Scholar]
- Merlos-Suárez A, Barriga FM, Jung P, Iglesias M, Céspedes MV, Rossell D, Sevillano M, Hernando-Momblona X, da Silva-Diz V, Muñoz P, et al. The intestinal stem cell signature identifies colorectal cancer stem cells and predicts disease relapse. Cell Stem Cell. 2011;8:511–524. doi: 10.1016/j.stem.2011.02.020. [DOI] [PubMed] [Google Scholar]
- Ming GL, Song H. Adult neurogenesis in the mammalian brain: significant answers and significant questions. Neuron. 2011;70:687–702. doi: 10.1016/j.neuron.2011.05.001. [DOI] [PMC free article] [PubMed] [Google Scholar]
- Miyahara H, Natsumeda M, Yoshimura J, Ogura R, Okazaki K, Toyoshima Y, Fujii Y, Takahashi H, Kakita A. Neuronal differentiation associated with Gli3 expression predicts favorable outcome for patients with medulloblastoma. Neuropathology. 2014;34:1–10. doi: 10.1111/neup.12052. [DOI] [PubMed] [Google Scholar]
- Nguyen LV, Vanner R, Dirks P, Eaves CJ. Cancer stem cells: an evolving concept. Nat Rev Cancer. 2012;12:133–143. doi: 10.1038/nrc3184. [DOI] [PubMed] [Google Scholar]
- Northcott PA, Jones DT, Kool M, Robinson GW, Gilbertson RJ, Cho YJ, Pomeroy SL, Korshunov A, Lichter P, Taylor MD, Pfister SM. Medulloblastomics: the end of the beginning. Nat Rev Cancer. 2012;12:818–834. doi: 10.1038/nrc3410. [DOI] [PMC free article] [PubMed] [Google Scholar]
- O’Brien CA, Kreso A, Ryan P, Hermans KG, Gibson L, Wang Y, Tsatsanis A, Gallinger S, Dick JE. ID1 and ID3 regulate the self-renewal capacity of human colon cancer-initiating cells through p21. Cancer Cell. 2012;21:777–792. doi: 10.1016/j.ccr.2012.04.036. [DOI] [PubMed] [Google Scholar]
- Panosyan EH, Laks DR, Masterman-Smith M, Mottahedeh J, Yong WH, Cloughesy TF, Lazareff JA, Mischel PS, Moore TB, Kornblum HI. Clinical outcome in pediatric glial and embryonal brain tumors correlates with in vitro multi-passageable neurosphere formation. Pediatr Blood Cancer. 2010;55:644–651. doi: 10.1002/pbc.22627. [DOI] [PMC free article] [PubMed] [Google Scholar]
- Partap S, Murphy PA, Vogel H, Barnes PD, Edwards MS, Fisher PG. Liposomal cytarabine for central nervous system embryonal tumors in children and young adults. J Neurooncol. 2011;103:561–566. doi: 10.1007/s11060-010-0419-y. [DOI] [PubMed] [Google Scholar]
- Pazzaglia S, Tanori M, Mancuso M, Rebessi S, Leonardi S, Di Majo V, Covelli V, Atkinson MJ, Hahn H, Saran A. Linking DNA damage to medulloblastoma tumorigenesis in patched heterozygous knockout mice. Oncogene. 2006;25:1165–1173. doi: 10.1038/sj.onc.1209032. [DOI] [PubMed] [Google Scholar]
- Quintana E, Shackleton M, Foster HR, Fullen DR, Sabel MS, Johnson TM, Morrison SJ. Phenotypic heterogeneity among tumorigenic melanoma cells from patients that is reversible and not hierarchically organized. Cancer Cell. 2010;18:510–523. doi: 10.1016/j.ccr.2010.10.012. [DOI] [PMC free article] [PubMed] [Google Scholar]
- Read TA, Fogarty MP, Markant SL, McLendon RE, Wei Z, Ellison DW, Febbo PG, Wechsler-Reya RJ. Identification of CD15 as a marker for tumor-propagating cells in a mouse model of medulloblastoma. Cancer Cell. 2009;15:135–147. doi: 10.1016/j.ccr.2008.12.016. [DOI] [PMC free article] [PubMed] [Google Scholar]
- Reya T, Morrison SJ, Clarke MF, Weissman IL. Stem cells, cancer, and cancer stem cells. Nature. 2001;414:105–111. doi: 10.1038/35102167. [DOI] [PubMed] [Google Scholar]
- Robarge KD, Brunton SA, Castanedo GM, Cui Y, Dina MS, Goldsmith R, Gould SE, Guichert O, Gunzner JL, Halladay J, et al. GDC-0449-a potent inhibitor of the hedgehog pathway. Bioorg Med Chem Lett. 2009;19:5576–5581. doi: 10.1016/j.bmcl.2009.08.049. [DOI] [PubMed] [Google Scholar]
- Roesch A, Fukunaga-Kalabis M, Schmidt EC, Zabierowski SE, Brafford PA, Vultur A, Basu D, Gimotty P, Vogt T, Herlyn M. A temporarily distinct subpopulation of slow-cycling melanoma cells is required for continuous tumor growth. Cell. 2010;141:583–594. doi: 10.1016/j.cell.2010.04.020. [DOI] [PMC free article] [PubMed] [Google Scholar]
- Rudin CM, Hann CL, Laterra J, Yauch RL, Callahan CA, Fu L, Holcomb T, Stinson J, Gould SE, Coleman B, et al. Treatment of medulloblastoma with hedgehog pathway inhibitor GDC-0449. N Engl J Med. 2009;361:1173–1178. doi: 10.1056/NEJMoa0902903. [DOI] [PMC free article] [PubMed] [Google Scholar]
- Saito Y, Uchida N, Tanaka S, Suzuki N, Tomizawa-Murasawa M, Sone A, Najima Y, Takagi S, Aoki Y, Wake A, et al. Induction of cell cycle entry eliminates human leukemia stem cells in a mouse model of AML. Nat Biotechnol. 2010;28:275–280. doi: 10.1038/nbt.1607. [DOI] [PMC free article] [PubMed] [Google Scholar]
- Schepers AG, Snippert HJ, Stange DE, van den Born M, van Es JH, van de Wetering M, Clevers H. Lineage tracing reveals Lgr5+ stem cell activity in mouse intestinal adenomas. Science. 2012;337:730–735. doi: 10.1126/science.1224676. [DOI] [PubMed] [Google Scholar]
- Schüller U, Heine VM, Mao J, Kho AT, Dillon AK, Han YG, Huillard E, Sun T, Ligon AH, Qian Y, et al. Acquisition of granule neuron precursor identity is a critical determinant of progenitor cell competence to form Shh-induced medulloblastoma. Cancer Cell. 2008;14:123–134. doi: 10.1016/j.ccr.2008.07.005. [DOI] [PMC free article] [PubMed] [Google Scholar]
- Singh SK, Hawkins C, Clarke ID, Squire JA, Bayani J, Hide T, Henkelman RM, Cusimano MD, Dirks PB. Identification of human brain tumour initiating cells. Nature. 2004;432:396–401. doi: 10.1038/nature03128. [DOI] [PubMed] [Google Scholar]
- Son MJ, Woolard K, Nam DH, Lee J, Fine HA. SSEA-1 is an enrichment marker for tumor-initiating cells in human glioblastoma. Cell Stem Cell. 2009;4:440–452. doi: 10.1016/j.stem.2009.03.003. [DOI] [PMC free article] [PubMed] [Google Scholar]
- Subramanian A, Tamayo P, Mootha VK, Mukherjee S, Ebert BL, Gillette MA, Paulovich A, Pomeroy SL, Golub TR, Lander ES, Mesirov JP. Gene set enrichment analysis: a knowledge-based approach for interpreting genome-wide expression profiles. Proc Natl Acad Sci USA. 2005;102:15545–15550. doi: 10.1073/pnas.0506580102. [DOI] [PMC free article] [PubMed] [Google Scholar]
- Suvà ML, Rheinbay E, Gillespie SM, Patel AP, Wakimoto H, Rabkin SD, Riggi N, Chi AS, Cahill DP, Nahed BV, et al. Reconstructing and Reprogramming the Tumor-Propagating Potential of Glioblastoma Stem-like Cells. Cell. 2014;157:580–594. doi: 10.1016/j.cell.2014.02.030. [DOI] [PMC free article] [PubMed] [Google Scholar]
- Ward RJ, Lee L, Graham K, Satkunendran T, Yoshikawa K, Ling E, Harper L, Austin R, Nieuwenhuis E, Clarke ID, et al. Multipotent CD15+ cancer stem cells in patched-1-deficient mouse medulloblastoma. Cancer Res. 2009;69:4682–4690. doi: 10.1158/0008-5472.CAN-09-0342. [DOI] [PubMed] [Google Scholar]
- Yauch RL, Dijkgraaf GJ, Alicke B, Januario T, Ahn CP, Holcomb T, Pujara K, Stinson J, Callahan CA, Tang T, et al. Smoothened mutation confers resistance to a Hedgehog pathway inhibitor in medulloblastoma. Science. 2009;326:572–574. doi: 10.1126/science.1179386. [DOI] [PMC free article] [PubMed] [Google Scholar]
- Zeltzer PM, Boyett JM, Finlay JL, Albright AL, Rorke LB, Milstein JM, Allen JC, Stevens KR, Stanley P, Li H, et al. Metastasis stage, adjuvant treatment, and residual tumor are prognostic factors for medulloblastoma in children: conclusions from the Children’s Cancer Group 921 randomized phase III study. J Clin Oncol. 1999;17:832–845. doi: 10.1200/JCO.1999.17.3.832. [DOI] [PubMed] [Google Scholar]
- Zheng Y, de la Cruz CC, Sayles LC, Alleyne-Chin C, Vaka D, Knaak TD, Bigos M, Xu Y, Hoang CD, Shrager JB, et al. A rare population of CD24(+)ITGB4(+)Notch(hi) cells drives tumor propagation in NSCLC and requires Notch3 for self-renewal. Cancer Cell. 2013;24:59–74. doi: 10.1016/j.ccr.2013.05.021. [DOI] [PMC free article] [PubMed] [Google Scholar]
Associated Data
This section collects any data citations, data availability statements, or supplementary materials included in this article.