

More than half of all human genes produce prematurely terminated polyadenylated short mRNAs. Masuda et al. show that FUS is frequently clustered around an alternative polyadenylation (APA) site of nascent RNA, stalls RNAP II, and prematurely terminates transcription in neuronal cells. Position-specific regulation of mRNA lengths by FUS is operational in two-thirds of transcripts in neuronal cells, with enrichment in genes involved in synaptic activities.
Keywords: FUS, RNA polymerase II, CLIP, alternative polyadenylation, mRNA length
Abstract
More than half of all human genes produce prematurely terminated polyadenylated short mRNAs. However, the underlying mechanisms remain largely elusive. CLIP-seq (cross-linking immunoprecipitation [CLIP] combined with deep sequencing) of FUS (fused in sarcoma) in neuronal cells showed that FUS is frequently clustered around an alternative polyadenylation (APA) site of nascent RNA. ChIP-seq (chromatin immunoprecipitation [ChIP] combined with deep sequencing) of RNA polymerase II (RNAP II) demonstrated that FUS stalls RNAP II and prematurely terminates transcription. When an APA site is located upstream of an FUS cluster, FUS enhances polyadenylation by recruiting CPSF160 and up-regulates the alternative short transcript. In contrast, when an APA site is located downstream from an FUS cluster, polyadenylation is not activated, and the RNAP II-suppressing effect of FUS leads to down-regulation of the alternative short transcript. CAGE-seq (cap analysis of gene expression [CAGE] combined with deep sequencing) and PolyA-seq (a strand-specific and quantitative method for high-throughput sequencing of 3' ends of polyadenylated transcripts) revealed that position-specific regulation of mRNA lengths by FUS is operational in two-thirds of transcripts in neuronal cells, with enrichment in genes involved in synaptic activities.
Fused in sarcoma/translocated in liposarcoma (FUS/TLS) is a member of the FET (TET) family, which includes EWS/EWSR1 (Ewing sarcoma breakpoint region 1) and TAF15/TAFII68 (TATA-binding protein-associated factor II, 68 kDa). The characteristic of this family of proteins is that they are ubiquitously expressed RNA-binding proteins that are components of fusion oncogenes that cause human cancers (Tan and Manley 2009; Mackenzie et al. 2010). Recent studies have revealed that mutations in these genes are implicated in amyotrophic lateral sclerosis (ALS) and frontotemporal lobar degeneration (FTLD) (Kwiatkowski et al. 2009; Vance et al. 2009; Ticozzi et al. 2011; Couthouis et al. 2012).
Although individual molecular mechanisms are still being investigated, it is known that FUS has multiple functions, including transcriptional regulation, nucleocytoplasmic shuttling, pre-mRNA splicing, microRNA (miRNA) processing, formation of stress granules, and RNA transport (Lagier-Tourenne et al. 2010). Transcriptional regulation by FUS is achieved by direct binding of FUS to RNA polymerase (RNAP) II (Schwartz et al. 2012) and the general transcription factor TFIID (Bertolotti et al. 1996), which binds to the promoter regions of genes transcribed by RNAP II. Chromatin immunoprecipitation (ChIP)-on chip analysis using promoter microarrays has demonstrated FUS binding to ssDNA in promoter regions in HeLa cells (Tan et al. 2012). Interestingly, FUS inhibits the histone acetyltransferase (HAT) activity of CREB-binding protein (CBP) and p300 on the cyclin D1 (CCND1) promoter in HeLa cells (Wang et al. 2008). Assembly of FUS-CBP/p300 in the CCND1 promoter region requires a noncoding RNA (ncRNA) (Wang et al. 2008). We previously reported that the identity of the ncRNA in this assembly is an antisense long ncRNA (lncRNA) that is generated from the promoter regions of a wide array of genes (Ishigaki et al. 2012). Additionally, FUS suppresses Ser2 phosphorylation on the C-terminal domain (CTD) of RNAP II through a direct interaction. ChIP-seq (ChIP combined with deep sequencing) analysis also revealed that migration of FUS to the vicinity of transcription start sites (TSSs) suppresses RNAP II accumulation around TSSs (Schwartz et al. 2012).
In addition to its role in regulating promoter activity and transcription initiation, FUS is involved in pre-mRNA processing. FUS is detectable in the spliceosome (Rappsilber et al. 2002; Zhou et al. 2002) and interacts with RNA processing factors, including SR proteins (Yang et al. 1998), SMN complexes, and U1 snRNP (Yamazaki et al. 2012). Our group and others have demonstrated by CLIP-seq (cross-linking immunoprecipitation [CLIP] combined with deep sequencing) analyses that the binding of FUS is enriched in the region of exons that are undergoing alternative splicing (Ishigaki et al. 2012; Lagier-Tourenne et al. 2012; Rogelj et al. 2012). We also previously reported that aberrantly spliced genes induced by Fus knockdown are different in primary motor neurons, cortical neurons, glial cells, and cerebellar neurons (Fujioka et al. 2013).
The mature 3′ ends of almost all eukaryotic mRNAs are cotranscriptionally generated by cleavage of the pre-mRNA followed by the addition of a polyadenylated tail downstream from the cleavage product. The assembly of the components that process the pre-mRNA 3′ end is initiated by a cooperative interaction of the cleavage and polyadenylation specificity factor (CPSF) and the cleavage stimulation factor (CstF). CPSF is a protein complex that contains six subunits (CPSF160, WDR33, CPSF100, CPSF73, Fip1, and CPSF30) and specifically recognizes the polyadenylation signal (PAS) that is located upstream of the cleavage site (Gruber et al. 2014). Alternative polyadenylation (APA) is increasingly being recognized as a critical mechanism for eukaryotic gene regulation, with over half of all human genes producing alternatively polyadenylated mRNAs (Di Giammartino et al. 2011). There are two major types of APA sites: those that occur in the exon at the 3′ end and those present in an upstream exon (Tian and Manley 2013). Both types should change the 3′ untranslated region (UTR) but may or may not change the coding sequence. Recent global analyses revealed that Nova1 (Licatalosi et al. 2008) and PABPN1 (Jenal et al. 2012) regulate APA sites of the first type, and U1 snRNP (Kaida et al. 2010; Berg et al. 2012) and CstF64 (Yao et al. 2012) regulate APA sites of the second type. However, all of the molecules associated with APA regulation have yet to be fully elucidated.
The objective of our present study was to comprehensively analyze signatures of FUS in RNA processing. In naïve Neuro2A (N2A) cells, we performed CLIP-seq of FUS. We also performed ChIP-seq of RNAP II, Nascent-seq (genome-wide sequencing of nascent RNA), CAGE-seq (cap analysis of gene expression [CAGE] combined with deep sequencing), and PolyA-seq (a strand-specific and quantitative method for high-throughput sequencing of 3' ends of polyadenylated transcripts) in Fus silenced N2A cells. We report that binding of FUS in the interior portion of nascent RNA results in the stalling of RNAP II and early termination of transcription. We also demonstrate that FUS interacts with CPSF160. When FUS binds downstream from the PAS of an APA site, FUS promotes binding of CPSF160 to PAS-containing RNA and facilitates polyadenylation. In contrast, we observed that when FUS binds upstream of the PAS of an APA site, polyadenylation is not induced. Thus, binding of FUS downstream from or upstream of PAS leads to up-regulation or down-regulation, respectively, of the generation of an alternative short transcript. Gene ontology (GO) analysis revealed an enrichment of genes involved in synaptic activities among FUS-regulated short transcripts.
Results
CLIP-seq determination of transcriptome-wide FUS signature and Fus knockdown-mediated gene expression alterations
To assess FUS–RNA interactions, we performed CLIP-seq analysis of FUS using N2A mouse neuroblastoma cells (posted to DNA Data Bank of Japan [DDBJ], accession no. DRA001190). We identified 37,119 FUS-binding clusters using a peak detection algorithm, MACS (Zhang et al. 2008). Consistent with the previous reports in which CLIP-seq analyses were performed (Ishigaki et al. 2012; Lagier-Tourenne et al. 2012; Rogelj et al. 2012), ∼70% of these clusters were distributed in intronic regions (Fig. 1A; Supplemental Fig. S1A), with the FUS CLIP tag density highest at the 5′ end and decreasing toward the 3′ end of long introns (Fig. 1B; Supplemental Fig. S1B). We also confirmed that introns covered by a larger number of FUS CLIP tags were more conserved in genes encoding RNA-binding proteins, as previously described (Supplemental Fig. S1C; Nakaya et al. 2013). Motif analysis using the HOMER algorithm (Heinz et al. 2010) showed that GU-rich motifs were enriched in FUS CLIP clusters and distributed around cross-linking sites, in agreement with the previous findings that FUS recognizes GU-rich nucleotides with weak specificity (Fig. 1C,D; Hoell et al. 2011; Lagier-Tourenne et al. 2012; Rogelj et al. 2012).
Figure 1.
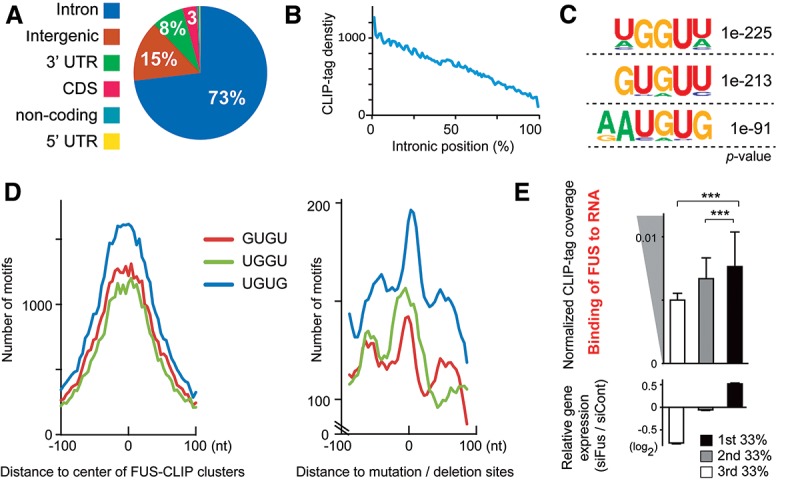
Positional analysis of FUS CLIP tags. (A) Pie chart showing the distribution of FUS CLIP clusters. (B) Positional FUS CLIP tag density on 648 introns >100 kb. (C) The three most enriched motifs generated by HOMER (Heinz et al. 2010) for the FUS CLIP clusters. The likelihood of finding the indicated motif by chance is indicated as a P-value. (D) Total number of the three GU motifs within a 200-nucleotide (nt) window. Position 0 is the center of the FUS CLIP clusters (left panel) or the mutated/deleted sites of FUS CLIP reads (right panel), which is a putative cross-link site of FUS in the CLIP experiment. (E) FUS–RNA interaction on FUS CLIP-seq correlates with up-regulated gene expression in response to Fus knockdown. FUS CLIP coverage is normalized by the expression level of each transcript by RNA sequencing (RNA-seq) of wild-type N2A cells. (Bottom panel) According to wild-type RNA-seq, 3750 genes are expressed with fragments per kilobase per million mapped fragments (FPKM) > 10 in N2A cells. The 3750 genes are evenly divided into three categories according to the changes in their relative expression levels by Fus knockdown (n = 1250 in each group). (Top panel) The mean and SE of normalized FUS CLIP tag coverages are indicated for the three categories. (***) P < 0.001 by Kruskal-Wallis test and Steel-Dwass post-hoc test.
Next, we knocked down Fus in N2A cells using specific siRNAs (Supplemental Fig. S1D). To look for targets of FUS, we performed directional mRNA sequencing (mRNA-seq) (DDBJ accession no. DRA001198) of Fus silenced N2A cells. Differential expression analysis of this RNA-seq data filtered at P < 0.01 (using Cuffdiff analysis) (Trapnell et al. 2013) revealed 259 mRNAs that were up-regulated and 312 that were down-regulated as a result of knocking down Fus. To assess the relationship of RNA binding of FUS and the gene expression changes due to Fus silencing, we divided the genes into three categories based on relative gene expression. The results showed that genes that were up-regulated in Fus silenced cells had more FUS CLIP tags (Fig. 1E), suggesting the possible involvement of FUS–RNA interaction in transcription suppression.
Binding of FUS to nascent RNA induces stalling of RNAP II
The role of FUS–RNA interaction in the regulation of RNAP II activity in cells is not well understood. To determine the relationship between FUS–RNA interaction and RNAP II distribution, we performed ChIP-seq analysis (DDBJ accession no. DRA001194) with the 8WG16 antibody, which recognizes the hypophosphorylated CTD. This produces a ChIP-seq pattern similar to phosphorylation-insensitive RNAP II antibodies (Bataille et al. 2012). We first calculated the RNAP II travelling ratio (TR) of all transcribed genes because previous reports demonstrated that Fus silencing recruits RNAP II around TSSs and increases TR in a cell type-specific manner (Schwartz et al. 2012, 2014). TR is the ratio of RNAP II density in the promoter-proximal peak region to that within the gene body (Reppas et al. 2006). Consistent with the previous reports, we confirmed that Fus knockdown was associated with a significant elevation of the average TR by 1.08-fold (Supplemental Fig. S2A). We then assessed the relationship between the distribution of RNAP II ChIP tags and FUS CLIP clusters. We observed an enrichment of RNAP II ChIP tags in siCont-treated cells in genes such as Ewsr1 and Taf15 that had large FUS CLIP clusters (Fig. 2A). This enrichment was not observed in siFus-treated cells. We noticed that the RNAP II ChIP tags were enriched in regions with the FUS CLIP clusters. Indeed, global analysis of FUS CLIP clusters and RNAP II ChIP tags demonstrated that RNAP II accumulated in regions covered by large FUS CLIP clusters in an FUS-dependent manner (Fig. 2B).
Figure 2.
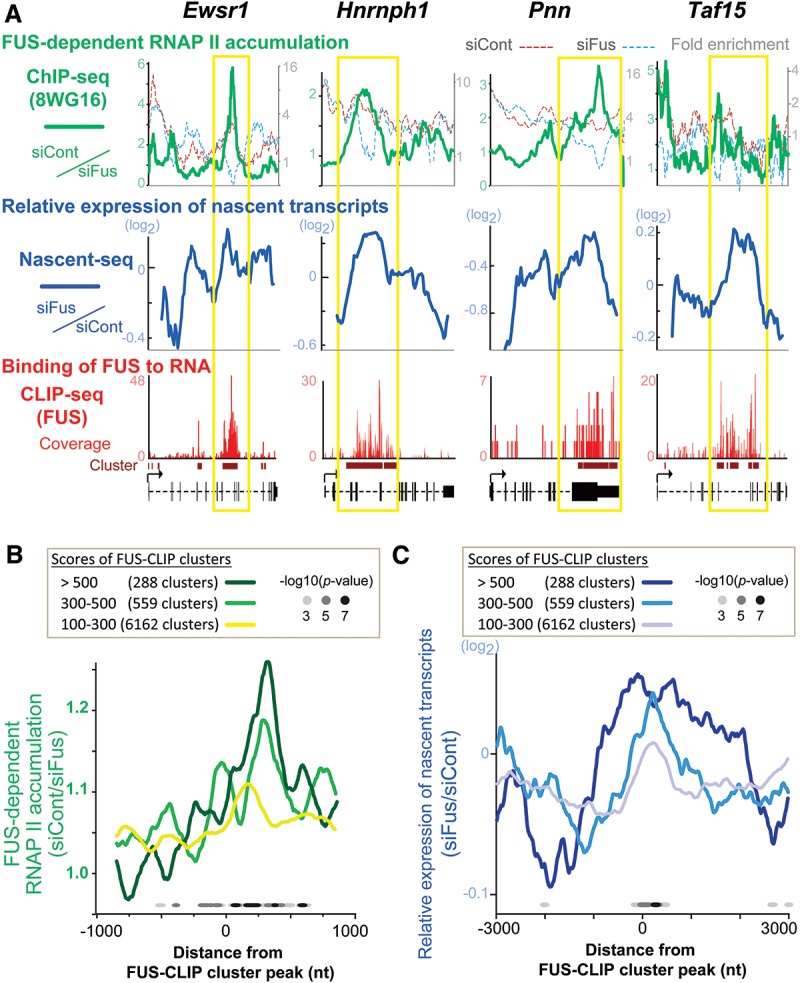
FUS facilitates local accumulation of RNAP II and suppresses nascent transcripts. (A) Distribution of FUS CLIP tags, RNAP II ChIP tags, and Nascent-seq tags on four representative genes, with prominent enrichment of CLIP tags in the middle of the gene. Fold enrichment of ChIP tags compared with input tags in N2A cells that were treated with siCont (red dotted line) and siFus (blue dotted line) is plotted on the right ordinate. Relative enrichment of ChIP tags (green solid line), representing FUS-dependent accumulation of RNAP II, was calculated by dividing ChIP tags of siCont by those of siFus and is plotted on the left ordinate. Relative expression of nascent transcripts (blue solid line) was calculated by dividing Nascent-seq tags of siFus by those of siCont. Yellow boxes indicate the regions where FUS CLIP tags and FUS-dependent RNAP II are enriched. (B) Combined analysis of CLIP-seq and ChIP-seq. FUS CLIP clusters were classified into three categories depending on the number of tags within a cluster. FUS-dependent RNAP II accumulation is calculated as in A. A total of 7009 transcripts have FUS CLIP clusters with MACS score >100 in N2A cells. RNAP II ChIP tags in siCont- and siFus-treated N2A cells are calculated for individual nucleotides in the indicated segment. The statistical differences of RNAP II ChIP tags between siCont and siFus were estimated by a Wilcoxon test and are indicated by dots. (C) Combined analysis of CLIP-seq and Nascent-seq. FUS CLIP clusters were classified as in B. Relative expression of nascent transcripts was calculated as in A. Note that the ordinate shows siFus/siCont in contrast to siCont/siFus in B, because Fus knockdown has the opposite effects on RNAP II and nascent RNA. The P-values were calculated as in B and are indicated by dots.
Additionally, we performed ChIP analysis of Ewsr1 and Taf15 using antibodies against the entire RNAP II (N20 antibody) and Ser2-phosphorylated CTD (H5 antibody). Fus knockdown resulted in a decrease in the accumulation of total RNAP II and an increase in pSer2-RNAP II, which was conspicuous in regions where FUS CLIP tags were enriched (Supplemental Fig. S2B). These observations are consistent with previous reports that binding of FUS to the CTD is enhanced by RNA in vitro (Schwartz et al. 2013) and that FUS suppresses Ser2 phosphorylation of the CTD in vitro (Schwartz et al. 2012).
To understand the role of FUS-dependent accumulation of RNAP II in transcription, we used Nascent-seq (DDBJ accession no. DRA003231) (Menet et al. 2012) to determine the effect of Fus knockdown on the expression levels of nascent transcripts around FUS CLIP clusters. Nascent-seq analyzes nascent transcripts localized in the chromatin fraction of cells. Consistent with the accumulation of RNAP II, we observed that, following siFus treatment, the expression level of nascent transcripts was significantly enhanced around FUS CLIP clusters (Fig. 2C), which was also confirmed in representative genes (Fig. 2A).
Taken together, our results demonstrate that local FUS–RNA interaction correlates with FUS-dependent accumulation of RNAP II and attenuation of nascent transcripts, suggesting that binding of FUS to nascent RNA induces local stalling of RNAP II.
FUS–nascent RNA interaction downstream from and upstream of APA sites up-regulates and down-regulates polyadenylation, respectively, according to transcriptome-wide analysis
As RNAP II is a key player in RNA processing (Hsin and Manley 2012), we were interested in assessing the TSSs and PASs in siCont- and siFus-treated cells. We performed CAGE-seq (DDBJ accession no. DRA002448) (Kanamori-Katayama et al. 2011) and PolyA-seq (DDBJ accession no. DRA002447) (Derti et al. 2012) in siCont-treated and siFus-treated cells to identify and quantify TSSs and polyadenylation sites (polyA sites). We first confirmed that a majority of the reads from CAGE-seq and PolyA-seq were located in 5′ UTRs and 3′ UTRs, respectively (Supplemental Fig. S3A). We detected 36,353 TSSs and 46,081 polyA sites in both siCont- and siFus-treated cells.
We next analyzed the positional relationships of FUS CLIP clusters with APA sites, alternative TSSs, and alternative splice sites. Alternative TSSs and APA sites were identified by analyzing multiple peaks of CAGE-seq and PolyA-seq, respectively, within a single gene. Similarly, alternative splice sites were identified by analyzing RNA-seq. We observed that FUS CLIP clusters were enriched around all three kinds of alternative sites. APA sites in particular were markedly concentrated in FUS CLIP clustered regions (Fig. 3A; Supplemental Fig. S3B). Among the 21,526 APA sites identified by PolyA-seq, Fus knockdown resulted in the up-regulation and down-regulation of 1033 and 1977 APA sites, respectively, by more than fourfold, suggesting that FUS can both activate and suppress APA.
Figure 3.
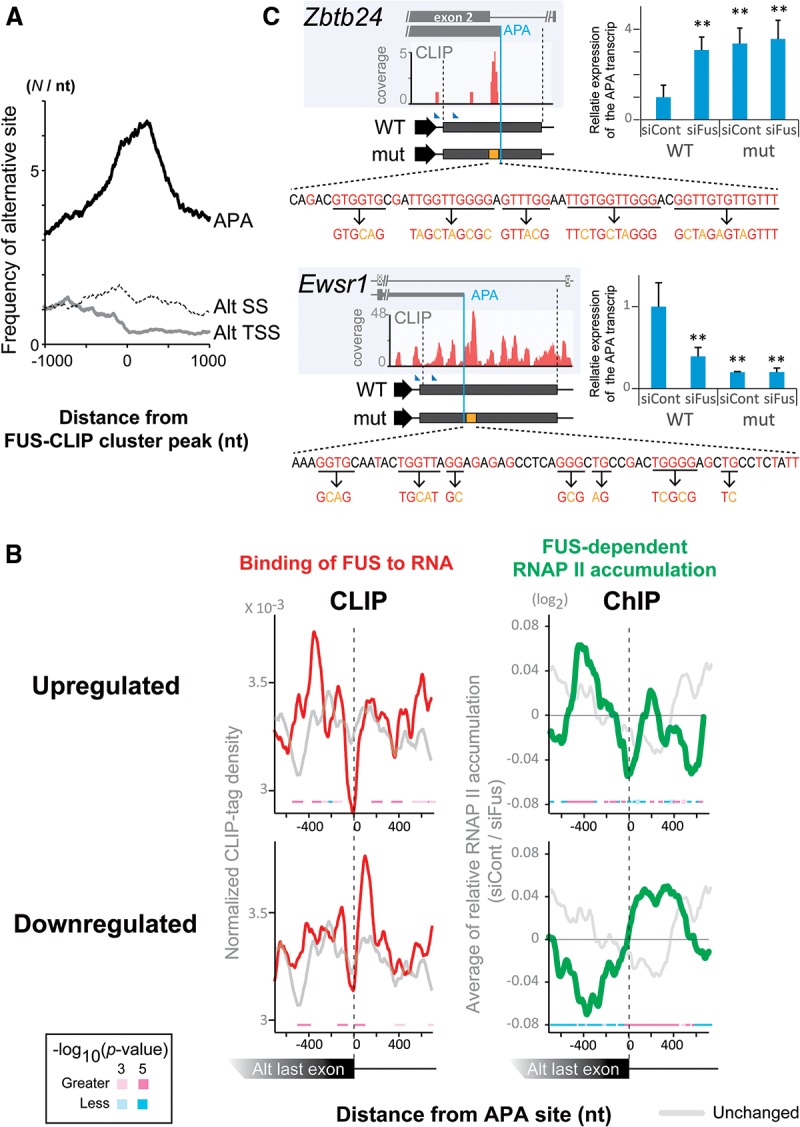
FUS binds to RNA segments around APA sites. (A) Distribution of alternative polyA sites (APA), alternative TSSs (alt TSS), and alternative splice sites (alt SSs) around FUS CLIP clusters. The center of the cluster is set to position 0. (B) Distribution of FUS CLIP tags (red lines in left panels; CLIP) and FUS-dependent RNAP II accumulation (green lines in right panels; ChIP) around APA sites that are up-regulated (red/green lines in top panels; fold change more than four, 1033 sites) and down-regulated (red/green lines in bottom panels; fold change less than one-quarter, 1977 sites) by Fus knockdown. Unchanged APA sites (fold change two-thirds to 1.5, 3833 sites) are indicated by light-gray lines. FUS-dependent RNAP II accumulation was calculated as in Figure 2A. The P-values for the differences between siFus and siCont were calculated using Wilcoxon test and are indicated by squares. (C) Position dependence of FUS binding to RNA in the activation/inactivation of APA. Fus mRNA is knocked down in N2A cells (siFus) along with overexpression of the Ztbt24/Ewsr1 minigenes and pRL/SV40, and 3′RACE analyses were performed using real-time RCR quantification. Expression levels of the APA transcripts were normalized to that of Renilla luciferase, and the relative mRNA expression levels were normalized to the sample transfected with wild-type minigene (WT) and control siRNA (siCont). Schematic of the minigene constructs harboring the APA sites and the flanking regions are shown in the left panels. Blue lines indicate the positions of APA sites. Arrowheads indicate the forward primers for 3′ RACE. Orange boxes indicate locations of mutated regions, where FUS CLIP tags are clustered. Individual mutations disrupting GU tracts, which are potential binding sites of FUS, are shown at the bottom. The mean and SD are indicated. (**) P < 0.01 compared with the siCont of the wild-type minigene by one-way ANOVA and post-hoc Tukey test.
To assess the correlation between APA and FUS, we examined the FUS CLIP tags around the APA sites that were down-regulated or up-regulated in the Fus knockdown. Our analysis revealed that FUS preferentially bound downstream from the down-regulated APA sites, whereas FUS bound upstream of the up-regulated APA sites (Fig. 3B). Consistently, among the previously reported 607 exons whose expression levels were up-regulated or down-regulated in Fus-deficient mouse brains according to the microarray data (GSE40653) (Lagier-Tourenne et al. 2012), 32 up-regulated and 31 down-regulated exons harbored APA sites (according to ENSEMBL release 78). We analyzed FUS CLIP tags around these selected 63 APA sites. We generated a normalized complexity map (Licatalosi et al. 2008) around the 63 APA sites using their CLIP-seq data of the mouse brain (GSE40653) (Lagier-Tourenne et al. 2012) and observed that FUS CLIP tags were clustered downstream from and upstream of the end of an exon in down-regulated and up-regulated APA sites, respectively (Supplemental Fig. S3C). The complexity map was similar to what we observed with our data set (Fig. 3B). These results suggest that FUS–RNA interaction downstream from and upstream of APA sites plays an important role in the activation and suppression of APA sites, respectively.
Since pausing of RNAP II immediately downstream from a PAS leads to polyadenylation and transcription termination (Nag et al. 2007; Kuehner et al. 2011; Grosso et al. 2012), we were interested in studying the distribution of RNAP II ChIP tags around all annotated APA sites. The analysis revealed accumulation of RNAP II upstream of and downstream from these APA sites (Supplemental Fig. S3D). Furthermore, the accumulation of RNAP II was dependent on binding of FUS to RNA. We next analyzed the APA sites, which were either up-regulated or down-regulated following Fus knockdown. We found that FUS-dependent RNAP II accumulation occurred downstream from the down-regulated APA sites (Fig. 3B). In contrast, FUS-dependent RNAP II accumulation occurred upstream of the up-regulated APA sites.
Zbtb24 and Ewsr1 have FUS CLIP clusters upstream of and downstream from APA sites, respectively (Fig. 3C; Supplemental Fig. S3E). On these clusters, GU-rich sequences were frequently observed (Fig. 3C) that were preferentially recognized by FUS (Fig. 1C,D). As expected, RT–PCR analysis showed that knockdown of Fus resulted in more alternative short transcripts of Ztbt24 and fewer alternative short transcripts of Ewsr1 (Supplemental Fig. S3E). Next, we overexpressed a minigene that contained either the Ztbt24 or Ewsr1 APA site (Fig. 3C) in Fus silenced cells and performed 3′ RACE analyses. Consistent with the expression profile of endogenous transcripts, we observed that FUS suppressed and facilitated the APA of Zbt24 and Ewsr1 minigenes, respectively (Fig. 3C; Supplemental Fig. S3F–H). Furthermore, the disruption of the GU-rich sequences in FUS-clustered regions abolished responsiveness to Fus knockdown (Fig. 3C).
In summary, our analyses revealed a positional dependence of FUS binding to RNA for the activation/inactivation of APA and suggested the involvement of locally attenuated RNAP II activity by FUS in this regulation.
Position-specific binding of FUS to nascent RNA in the regulation of transcription termination and polyadenylation
In order to analyze FUS-dependent regulation of transcription termination and polyadenylation more directly, we examined position dependence of FUS binding using an MS2-tethering system. We engineered luciferase reporters in which the 3′ UTRs were replaced with short genomic segments around two representative PASs. One was a constitutive polyA site in the Gapdh gene, and the other was the APA site in the Ewsr1 gene (Fig. 4A). The Gapdh gene was minimally covered by FUS CLIP tags, and its expression was not affected by Fus knockdown (data not shown). The Gapdh gene has a unique PAS, which consists of the consensus PAS motif, AAUAAA. No CLIP tag was observed in its vicinity (Fig. 4A). In contrast, the Ewsr1-APA site was enriched with FUS CLIP tags (Fig. 4A). The Ewsr1 PAS motif is AUUAAA.
Figure 4.
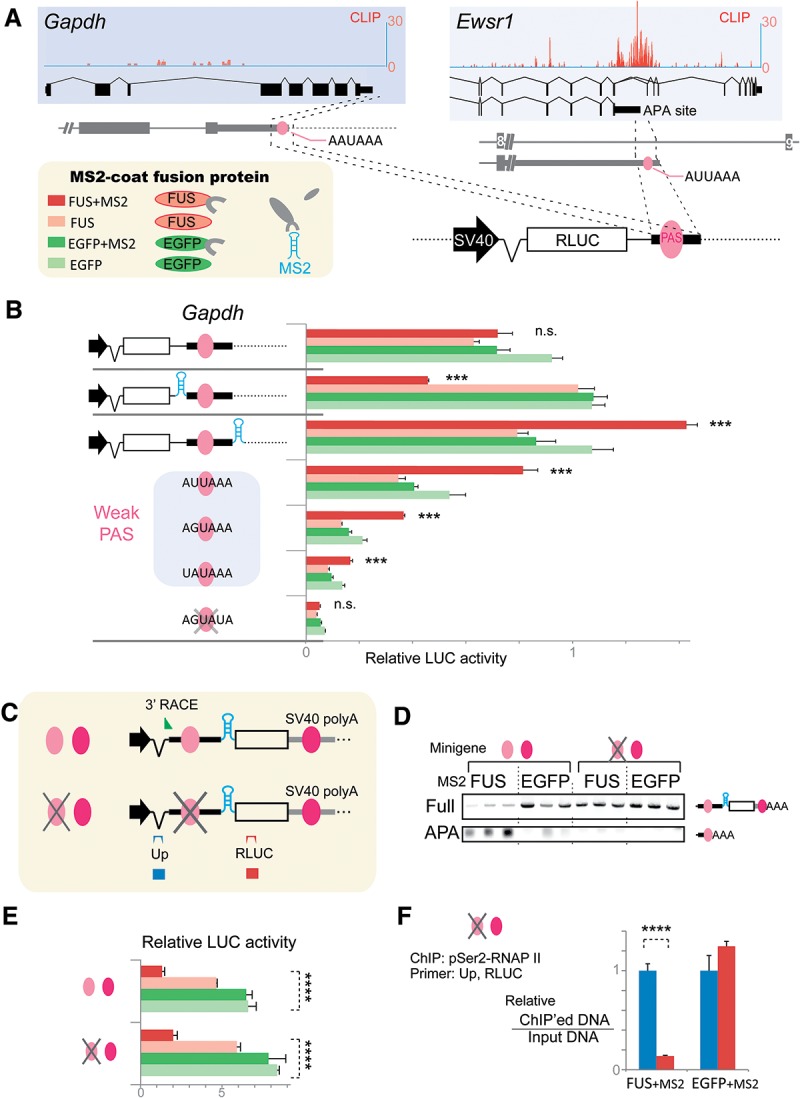
Binding of FUS to nascent RNA downstream from PAS terminates transcription and promotes polyadenylation. (A) Schemes of MS2 fusion protein constructs and the Renilla luciferase (RLUC) construct harboring short genomic regions around the polyA sites of Gapdh and Ewsr1. (B) Position-specific regulation of the luciferase activity of a minigene with the Gapdh-polyA site by FUS-MS2 fusion protein (red bar). Renilla luciferase activities were normalized to that of cotransfected firefly luciferase activity. (***) P < 0.001 compared with the relative luciferase activity of EGFP + MS2 (green bar) by one-way ANOVA and post-hoc Tukey test. (C) Schemes of the Renilla luciferase construct, placing an MS2-tethering site upstream of the Ewsr1-APA site and a constitutive SV40 polyA site downstream from Renilla luciferase. Alternative and constitutive PASs are indicated by light and dark red circles, respectively. These symbols are used in D–F to indicate the constructs. A slash mark on the alternative PAS indicates a disrupted PAS. A green arrowhead indicates the forward primer for 3′ RACE in D. Blue (Up) and red (RLUC) boxes indicate positions of PCR products. Positions of PCR primers are similarly indicated above each box. (D) 3′ RACE using nested RT–PCR to detect the polyadenylated full-length transcript (Full) and alterative short transcript (APA) using total RNA from HEK293 cells transfected with the indicated luciferase minigene and MS2 constructs. (E) Tethering of FUS suppresses transcription of the downstream region independent of PAS. MS2 constructs are indicated in C. (****) P < 0.0001 by one-way ANOVA. (F) Tethered FUS suppresses pSer2-RNAP II on the downstream region even with the lack of PAS. ChIP analysis of pSer2-RNAP II was performed using the indicated luciferase minigene and MS2 constructs. (****) P < 0.0001 by t-test. Primer positions are indicated in C.
We overexpressed the Gapdh-MS2-luciferase or Ewsr1-MS2-luciferase construct and also either the fusion protein of FUS and MS2 coat protein (FUS + MS2), FUS protein alone (FUS), the fusion protein of EGFP and MS2 coat protein with a nuclear localization signal (EGFP + MS2) (Masuda et al. 2008), or EGFP protein alone (EGFP) in HEK 293 cells and measured luciferase activity. Placing FUS upstream of the PAS decreased luciferase activity, whereas recruitment of FUS downstream from the PAS resulted in a pronounced increase in luciferase activity. This was observed for Gapdh-luciferase as well as Ewsr1-luciferase constructs (Fig. 4B; Supplemental Fig. S4A). Replacement of the Gapdh PAS with known weak PASs (Beaudoing et al. 2000) retained the property of FUS-dependent induction of luciferase activity. However, the luciferase activity did decrease with increasing discordant nucleotides in the weak PASs (Fig. 4B). Disruption of Gapdh PASs and Ewsr1 PASs by three or four mutant nucleotides completely abrogated FUS-dependent induction (Fig. 4B; Supplemental Fig. S4A), indicating that PAS is essential for this induction. RT–PCR analysis showed that tethering of FUS to the region downstream from the PAS terminated transcription and increased the rate of polyadenylation of transcripts (Supplemental Fig. S4B,C). Tethering of FUS to the region upstream of the PAS similarly terminated transcription without inducing polyadenylation of the transcripts (Supplemental Fig. S4B).
We next simulated FUS-mediated regulation of APA by placing an APA site and FUS-tethering site upstream of the luciferase gene (Fig. 4C). The luciferase gene carried a constitutive SV40 polyA site at its 3′ end. Our 3′ RACE analysis revealed that placing FUS downstream from the Ewsr1-APA site resulted in activation of the proximal Ewsr1 PAS and suppression of the distal SV40 polyA site (Fig. 4D). We also found that tethering of FUS downstream from the Ewsr1-APA site markedly suppressed luciferase activity (Fig. 4E). This suppressive effect was independent of the proximal Ewsr1 PAS because disruption of the Ewsr1 PAS did not revoke the effect. PAS-independent suppression of transcriptional activity by FUS was also confirmed by ChIP of pSer2-RNAP II (Fig. 4F).
Taken together, our analyses demonstrated that FUS induces transcription termination and polyadenylation of alternative short transcripts in a highly position-dependent manner. When FUS binds downstream from the APA site, FUS promotes transcription termination and polyadenylation, which increases production of polyadenylated short transcripts and decreases the generation of full-length transcripts. In contrast, when either FUS binds upstream of the APA site or a PAS is not present, FUS induces stalling of RNAP II, resulting in the suppression of gene expression.
FUS interacts with CPSF160 and promotes binding of CPSF160 to PAS-containing RNA
We next wished to determine the mechanism by which the binding of FUS to PAS facilitates the polyadenylation of a short transcript. First, we carried out fractionation of N2A cells in which FUS was present in both the soluble and the chromatin fractions, with more FUS in the soluble fraction. (Fig. 5A; Supplemental Fig. S5A). RNAP II, especially the transcriptionally active form (IIo), was mainly distributed in the chromatin fraction (Fig. 5A; Supplemental Fig. S5A). Additionally, the majority of the 3′ end processing factors was present in the soluble fraction. However, CPSF160 and, to a lesser extent, WDR33 were in both the soluble and the chromatin fractions. RNAP II inhibitors DRB (Fig. 5A; Supplemental Fig. S5A) and α-amanitin (Supplemental Fig. S5B) resulted in the transfer of CPSF160 from the chromatin fraction into the soluble fraction, suggesting that the activity of RNAP II is involved in the distribution of CPSF160. Interestingly, CPSF160, which is indispensable for PAS-dependent polyadenylation (Schonemann et al. 2014), also mediates PAS-dependent pausing of RNAP II (Nag et al. 2007).
Figure 5.
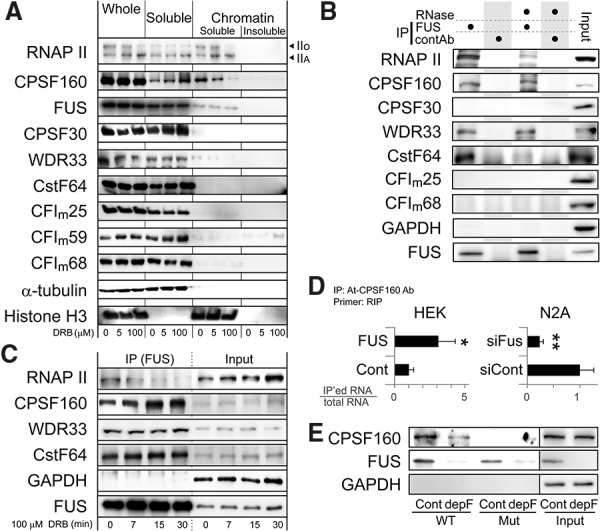
FUS interacts with CPSF160 and promotes binding of CPSF160 to PAS during stalling of RNAP II. (A) Distribution of RNAP II, FUS, and 3′ end processing factors in N2A cells. Cells were treated with the indicated concentrations of DRB for 2 h to inhibit RNAP II, and cell fractionation was performed followed by immunoblotting with the indicated antibodies. Histone H3 and α-tubulin are markers for chromatin-bound and chromatin-unbound soluble fractions, respectively. (B) RNA enhances interaction between endogenous FUS and RNAP II but not CPSF160. Total cell lysates were incubated with or without RNase and coimmunoprecipitated with anti-FUS antibody followed by immunoblotting with the indicated antibodies. (C) An RNAP II inhibitor, DRB, decreases RNAP II bound to FUS and increases CPSF160 bound to FUS. N2A cells treated with 100 μM DRB for the indicated durations were coimmunoprecipitated using anti-FUS antibody followed by immunoblotting. (D) FUS enhances binding of CPSF160 to PAS in the Ewsr1 minigene in cultured cells. Fus mRNA was knocked down in N2A cells (siFus) or overexpressed in HEK293 cells (FUS) along with overexpression of the Ewsr1 wild-type minigene shown in Figure 3C. The Ewsr1 minigene's mRNA was immunoprecipitated with anti-CPSF160 antibody. Ratios of the amount of coimmunoprecipitated RNA to that of input RNA were quantified by real-time RT–PCR using the RNA immunoprecipitation (RIP) primer pair in Supplemental Figure S5F. (*) P < 0.05; (**) P < 0.01 by t-test. (E) FUS enhances binding of CPSF160 to PAS in vitro. Mock-depleted (Cont) and FUS-depleted (depF) N2A nuclear extracts were affinity-purified with an RNA probe carrying the wild-type (WT) or mutant (mut) PAS and resolved by immunoblotting. Location of the RNA probe is shown in Supplemental Figure S5F.
As our results have demonstrated that FUS induces stalling of RNAP II, we analyzed the interaction of FUS with RNAP II and CPSF160. Coimmunoprecipitation demonstrated that FUS interacts with RNAP II and CPSF160 (Fig. 5B). Interestingly, RNase treatment of cell lysates largely diminished the binding of RNAP II but not of CPSF160 to FUS (Fig. 5B). Treatment of N2A cells with RNAP II inhibitors rapidly reduced the interaction between FUS and RNAP II (Fig. 5C; Supplemental Fig. S5C) but greatly increased the interaction between FUS and CPSF160 (Fig. 5C; Supplemental Fig. S5D). Consistently, the slow RNAP II mutant (C4) (Schor et al. 2009) increased interaction of FUS and CPSF160 (Supplemental Fig. S5E). Our immunoprecipitation analysis also detected interactions of FUS with WDR33 and CstF64 (Fig. 5B), although these interactions were minimally affected by the DRB treatment (Fig. 5C). These results suggest that binding of nascent RNA to FUS enhances the interaction between FUS and RNAP II and that stalling of RNAP II induces movement of CPSF160 from the chromatin fraction to the soluble fraction and increases interaction of CPSF160 with FUS.
To elucidate a functional relationship between CPSF160 and FUS, we examined whether FUS can regulate the binding of CPSF160 to PAS-containing RNA. We performed RNA immunoprecipitation (RIP) analysis using a minigene that contained the Ewsr1-APA site (Fig. 3C) in Fus silenced N2A cells or Fus-overexpressed HEK cells and analyzed the functional interaction of these molecules in cells. As expected, Fus silencing decreased binding of CPSF160 to PAS-containing RNA, whereas Fus overexpression promoted it (Fig. 5D). Similarly, RIP analysis of the MS2-tethering system (Fig. 4A) showed that tethering of FUS downstream from the APA site enhanced CPSF160 binding to PAS (Supplemental Fig. S5G). We also carried out an in vitro binding assay of an RNA probe harboring the APA site of the Ewsr1 gene (Supplemental Fig. S5F) using an N2A nuclear extract with or without depletion of FUS. Our analysis revealed that CPSF160 binds to the RNA probe in a PAS-dependent manner and that the depletion of FUS greatly diminishes binding of CPSF160 to the RNA probe (Fig. 5E).
Taken together, our analysis demonstrates that FUS dynamically regulates transcription termination and polyadenylation through its interaction with RNAP II and CPSF160. RNA binding of FUS stalls RNAP II and terminates transcription, which results in the release of CPSF160 from chromatin fractions into soluble fractions. FUS bound downstream from PAS enhances binding of CPSF160 to PAS-containing RNA and promotes polyadenylation.
FUS regulates mRNA lengths of thousands of genes
We showed so far that binding of FUS downstream from an APA site increases the production of short transcripts by enhancing the interaction of FUS with RNAP II and CPSF160. In contrast, binding of FUS upstream of an APA site down-regulates the production of short transcripts by stalling RNAP II. In addition to activation of an APA, an alternative TSS may affect the mRNA length. We thus analyzed positions of TSSs and polyA sites of each gene using CAGE-seq and PolyA-seq data, respectively, in siCont- and siFus-treated cells. For each gene, we calculated the average positions of TSSs and polyA sites. Next, we estimated mRNA length, FUS CLIP tag coverage, and shift of TSSs and polyA sites by Fus knockdown (Fig. 6A).
Figure 6.
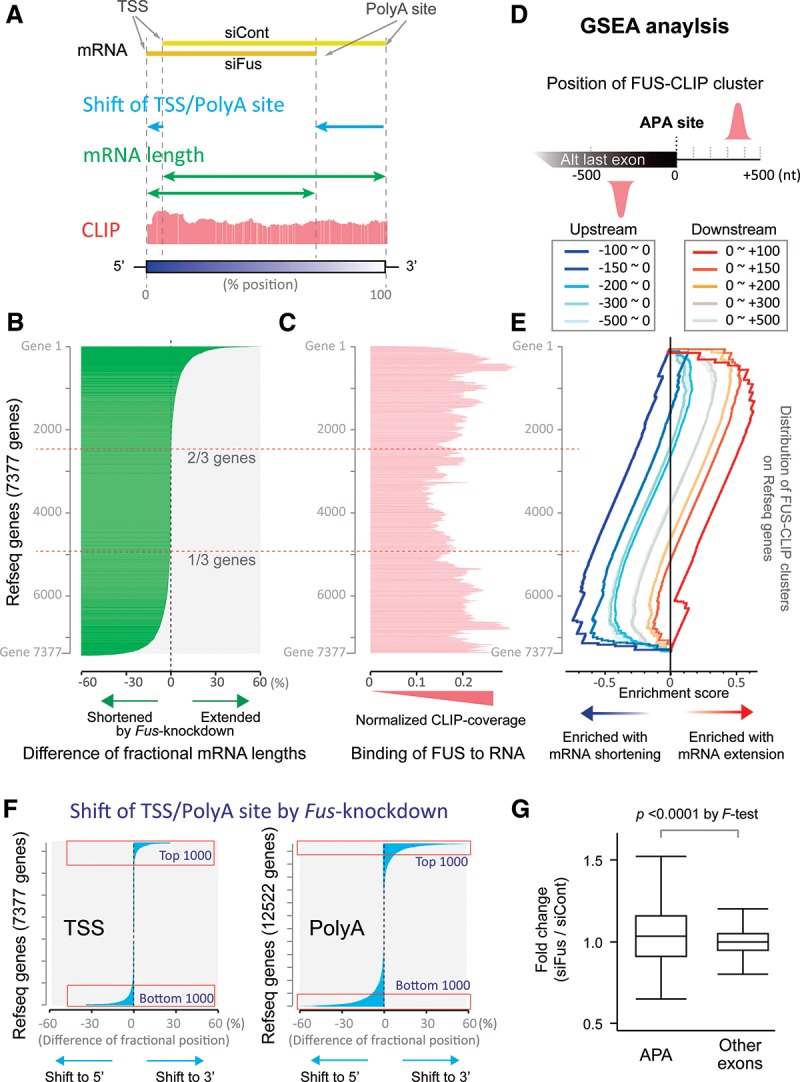
FUS regulates the mRNA length of approximately two-thirds of 7377 genes expressed in N2A cells. (A) Our scheme for calculating mRNA length and a shift of TSS/PolyA site. Weighted average positions of TSSs (TSS) and polyA sites (PolyA site) of 7377 genes in which both TSSs and polyA sites were detected in CAGE-seq and PolyA-seq analyses, respectively, were calculated as follows: The most 5′ and 3′ ends of each gene according to RefSeq were set to positions 0% and 100%, respectively. The relative position of each peak of CAGE-seq or PolyA-seq was calculated (% position). The calculated positions were weighted by the amount of CAGE-seq/PolyA-seq coverage at each site to calculate the weighted average positions of the TSS and polyA site for each gene. The fractional mRNA length was calculated by subtracting the weighted average position of the TSS from that of the polyA site. A shift of TSS for each gene was calculated by subtracting the weighted average position of the TSS in siCont-treated cells from that in siCont-treated cells. A shift of the polyA site was similarly calculated for the same gene. (B) Differential mRNA length by Fus silencing. The fractional mRNA length in siCont-treated cells was subtracted from the fractional mRNA length in siFus-treated cells for each gene to calculate the difference. Genes are sorted in descending order from the most extended to the most shortened fractional mRNA length. (C) Normalized CLIP tag coverages of the genes indicated in B. FUS CLIP coverage was normalized by the expression level of each transcript by RNA-seq. The more fractional mRNA lengths were changed, the more CLIP tags were observed. (D) Scheme of gene set enrichment analysis (GSEA). Genes having FUS CLIP clusters up to −100, −200, −300, −400, and −500 nt upstream of the APA site are identified. Similarly, genes having FUS CLIP clusters up to +100, +200, +300, +400, +500 nt downstream from the APA site are identified. The 10 different gene sets were used for GSEA in E. (E) GSEA of genes indicated in B. The 10 gene sets identified in D were subjected to GSEA. Five gene sets carrying FUS CLIP clusters upstream of the APA sites are enriched in the lower region (blue lines), where the fractional mRNA lengths are shortened by Fus knockdown. In contrast, five gene sets carrying FUS CLIP clusters downstream from the APA sites are enriched in the upper region (red lines), where the fractional mRNA lengths are extended by Fus knockdown. (F) Shifts of TSSs and polyA sites by Fus silencing in N2A cells. Shifts of TSSs and PolyA sites were calculated as explained in A. Genes were sorted in the order of the most shifted to the 3′ end to the most shifted to the 5′ end. FUS modulates mRNA length mostly by shifting polyA sites not TSSs (Supplemental Fig. S6E). In addition, a shift of polyA sites is independent of that of TSSs in each gene (Supplemental Fig. S6F). (G) Exon array analysis of APA-carrying exons and the other exons upon Fus knockdown in primary motor neurons. Array signals of APA-carrying exons are either more up-regulated or down-regulated by Fus knockdown compared with the other exons on the same genes. Increased up-regulation or down-regulation by Fus knockdown results in broadly distributed fold changes with APA-carrying exons. P < 0.0001 by F-test. The box denotes the 25th and 75th percentiles; a line within a box denotes the 50th percentile; whiskers denote values of the 75th percentile + 1.5 times the vertical distance covered by the box.
We first analyzed alteration of mRNA length by Fus knockdown (Fig. 6B). Our analysis revealed that as many as two-thirds of genes changed their mRNA lengths: Transcripts in the top one-third were extended, whereas transcripts in the bottom one-third were shortened. The affected transcripts were covered by more FUS CLIP tags than the unaffected transcripts (Fig. 6C; Supplemental Fig. S6A). Furthermore, gene set enrichment analysis (GSEA) (Subramanian et al. 2005) revealed that clustering of FUS downstream from an APA site was enriched in genes whose mRNA lengths were extended by Fus knockdown (Fig. 6D,E; Supplemental Fig. S6B–D). In contrast, clustering of FUS upstream of an APA site was enriched in genes whose mRNA lengths were shortened by Fus knockdown. These results again support the notion that FUS regulates the mRNA length in a position-specific manner.
We next analyzed GO of the top and bottom 1000 genes in which polyA site positions were affected by Fus knockdown (Fig. 6F). As the top and bottom 1000 genes unexpectedly gave rise to similar GO terms, a combined set of 2000 genes was analyzed using DAVID (Dennis et al. 2003; Huang et al. 2009). We used 12,522 genes expressed in N2A cells according to our RNA-seq analysis as a background for the DAVID analysis. The analysis revealed that the length-affected genes had GO terms of neuronal activities and synaptic transmission (Supplemental Tables S1, S2). In contrast, GO terms related to neuronal functions were not extracted from genes whose TSSs or expression levels were affected by Fus knockdown (Supplemental Tables S1, S2).
Because FUS is causally associated with the motor neuron disease ALS (Kwiatkowski et al. 2009; Vance et al. 2009; Ticozzi et al. 2011; Couthouis et al. 2012), we also speculated about the possible role of FUS-dependent regulation of transcription termination and polyadenylation in motor neurons. We reanalyzed our previously published exon array data of mouse primary motor neurons (GSE42421) (Fujioka et al. 2013) and detected 121 APA sites that were either activated or suppressed in primary motor neurons compared with primary cortical neurons (GSE36153). As expected, Fus knockdown in primary motor neurons either activated or suppressed the 121 APA sites (Fig. 6G). Similarly, the 121 APA-harboring genes were enriched with GO terms of synaptic transmission and neuronal activities (Supplemental Table S3). These results suggest that FUS may play an essential role in motor neuron-specific regulation of APA sites.
Discussion
We showed that FUS plays a pivotal role in position-specific activation/inactivation of transcription termination and polyadenylation, which is a process that regulates the mRNA lengths of approximately two-thirds of expressed genes. Based on our results, we propose the following model: FUS is recruited to RNA immediately after its transcription and locally inhibits RNAP II transcription, which leads to the release of CPSF160 from the chromatin fraction. When the FUS binding site is immediately downstream from the PAS, FUS promotes binding of CPSF160 to the PAS-containing RNA, which leads to transcription termination and polyadenylation of the bound RNA. This mechanism increases expression of a short transcript and suppresses expression of a long readthrough transcript. When there is no PAS immediately upstream of the FUS-binding site, only the transcription-suppressive effect of FUS is observed, and the FUS-bound transcript is down-regulated. Down-regulation of the alternative transcript may be simply due to premature termination of transcription before PAS, and the nascent transcript lacks PAS. Alternatively, FUS may bring CPSF160 in a spatially restricted manner. If PAS is lacking at the site where CPSF160 is presented, CPSF160 cannot initiate polyadenylation, which suggests that CPSF160 needs to be in the right place at the right time. Through such regulation of transcription termination and polyadenylation, FUS globally controls mRNA lengths (Fig. 7).
Figure 7.
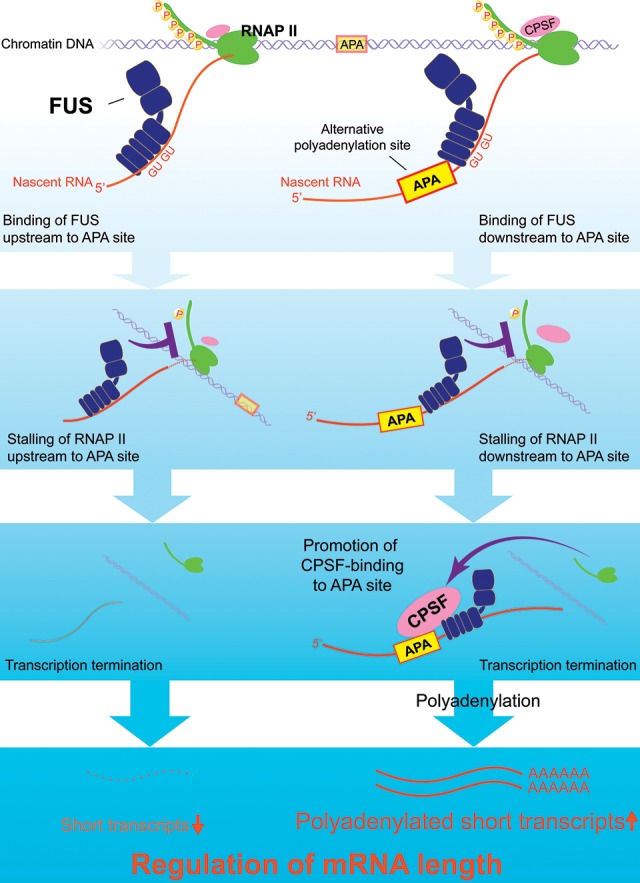
A proposed model for RNA-dependent position-specific regulation of alternative transcription termination and polyadenylation by FUS.
Our studies show that the interaction between FUS and nascent RNA suppresses the local transcriptional activity of RNAP II. A recent report had shown that FUS forms fibrous assemblies in an RNA-dependent manner that are capable of binding to the CTD (Schwartz et al. 2013). Furthermore, a previous study elucidated that FUS can affect CTD phosphorylation in vitro (Schwartz et al. 2012). Thus, nascent RNA would stimulate fibrous assembly of FUS, which in turn would attenuate CTD phosphorylation and suppress transcriptional activity in vivo.
Our group and others have identified many aberrantly spliced exons in various Fus-suppressed cells (Ishigaki et al. 2012; Lagier-Tourenne et al. 2012; Rogelj et al. 2012; Fujioka et al. 2013) in which binding of FUS to RNA is enriched around alternative splice sites (Supplemental Fig. S3B; Ishigaki et al. 2012). Interestingly, the rate of RNAP II-mediated elongation also affects the splicing efficiency, with slow elongation favoring exon inclusion, and rapid elongation favoring exon skipping (Munoz et al. 2010). Although FUS directly interacts with splicing factors (Tan and Manley 2009), detailed molecular mechanisms underlying FUS-mediated alternative splicing remain to be elucidated. The positional retardation of transcription efficiency of RNAP II that we reported here may partly account for enhanced inclusion of alternative FUS-recognized exons.
It is known that RNAP II termination at the 3′ end of a gene is functionally coupled with an RNA maturation process in which the 3′ end of the nascent transcript undergoes polyadenylation (Kuehner et al. 2011). Similarly, physiological early termination of RNAP II yielding an alternative short transcript, which is observed in more than half of human genes, is also coupled with an RNA maturation processes (Di Giammartino et al. 2011). However, the mechanisms and factors involved in APA have not been fully understood (Tian and Manley 2013). In our studies, we show that FUS is involved in both RNAP II termination and polyadenylation. It has been reported that U1 snRNP globally suppresses APA, although the position-specific regulation of U1 snRNP at APA sites has not been demonstrated (Kaida et al. 2010; Berg et al. 2012). FUS is known to associate with U1 snRNP directly (Lagier-Tourenne et al. 2012; Yamazaki et al. 2012). U1 snRNP may suppress APA by interacting with and displacing FUS from downstream from an APA site.
We show that FUS regulates transcription termination and polyadenylation by stalling RNAP II and enhancing recognition of APA along with CPSF160. Interestingly, another ALS-associated RNA-binding protein, TDP-43, facilitates pausing of RNAP II on TARDBP, the gene that encodes TDP-43 itself (Avendano-Vazquez et al. 2012). In contrast to FUS, however, TDP-43 competes with a cleavage polyadenylation factor, CstF-64, and blocks recognition of a proximal polyA site of TARDBP, preventing generation of an alternative short transcript (Avendano-Vazquez et al. 2012). Although the effects of TDP-43 on RNAP II and APA have not been globally analyzed, it is interesting to note that TDP-43 and FUS similarly stall RNAP II and regulate APA. Our GO analysis indicates that FUS regulates the APA of genes involved in the neuronal function, especially in synaptic activity (Supplemental Tables S1, S2). Aberration of position-specific regulation of RNAP II and APA by FUS and TDP-43 may be a key event in neurodegeneration in ALS.
Materials and methods
Antibodies
Antibodies to FUS (4H11), RNAP II (N20), CstF64 (C-20), and CFIm25 (2203C3) were purchased from Santa Cruz Biotechnology. Anti-RNAP II (8WG16) and pSer2-RNAP II (H5) were purchased from Covance. Anti-CPSF160 (A301-580A), CPSF30 (A301-585A), CFIm68 (A301-356A), CFIm59 (A301-359A), CPSF30 (A301-585A), and WDR33 (A301-151A) were purchased from Bethyl Laboratories. Anti-α-tubulin and anti-GAPDH antibodies were purchased from Sigma. Anti-histone H3 was purchased from Cell Signaling Technology.
Cell culture
N2A mouse neuroblastoma cells were grown in MEM with 10% fetal bovine serum at 37°C in 5% CO2. HEK293 cells were grown in DMEM with 10% fetal bovine serum.
RNAi and transfection
N2A cells were transfected with siRNA using Lipofectamine RNAiMAX (Life Technologies) according to the manufacturer's instructions. HEK293 cells were transfected with plasmids using Fugene6 (Promega) according to the manufacturer's instructions.
Two sets of siRNA duplexes against mouse Fus were synthesized by Sigma. The sense sequences of the siRNAs were as follows: siFus-1 (5′-GAGUGGAGGUUAUGGUCAA-3′) and siFus-2 (5′-CGACUGGUUUGAUGGUAAA-3′).
When the number of siFus is not indicated (siFus) in the figures, siFus-2 was used for the experiments. We purchased the AllStar Negative Control siRNA (1027281) from Qiagen.
Western blotting
Western blotting was performed as previously described (Masuda et al. 2012).
RT–PCR
Extraction of total RNA, synthesis of cDNA, real-time RT–PCR, and splicing analysis were performed as previously described (Masuda et al. 2012). Total RNA was reverse-transcribed using random primers (Life Technologies). For quantification of polyA-tailed mRNA, Oligo(dT)12–18 primer (Life Technologies) was used. PCR was performed using the LightCycler480 system (Roche) and the SYBR Premix Ex Taq II (Takara). Sequences of the primers used for PCR are listed in Supplemental Table S4.
RNA-seq
Total RNA was harvested from N2A cells in a 6-cm dish transfected with siRNA using RNeasy minikit (Qiagen) according to the manufacturer's instructions. The cDNA library was generated with SMARTer cDNA kit (Clontech) and NEBNext reagents (New England Biolabs), and 100-base paired-end reads were obtained with an Illumina HiSeq2000 (Otogenetics Corp).
CLIP-seq
N2A cells were UV-irradiated at 400 mJ, and CLIP was performed as previously described (Masuda et al. 2012). High-throughput 50-base-pair (bp) single-end sequencing was performed with the SOLiD 4 sequencer (Life Technologies) using one quad of a SOLiD sequencing slide for each sample. High-throughput 100-bp paired-end sequencings were performed with the Illumina HiSeq2000 sequencer at Riken Omics Science Center.
ChIP and ChIP-seq
ChIP-seq was performed using the 8WG16 antibody. The chromatin-immunoprecipitated DNAs and input DNAs were barcode-tagged, pooled, and sequenced in a 100-base paired-end format by an Illumina HiSeq 2000 (Otogenetics Corp.). Details are described in the Supplemental Material.
Nascent-seq
Nasent-seq was performed as described elsewhere (Menet et al. 2012). High-throughput 100-bp paired-end sequencing was performed with the Illumina HiSeq 2000 sequencer (Beijing Genomics Institute). Details are described in the Supplemental Material.
PolyA-seq
PolyA-seq was performed as described elsewhere (Derti et al. 2012) with linkers and sequencing primers adapted to Illumina platforms. High-throughput 75-bp single-end sequencing was performed with the MiSeq sequencer (Nagoya University).
CAGE-seq
CAGE-seq was performed as described elsewhere (Kanamori-Katayama et al. 2011) with adapters and sequencing primers adapted to Illumina platforms. High-throughput 50-bp single-end sequencing was performed with the Illumina HiSeq 2000 sequencer (Riken Omics Science Center).
Cell fractionation
The cell fractionation was performed as described previously (Cernilogar et al. 2011; Ji et al. 2013) with some modifications. N2A cells were cultured in 10-cm dishes. Half of the cells were resuspended in 500 µL of RIPA buffer, treated with sonication, and centrifuged. The supernatants were saved as “whole fraction.” The other half of the cells were lysed in 500 µL of CSKI buffer and centrifuged. The supernatants were saved as “soluble fraction.” The pellet was washed twice in CSKI buffer and resuspended in 500 µL of CSKII buffer. The samples were added with 250 mM NH2SO4, and treated with sonication. After centrifugation, the supernatant (chromatin-soluble fraction) was collected, and the pellet (chromatin-insoluble fraction) was resuspended in 500 µL of RIPA buffer.
Immunoprecipitation
To inhibit transcription by RNAP II, N2A cells were treated with 10 μg/mL α-amanitin or the indicated concentrations of DRB for the indicated periods of time. For slowing the RNAP II speed, N2A cells were transfected with WTS, C4, or α-amanitin-resistant WTR RNAP II. α-Amanitin (10 μg/mL) was added to the medium to inhibit endogenous RNAP II at 24 h after transfection, and the cells were incubated for an additional 24 h. The cells were lysed in NETN buffer. For RNase treatments, total cell lysates were incubated with 1 µL of RNase A/T1 (Ambion) for 20 min at 30°C. Cleared cell lysate was incubated with 2 μg of the indicated antibody to form an immune complex for 2 h at 4°C. Next, 20 μL of Dynabeads protein G was added and incubated for 1 h at 4°C. Immune complexes were washed four times by NETN buffer and analyzed by Western blotting.
RNA affinity purification assay
RNA affinity purification assay was performed as previously described (Masuda et al. 2012). Details are described in the Supplemental Material.
RIP assay
To eliminate the effects of cytoplasmic RNA, nuclear fraction was isolated, and RIP assays were performed. Details are described in the Supplemental Material.
3′ RACE
3′ RACE was performed as described elsewhere (Kaida et al. 2010). cDNA was synthesized using oligo dT18-XbaKpnBam primer, and 3′ RACE was carried out using the first and second (nested) forward primers and a XbaKpnBam reverse primer.
Luciferase assay
Dual-luciferase reporter assay was performed as previously described (Masuda et al. 2012). Artificial 3′ UTRs of Gapdh and Ewsr1 were engineered into pRL-SV40 (Promega), and pGL3-Promoter vector (Promega) was cotransfected as a control.
Bioinformatic analysis
RNA-seq, CLIP-seq, CAGE-seq, PolyA-seq, Nascent-seq, and ChIP-seq reads were mapped to the reference mouse genome (NCBI build 37.1/mm9). In silico analyses were performed by writing Perl scripts and executing combinations of publically available software. Details are described in the Supplemental Material.
Accession numbers
CLIP-seq, RNA-seq, ChIP-seq, Nascent-seq PolyA-seq, and CAGE-seq data were registered in DDBJ DRA Sequence Read Archives with accession numbers DRA001190, DRA001198, DRA001194, DRA003231, DRA002447, and DRA002448, respectively.
Supplementary Material
Acknowledgments
We are grateful to Dr. Kunio Ihara at the Center for Gene Research of Nagoya University for the SOLiD and MiSeq sequencing analysis. We are grateful to Dr. Masaaki Furuno and Dr. Yoshihide Hayashizaki at Riken Omics Science Center for CAGE-seq analysis through the Cell Innovation Program. We thank Dr. Tomas Babak for his support on PolyA-seq analysis. This work was supported by Grants-in-Aid from the Ministry of Education, Culture, Sports, Science, and Technology/Japan Science and Technology Agency and the Ministry of Health, Labour, and Welfare of Japan.
Footnotes
Supplemental material is available for this article.
Article is online at http://www.genesdev.org/cgi/doi/10.1101/gad.255737.114.
References
- Avendano-Vazquez SE, Dhir A, Bembich S, Buratti E, Proudfoot N, Baralle FE. 2012. Autoregulation of TDP-43 mRNA levels involves interplay between transcription, splicing, and alternative polyA site selection. Genes Dev 26: 1679–1684. [DOI] [PMC free article] [PubMed] [Google Scholar]
- Bataille AR, Jeronimo C, Jacques PE, Laramee L, Fortin ME, Forest A, Bergeron M, Hanes SD, Robert F. 2012. A universal RNA polymerase II CTD cycle is orchestrated by complex interplays between kinase, phosphatase, and isomerase enzymes along genes. Mol Cell 45: 158–170. [DOI] [PubMed] [Google Scholar]
- Beaudoing E, Freier S, Wyatt JR, Claverie JM, Gautheret D. 2000. Patterns of variant polyadenylation signal usage in human genes. Genome Res 10: 1001–1010. [DOI] [PMC free article] [PubMed] [Google Scholar]
- Berg MG, Singh LN, Younis I, Liu Q, Pinto AM, Kaida D, Zhang Z, Cho S, Sherrill-Mix S, Wan L, et al. 2012. U1 snRNP determines mRNA length and regulates isoform expression. Cell 150: 53–64. [DOI] [PMC free article] [PubMed] [Google Scholar]
- Bertolotti A, Lutz Y, Heard DJ, Chambon P, Tora L. 1996. hTAF(II)68, a novel RNA/ssDNA-binding protein with homology to the pro-oncoproteins TLS/FUS and EWS is associated with both TFIID and RNA polymerase II. EMBO J 15: 5022–5031. [PMC free article] [PubMed] [Google Scholar]
- Cernilogar FM, Onorati MC, Kothe GO, Burroughs AM, Parsi KM, Breiling A, Lo Sardo F, Saxena A, Miyoshi K, Siomi H, et al. 2011. Chromatin-associated RNA interference components contribute to transcriptional regulation in Drosophila. Nature 480: 391–395. [DOI] [PMC free article] [PubMed] [Google Scholar]
- Couthouis J, Hart MP, Erion R, King OD, Diaz Z, Nakaya T, Ibrahim F, Kim HJ, Mojsilovic-Petrovic J, Panossian S, et al. 2012. Evaluating the role of the FUS/TLS-related gene EWSR1 in amyotrophic lateral sclerosis. Hum Mol Genet 21: 2899–2911. [DOI] [PMC free article] [PubMed] [Google Scholar]
- Dennis G Jr, Sherman BT, Hosack DA, Yang J, Gao W, Lane HC, Lempicki RA. 2003. DAVID: database for annotation, visualization, and integrated discovery. Genome Biol 4: P3. [PubMed] [Google Scholar]
- Derti A, Garrett-Engele P, Macisaac KD, Stevens RC, Sriram S, Chen R, Rohl CA, Johnson JM, Babak T. 2012. A quantitative atlas of polyadenylation in five mammals. Genome Res 22: 1173–1183. [DOI] [PMC free article] [PubMed] [Google Scholar]
- Di Giammartino DC, Nishida K, Manley JL. 2011. Mechanisms and consequences of alternative polyadenylation. Mol Cell 43: 853–866. [DOI] [PMC free article] [PubMed] [Google Scholar]
- Fujioka Y, Ishigaki S, Masuda A, Iguchi Y, Udagawa T, Watanabe H, Katsuno M, Ohno K, Sobue G. 2013. FUS-regulated region- and cell-type-specific transcriptome is associated with cell selectivity in ALS/FTLD. Sci Rep 3: 2388. [DOI] [PMC free article] [PubMed] [Google Scholar]
- Grosso AR, de Almeida SF, Braga J, Carmo-Fonseca M. 2012. Dynamic transitions in RNA polymerase II density profiles during transcription termination. Genome Res 22: 1447–1456. [DOI] [PMC free article] [PubMed] [Google Scholar]
- Gruber AR, Martin G, Keller W, Zavolan M. 2014. Means to an end: mechanisms of alternative polyadenylation of messenger RNA precursors. Wiley Interdiscip Rev RNA 5: 183–196. [DOI] [PMC free article] [PubMed] [Google Scholar]
- Heinz S, Benner C, Spann N, Bertolino E, Lin YC, Laslo P, Cheng JX, Murre C, Singh H, Glass CK. 2010. Simple combinations of lineage-determining transcription factors prime cis-regulatory elements required for macrophage and B cell identities. Mol Cell 38: 576–589. [DOI] [PMC free article] [PubMed] [Google Scholar]
- Hoell JI, Larsson E, Runge S, Nusbaum JD, Duggimpudi S, Farazi TA, Hafner M, Borkhardt A, Sander C, Tuschl T. 2011. RNA targets of wild-type and mutant FET family proteins. Nat Struct Mol Biol 18: 1428–1431. [DOI] [PMC free article] [PubMed] [Google Scholar]
- Hsin JP, Manley JL. 2012. The RNA polymerase II CTD coordinates transcription and RNA processing. Genes Dev 26: 2119–2137. [DOI] [PMC free article] [PubMed] [Google Scholar]
- Huang DW, Sherman BT, Lempicki RA. 2009. Systematic and integrative analysis of large gene lists using DAVID bioinformatics resources. Nat Protoc 4: 44–57. [DOI] [PubMed] [Google Scholar]
- Ishigaki S, Masuda A, Fujioka Y, Iguchi Y, Katsuno M, Shibata A, Urano F, Sobue G, Ohno K. 2012. Position-dependent FUS–RNA interactions regulate alternative splicing events and transcriptions. Sci Rep 2: 529. [DOI] [PMC free article] [PubMed] [Google Scholar]
- Jenal M, Elkon R, Loayza-Puch F, van Haaften G, Kuhn U, Menzies FM, Oude Vrielink JA, Bos AJ, Drost J, Rooijers K, et al. 2012. The poly(A)-binding protein nuclear 1 suppresses alternative cleavage and polyadenylation sites. Cell 149: 538–553. [DOI] [PubMed] [Google Scholar]
- Ji X, Zhou Y, Pandit S, Huang J, Li H, Lin CY, Xiao R, Burge CB, Fu XD. 2013. SR proteins collaborate with 7SK and promoter-associated nascent RNA to release paused polymerase. Cell 153: 855–868. [DOI] [PMC free article] [PubMed] [Google Scholar]
- Kaida D, Berg MG, Younis I, Kasim M, Singh LN, Wan L, Dreyfuss G. 2010. U1 snRNP protects pre-mRNAs from premature cleavage and polyadenylation. Nature 468: 664–668. [DOI] [PMC free article] [PubMed] [Google Scholar]
- Kanamori-Katayama M, Itoh M, Kawaji H, Lassmann T, Katayama S, Kojima M, Bertin N, Kaiho A, Ninomiya N, Daub CO, et al. 2011. Unamplified cap analysis of gene expression on a single-molecule sequencer. Genome Res 21: 1150–1159. [DOI] [PMC free article] [PubMed] [Google Scholar]
- Kuehner JN, Pearson EL, Moore C. 2011. Unravelling the means to an end: RNA polymerase II transcription termination. Nat Rev Mol Cell Biol 12: 283–294. [DOI] [PMC free article] [PubMed] [Google Scholar]
- Kwiatkowski TJ Jr, Bosco DA, Leclerc AL, Tamrazian E, Vanderburg CR, Russ C, Davis A, Gilchrist J, Kasarskis EJ, Munsat T, et al. 2009. Mutations in the FUS/TLS gene on chromosome 16 cause familial amyotrophic lateral sclerosis. Science 323: 1205–1208. [DOI] [PubMed] [Google Scholar]
- Lagier-Tourenne C, Polymenidou M, Cleveland DW. 2010. TDP-43 and FUS/TLS: emerging roles in RNA processing and neurodegeneration. Hum Mol Genet 19: R46–R64. [DOI] [PMC free article] [PubMed] [Google Scholar]
- Lagier-Tourenne C, Polymenidou M, Hutt KR, Vu AQ, Baughn M, Huelga SC, Clutario KM, Ling SC, Liang TY, Mazur C, et al. 2012. Divergent roles of ALS-linked proteins FUS/TLS and TDP-43 intersect in processing long pre-mRNAs. Nat Neurosci 15: 1488–1497. [DOI] [PMC free article] [PubMed] [Google Scholar]
- Licatalosi DD, Mele A, Fak JJ, Ule J, Kayikci M, Chi SW, Clark TA, Schweitzer AC, Blume JE, Wang X, et al. 2008. HITS-CLIP yields genome-wide insights into brain alternative RNA processing. Nature 456: 464–469. [DOI] [PMC free article] [PubMed] [Google Scholar]
- Mackenzie IR, Rademakers R, Neumann M. 2010. TDP-43 and FUS in amyotrophic lateral sclerosis and frontotemporal dementia. Lancet Neurol 9: 995–1007. [DOI] [PubMed] [Google Scholar]
- Masuda A, Shen XM, Ito M, Matsuura T, Engel AG, Ohno K. 2008. hnRNP H enhances skipping of a nonfunctional exon P3A in CHRNA1 and a mutation disrupting its binding causes congenital myasthenic syndrome. Hum Mol Genet 17: 4022–4035. [DOI] [PMC free article] [PubMed] [Google Scholar]
- Masuda A, Andersen HS, Doktor TK, Okamoto T, Ito M, Andresen BS, Ohno K. 2012. CUGBP1 and MBNL1 preferentially bind to 3′ UTRs and facilitate mRNA decay. Sci Rep 2: 209. [DOI] [PMC free article] [PubMed] [Google Scholar]
- Menet JS, Rodriguez J, Abruzzi KC, Rosbash M. 2012. Nascent-Seq reveals novel features of mouse circadian transcriptional regulation. eLife 1: e00011. [DOI] [PMC free article] [PubMed] [Google Scholar]
- Munoz MJ, de la Mata M, Kornblihtt AR. 2010. The carboxy terminal domain of RNA polymerase II and alternative splicing. Trends Biochem Sci 35: 497–504. [DOI] [PubMed] [Google Scholar]
- Nag A, Narsinh K, Martinson HG. 2007. The poly(A)-dependent transcriptional pause is mediated by CPSF acting on the body of the polymerase. Nat Struct Mol Biol 14: 662–669. [DOI] [PubMed] [Google Scholar]
- Nakaya T, Alexiou P, Maragkakis M, Chang A, Mourelatos Z. 2013. FUS regulates genes coding for RNA-binding proteins in neurons by binding to their highly conserved introns. RNA 19: 498–509. [DOI] [PMC free article] [PubMed] [Google Scholar]
- Rappsilber J, Ryder U, Lamond AI, Mann M. 2002. Large-scale proteomic analysis of the human spliceosome. Genome Res 12: 1231–1245. [DOI] [PMC free article] [PubMed] [Google Scholar]
- Reppas NB, Wade JT, Church GM, Struhl K. 2006. The transition between transcriptional initiation and elongation in E. coli is highly variable and often rate limiting. Mol Cell 24: 747–757. [DOI] [PubMed] [Google Scholar]
- Rogelj B, Easton LE, Bogu GK, Stanton LW, Rot G, Curk T, Zupan B, Sugimoto Y, Modic M, Haberman N, et al. 2012. Widespread binding of FUS along nascent RNA regulates alternative splicing in the brain. Sci Rep 2: 603. [DOI] [PMC free article] [PubMed] [Google Scholar]
- Schonemann L, Kuhn U, Martin G, Schafer P, Gruber AR, Keller W, Zavolan M, Wahle E. 2014. Reconstitution of CPSF active in polyadenylation: recognition of the polyadenylation signal by WDR33. Genes Dev 28: 2381–2393. [DOI] [PMC free article] [PubMed] [Google Scholar]
- Schor IE, Rascovan N, Pelisch F, Allo M, Kornblihtt AR. 2009. Neuronal cell depolarization induces intragenic chromatin modifications affecting NCAM alternative splicing. Proc Natl Acad Sci 106: 4325–4330. [DOI] [PMC free article] [PubMed] [Google Scholar]
- Schwartz JC, Ebmeier CC, Podell ER, Heimiller J, Taatjes DJ, Cech TR. 2012. FUS binds the CTD of RNA polymerase II and regulates its phosphorylation at Ser2. Genes Dev 26: 2690–2695. [DOI] [PMC free article] [PubMed] [Google Scholar]
- Schwartz JC, Wang X, Podell ER, Cech TR. 2013. RNA seeds higher-order assembly of FUS protein. Cell Rep 5: 918–925. [DOI] [PMC free article] [PubMed] [Google Scholar]
- Schwartz JC, Podell ER, Han SS, Berry JD, Eggan KC, Cech TR. 2014. FUS is sequestered in nuclear aggregates in ALS patient fibroblasts. Mol Biol Cell 25: 2571–2578. [DOI] [PMC free article] [PubMed] [Google Scholar]
- Subramanian A, Tamayo P, Mootha VK, Mukherjee S, Ebert BL, Gillette MA, Paulovich A, Pomeroy SL, Golub TR, Lander ES, et al. 2005. Gene set enrichment analysis: a knowledge-based approach for interpreting genome-wide expression profiles. Proc Natl Acad Sci 102: 15545–15550. [DOI] [PMC free article] [PubMed] [Google Scholar]
- Tan AY, Manley JL. 2009. The TET family of proteins: functions and roles in disease. J Mol Cell Biol 1: 82–92. [DOI] [PMC free article] [PubMed] [Google Scholar]
- Tan AY, Riley TR, Coady T, Bussemaker HJ, Manley JL. 2012. TLS/FUS (translocated in liposarcoma/fused in sarcoma) regulates target gene transcription via single-stranded DNA response elements. Proc Natl Acad Sci 109: 6030–6035. [DOI] [PMC free article] [PubMed] [Google Scholar]
- Tian B, Manley JL. 2013. Alternative cleavage and polyadenylation: the long and short of it. Trends Biochem Sci 38: 312–320. [DOI] [PMC free article] [PubMed] [Google Scholar]
- Ticozzi N, Vance C, Leclerc AL, Keagle P, Glass JD, McKenna-Yasek D, Sapp PC, Silani V, Bosco DA, Shaw CE, et al. 2011. Mutational analysis reveals the FUS homolog TAF15 as a candidate gene for familial amyotrophic lateral sclerosis. Am J Med Genet B Neuropsychiatr Genet 156B: 285–290. [DOI] [PubMed] [Google Scholar]
- Trapnell C, Hendrickson DG, Sauvageau M, Goff L, Rinn JL, Pachter L. 2013. Differential analysis of gene regulation at transcript resolution with RNA-seq. Nat Biotechnol 31: 46–53. [DOI] [PMC free article] [PubMed] [Google Scholar]
- Vance C, Rogelj B, Hortobagyi T, De Vos KJ, Nishimura AL, Sreedharan J, Hu X, Smith B, Ruddy D, Wright P, et al. 2009. Mutations in FUS, an RNA processing protein, cause familial amyotrophic lateral sclerosis type 6. Science 323: 1208–1211. [DOI] [PMC free article] [PubMed] [Google Scholar]
- Wang X, Arai S, Song X, Reichart D, Du K, Pascual G, Tempst P, Rosenfeld MG, Glass CK, Kurokawa R. 2008. Induced ncRNAs allosterically modify RNA-binding proteins in cis to inhibit transcription. Nature 454: 126–130. [DOI] [PMC free article] [PubMed] [Google Scholar]
- Yamazaki T, Chen S, Yu Y, Yan B, Haertlein TC, Carrasco MA, Tapia JC, Zhai B, Das R, Lalancette-Hebert M, et al. 2012. FUS–SMN protein interactions link the motor neuron diseases ALS and SMA. Cell Rep 2: 799–806. [DOI] [PMC free article] [PubMed] [Google Scholar]
- Yang L, Embree LJ, Tsai S, Hickstein DD. 1998. Oncoprotein TLS interacts with serine-arginine proteins involved in RNA splicing. J Biol Chem 273: 27761–27764. [DOI] [PubMed] [Google Scholar]
- Yao C, Biesinger J, Wan J, Weng L, Xing Y, Xie X, Shi Y. 2012. Transcriptome-wide analyses of CstF64-RNA interactions in global regulation of mRNA alternative polyadenylation. Proc Natl Acad Sci 109: 18773–18778. [DOI] [PMC free article] [PubMed] [Google Scholar]
- Zhang Y, Liu T, Meyer CA, Eeckhoute J, Johnson DS, Bernstein BE, Nusbaum C, Myers RM, Brown M, Li W, et al. 2008. Model-based analysis of ChIP-seq (MACS). Genome Biol 9: R137. [DOI] [PMC free article] [PubMed] [Google Scholar]
- Zhou Z, Licklider LJ, Gygi SP, Reed R. 2002. Comprehensive proteomic analysis of the human spliceosome. Nature 419: 182–185. [DOI] [PubMed] [Google Scholar]
Associated Data
This section collects any data citations, data availability statements, or supplementary materials included in this article.