

Abstract
Background.
Sleep and physical activity are both important for cognition. However, few cognitive function studies include comprehensive measurement of both sleep and physical activity. The purpose of this study was to examine the independent and interactive associations of sleep and physical activity in relation to cognitive function in older women.
Methods.
A subset of 121 women from the Healthy Women Study, mean age 73.3 ± 1.7 years, wore an actigraphy sleep monitor, physical activity accelerometer, and kept sleep and physical activity diaries for 7 consecutive days. Executive function was measured with the Digit Symbol Substitution Test and the Trail Making Test B. Verbal fluency was assessed with a word generation task.
Results.
In adjusted models, greater actigraphy-assessed sleep efficiency was associated with more correct responses on the Digit Symbol Substitution Test (β = 0.35, SE = 0.15, p < 0.02). Sleep was not associated with verbal fluency. A significant interaction (p < 0.05) was observed between accelerometer-assessed physical activity and actigraphy-assessed sleep efficiency. Specifically, lower sleep efficiency was associated with poorer performance on both the Digit Symbol Substitution Test and the Trail Making Test B among women with low levels of physical activity but not among women with high levels of physical activity.
Conclusions.
Our findings suggest that greater levels of physical activity may attenuate the negative impact of poor sleep on executive function in older women, with the clearest effects observed using direct measurements of sleep and physical activity.
Key Words: Cognition, Exercise, Physical activity, Public health, Sleep.
Age-related declines in cognitive processes are well documented (1), with executive functions at especially high risk for deteriorating with age (2,3). Executive functions (ie, attention, reasoning, impulse control, working memory) enable an individual to manage time, plan, organize, remember details, and behave appropriately (4). Performance of both complex activities (eg, using the phone, preparing a meal, driving) (5) and basic activities of daily living (eg, bathing, eating, dressing) (6) are affected by executive function. Thus, preserving executive function is vital for everyday functioning as well as for maintaining autonomy and quality of life, which is of great public health importance.
Sleep (7,8) and physical activity (PA) (9–11) are thought to be important for cognitive function. However, few studies of cognitive function include comprehensive measurement of both sleep and PA. Additionally, few studies have considered how PA may affect the associations between sleep and cognitive function. Studying these relationships in older women may be particularly pertinent given the high prevalence of sleep disturbances (12,13) and low levels of PA (14,15) generally observed among this population subgroup. Moreover, preservation of executive function in woman may have the most profound implications for public health because women live longer than men and are subsequently at greater risk for Alzheimer’s disease (16).
The purpose of this study was to assess the associations of both sleep and PA with cognitive function in older women. We hypothesized that poor sleep and low PA would be associated with worse cognitive function. Additionally, we examined the moderating effect of PA on associations between sleep and cognitive function. Importantly, we considered both direct (ie, device-based) and self-reported (ie, diary) measurements of sleep and PA.
Methods
Study Design and Participants
The Healthy Women Study is a prospective cohort study designed to assess cardiovascular health across the menopausal transition. Detailed descriptions of the Healthy Women Study are published elsewhere (17). Briefly, between 1983 and 1984 premenopausal women (42–50 years) without hypertension or diabetes were recruited. Eligible women (N = 541) were assessed at baseline and approximately 2, 5, and 8 years postmenopause. An ancillary study was added to the Healthy Women Study protocol in 2010–2011, which collected sleep, PA, and cognitive function data on a subset of women.
Participants in the ancillary study underwent seven consecutive days of 24-hour sleep–wake monitoring. Direct measures of sleep and PA were obtained using an actigraphic sleep monitor worn on the nondominant wrist and an accelerometer worn on the dominant hip, respectively. Participants were instructed to wear both devices at all times during the day and night for the 7-day period; however, the accelerometer was removed when bathing or doing water activities. Self-reported measures of sleep and PA were assessed via sleep and PA diaries completed each day by the participant. Cognitive function was assessed on a separate visit. Participants provided written informed consent and the protocol was approved by the University of Pittsburgh institutional review board.
Measures
Sleep.
Actigraphy.—The Actiwatch-2 (Mini Mitter Division of Respironics Inc.) contains speed and motion-sensitive sensors and has been previously validated as a direct measurement of sleep (18). Data from the Actiwatch were downloaded and analyzed using Actiware software with a 60-second epoch. Bed times and wake times from the sleep diary were used to define rest intervals for calculation of sleep–wake variables. Actigraphy variables considered here were total sleep time (within the bedtime and wakeup time) and sleep efficiency (total sleep time/time in bed × 100%). Average values over the week were computed for participants with at least four nights of actigraphy data.
Sleep diary.—Upon waking each morning, participants recorded the time they woke up and the time they went to bed the previous night. They also reported the amount of time it took to fall asleep and the number and minutes of awakenings during the night. Self-reported total sleep time and sleep efficiency were calculated from these parameters. Weekly averages of diary-reported sleep variables were computed for participants who completed the sleep diary for a minimum of 3 days.
Physical activity.
Accelerometer.—The ActiGraph GT1M accelerometer (Pensacola, FL) was used as a direct assessment of PA. The ActiGraph GT1M accelerometer is a small (3.8 × 3.7 × 1.8 cm), uniaxial monitor that measures acceleration in the vertical plane. The reliability and validity of the ActiGraph GT1M accelerometer have been described previously (19,20). Data were collected in 10-second epochs but reintegrated and reported as 60-second epochs for comparison with the Actiwatch data. Accelerometer data were downloaded and screened for daily wear time. Daily wear time was determined by removing any intervals of nonwear (≥20 minutes of no detected movement) and any periods of sleep, as indicated by the Actiwatch. Daily summary estimates were computed if daily wear time was at least 10 hours. Daily activity counts from the accelerometer, expressed as counts per minute per day (ct·min− 1·d− 1), were calculated using summed daily counts detected over daily wear time periods. Time spent per day (min·d− 1) in moderate to vigorous physical activity (MVPA) was computed by summing the accumulated time spent above the moderate intensity threshold value (>760 ct·min− 1) proposed by Matthews and colleagues (19). The MVPA cutoff value of 760 ct·min− 1 represents an intensity of three metabolic equivalents. Average values over the week were computed for participants who had a minimum of four valid days of accelerometer data.
PA diary.—Participants completed a 7-day PA diary in which they recorded any leisure-time physical activity (LTPA) that lasted at least 10 minutes. The total amount of time spent doing LTPA each day (min·d− 1) was calculated by summing the time, in minutes, for all activities reported that day. Additionally, the overall volume of LTPA each day was calculated as the product of the duration and frequency of each reported activity, weighted by an estimate of the metabolic equivalent value (21) of each recorded activity (MET·h·d− 1). All participants completed the PA diary for 7 days. Weekly averages for diary-reported PA variables were computed by averaging the daily PA estimates over the week.
Cognitive function.
Global cognition.—The Modified Mini-Mental State Examination (3MS) (22) is an expanded version of the Mini-Mental State Examination (23) and assesses early signs of cognition dysfunction. Scores on the 3MS range from 0 to 100, with higher scores representing better overall cognition. 3MS scores ≥80 are generally considered to represent normal cognitive function (24). One participant was missing data for the 3MS.
Executive function.—Two tests were used to assess executive function: the Digit Symbol Substitution Test (DSST) (25,26) and the Trail Making Test (Trails A and B) (27). The DSST measures attention, psychomotor speed, visual spatial skills, and set shifting, which are reflective of executive function. Participants were asked to provide the corresponding symbol for a series of digits by referring to a key (ie, nine digit-symbol pairs) that was provided. The score on the DSST is the total number of correct responses in 90 seconds; higher scores reflect better executive function. The Trail Making Test provides information on visual search, scanning, speed of processing, and mental flexibility (28), with lower (ie, faster) times for completion reflecting better executive function. Trails A required participants to draw a line sequentially connecting numbers (eg, 1-2-3) as quickly as possible without lifting the pencil off the page. If an error was made, the experimenter indicated the error and allowed the participant to correct the mistake and continue the task. Trails B was similar except numbers and letters were alternated in a progressive sequence (eg, 1-A-2-B). Completion times were measured for Trails A and Trails B. One participant was missing data for Trails A. Given the incomplete data and lack of significant findings for Trails A, only results from Trails B are presented here.
Verbal fluency.—Participants completed a word generation task to assess their letter and animal fluencies (29). For letter fluency, participants named as many words as possible that began with the letters F and S for 60 seconds each. Participants were instructed not to say numbers, proper names, or different variations of the same word (eg, fall, falling, fallen). For animal fluency, participants named as many animals as possible in 60 seconds. The total number of correct responses for letters (F + S) and animals were calculated.
Covariates.
Education and race were assessed at the baseline exam. Education was categorized into three groups (≤high school, some college or vocational training, ≥college graduate) for analysis. All other covariates were measured at the 2010–2011 exam. Height (meters [m]) and weight (kilograms [kg]) were measured with a stadiometer and calibrated balance beam scale, respectively. Body mass index was calculated as kg/m2. Medical history, including medication use, was assessed via questionnaire. Depressive symptoms were assessed with the Beck Depression Inventory (30). One question on the Beck Depression Inventory pertaining to sleep was removed for analyses. Current hypertension was defined as participant self-report of ever having high blood pressure and current antihypertensive use. Sleep medication use was considered as a covariate but was not associated with the outcomes and did not affect any of the models. Therefore, sleep medication was not included as a covariate in the final analyses. Race was also considered as a covariate but was not included in the final analysis because more than 90% of the sample was white.
Analytic Plan
Average weekly values for each sleep and PA variable, as detailed above, were used in all analyses. Non-normal variables were transformed for analyses. PA variables were square root transformed; Trails B and depressive symptoms scores were log transformed.
Spearman rank order correlation coefficients were used to assess the associations between direct and self-reported (a) sleep estimates and (b) PA estimates. Simple linear regression models were used to assess the unadjusted associations of sleep and PA variables with cognitive function. Multiple regression models were used to determine the independent association of each sleep and PA variable with cognitive function after adjustment for age, education, body mass index, hypertension, and depressive symptoms. Separate models were constructed for each executive function (DSST, Trails B) and each verbal fluency (letters, animals) tasks as outcome variables.
Next, we considered whether PA moderated the influence of sleep on cognitive function. Interactions between each sleep variable and each PA variable were assessed via cross-product terms in regression models. When a significant interaction was detected, relationships between the sleep variable and the cognitive function task were examined stratified by a median split of each PA variable. An alpha level of 0.05 was used for all analyses.
Results
Data from 121 women who completed sleep, PA, and cognitive function protocols were included for analysis. Characteristics of the participants are presented in Table 1. Women were mostly white and well educated. Furthermore, the 3MS median score was well above the normal clinical cutoff, with only one woman having a 3MS score below 80. Findings were similar when excluding this participant from analyses (data not shown).
Table 1.
Descriptive Characteristics of the Sample of Women (N = 121) From the Healthy Women Study
| Range | ||
|---|---|---|
| Age, mean (SD), y | 73.3 (1.7) | 68–77 |
| BMI, mean (SD), kg/m2 | 27.7 (5.1) | 18.5–45.1 |
| White, n (%) | 111 (91.7) | |
| Education, n (%) | ||
| High school or less | 28 (23.1) | |
| Some college | 23 (19.0) | |
| 4-y degree or higher | 70 (57.9) | |
| Hypertension, n (%) | 51 (42.2) | |
| Sleep medication use, n (%) | 16 (13.2) | |
| Beck Depression Inventory, median (IQR) | 5.0 (6.0) | 0–19 |
| Sleep | ||
| Actigraphy sleep time, mean (SD), min | 396.6 (53.3) | 234.9–499.6 |
| Actigraphy efficiency, mean (SD), % | 84.7 (6.2) | 66.6–98.2 |
| Diary sleep time, mean (SD), min | 420.0 (60.2) | 285.0–588.8 |
| Diary efficiency, mean (SD), % | 92.9 (5.8) | 67.3–99.5 |
| Physical activity | ||
| Accelerometer count average, median (IQR), ct·min−1·d−1 | 190.5 (91.1) | 59.3–594.1 |
| Accelerometer MVPA, median (IQR), min·d−1 | 61.9 (45.8) | 9.7–185.5 |
| Diary LTPA, median (IQR), min·d−1 | 49.3 (38.9) | 0.0–212.1 |
| Diary LTPA, median (IQR), MET·h·d−1 | 2.0 (2.4) | 0.0–100.1 |
| Cognitive function | ||
| Modified Mini-Mental State Examination, median (IQR)* | 97.0 (5.0) | 73–100 |
| Digit Symbol Substitution Test, mean (SD), # correct | 49.3 (9.9) | 21–73 |
| Trail Making Test A, median (IQR), s* | 36.0 (13.5) | 16–71 |
| Trail Making Test B, median (IQR), s | 80.0 (40.0) | 40–240 |
| Letter fluency (F + S), mean (SD), # correct | 28.26 (7.9) | 1–29 |
| Animal fluency, mean (SD), # correct | 17.74 (4.7) | 11–49 |
Notes: BMI = body mass index; IQR = interquartile range; LTPA = leisure-time physical activity; MET = metabolic equivalent; MVPA = moderate to vigorous intensity physical activity; SD = standard deviation.
*N = 120.
Self-reported total sleep time was highly correlated with actigraphy-assessed total sleep time (r = 0.70, p < .001); whereas, self-reported sleep efficiency was less correlated with actigraphy-assessed sleep efficiency (r = 0.19, p < .05). PA variables were all significantly correlated (p < .01).
Sleep and Cognitive Function
In unadjusted models, lower actigraphy-assessed sleep efficiency was associated with poorer performance on both executive function tasks. However, when adjusting for covariates, greater actigraphy-assessed sleep efficiency remained significantly associated only with more correct responses on the DSST (β = 0.35, SE = 0.15, p < .02). Shorter diary-reported total sleep time was associated with less time to complete Trails B, which remained significant when adjusting for covariates (β = 0.001, SE = 0.001, p < .04). No other sleep variables were associated with performance on executive function tasks. Additionally, no sleep variable was associated with verbal fluency.
PA and Cognitive Function
In unadjusted models, more minutes of accelerometer-assessed MVPA was significantly associated with higher scores on the letter fluency (β = 0.69, SE = 0.32, p < .04) task. However, this association was attenuated when adjusting for covariates. In adjusted models, only minutes of diary-reported LTPA was significantly associated with longer time to complete Trails B (β = 0.001, SE = 0.001, p < .02).
Interaction Between Sleep and PA
Accelerometer-derived PA significantly modified the association between actigraphy-assessed sleep efficiency and executive function (Figure 1). Worse sleep efficiency was associated with poorer performance on the DSST (adjusted interaction p < .04) and the Trails B (adjusted interaction p < .03) tasks primarily among participants with low levels of accelerometer-assessed MVPA. Similar results were found using average accelerometer counts as the PA variable. Diary-reported LTPA did not modify the relationship between sleep and executive function. Interactions between sleep and PA were not significant for verbal fluency.
Figure 1.
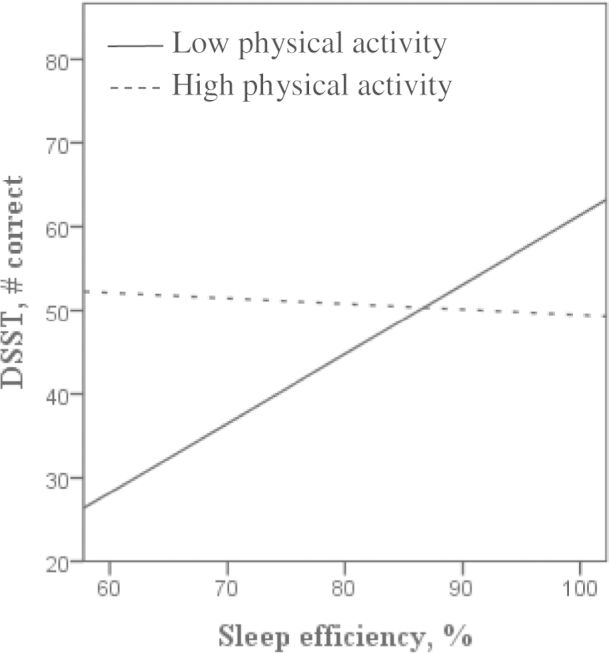
Unadjusted associations between actigraphy-assessed sleep efficiency and Digit Symbol Substitution Test (DSST) scores by median split of accelerometer-assessed physical activity.
Table 2 shows the associations between actigraphy-assessed sleep efficiency and executive function tasks by a median split of each PA variable. Worse sleep efficiency was associated with poorer performance on the DSST among participants with low levels of both accelerometer-derived (p < .001) and diary-reported (p ≤ .03) PA. Similar results were found for Trails B. Actigraphy-assessed sleep efficiency was not associated with executive function among individuals high in PA.
Table 2.
Associations Between Actigraphy-Assessed Sleep Efficiency and Executive Function by Median Split of Physical Activity Variables
| DSST | Trails B* | |||
|---|---|---|---|---|
| B (SE) | p value | B (SE) | p value | |
| Low physical activity (N = 61) | ||||
| Accelerometer counts, ct·min−1·d−1† | 0.86 (0.21) | <0.001 | −0.03 (0.01) | 0.002 |
| Accelerometer MVPA, min† | 0.80 (0.20) | <0.001 | −0.02 (0.01) | 0.006 |
| Diary LTPA, min·d−1† | 0.63 (0.23) | 0.008 | −0.02 (0.01) | 0.08 |
| Diary LTPA, MET·h·d−1† | 0.52 (0.23) | 0.03 | −0.02 (0.01) | 0.04 |
| High physical activity (N = 60) | ||||
| Accelerometer counts, ct·min−1·d−1† | −0.12 (0.20) | 0.56 | 0.004 (0.01) | 0.56 |
| Accelerometer MVPA, min† | −0.13 (0.21) | 0.55 | 0.003 (0.01) | 0.69 |
| Diary LTPA, min·d−1† | 0.11 (0.20) | 0.54 | −0.003 (0.01) | 0.57 |
| Diary LTPA, MET·h·d−1† | 0.25 (0.21) | 0.24 | −0.01 (0.01) | 0.20 |
Notes: Covariates: age, education, body mass index, hypertension, and depressive symptoms. DSST = Digit Symbol Substitution Test; LTPA = leisure-time physical activity; MET = metabolic equivalent; MVPA = moderate to vigorous physical activity; Trails B = Trail Making Test B.
*Log transformed.
†Square root transformed.
In additional analyses, we considered performance on the Trail Making Test as a difference score (Trails B time − Trails A time) and results were unchanged.
Discussion
Few cognitive function studies include detailed assessment of both sleep and PA. Notably, the present study examined the independent and joint influences of both direct and self-reported measures of sleep and PA in associations with cognitive function. Our findings in older women suggest that greater levels of PA may attenuate the negative impact of poor sleep on executive functions, with the most robust effects observed using direct measurements of sleep and PA.
Previous work has demonstrated that sleep and PA are independently associated with cognitive function and most markedly with executive functions (7,9). In the present study, we hypothesized that poor sleep would be associated with worse cognitive function and that greater levels of PA would be associated with better cognitive function. Our results provide some evidence that actigraphy-assessed sleep efficiency and accelerometer-determined PA were associated with performance on cognitive function tasks in the hypothesized directions. However, these findings were modest and inconclusive. Interestingly, findings from main effect models were unimpressive for both direct assessment and self-reported measures of sleep and PA.
Although we observed limited independent associations between sleep and PA variables with performance on cognitive function tasks, a significant interaction was observed between actigraphy-assessed sleep efficiency and accelerometer-assessed PA in relation to executive function. Notably, actigraphy-assessed sleep efficiency was associated with worse performance on both the DSST and the Trails B tasks primarily among less active women. Moreover, the interaction between direct assessments of sleep efficiency and PA was significant for both average activity counts and time spent in higher intensity activities (ie, MVPA), suggesting that overall activity volume, and not just higher intensity activity, may be important for buffering the effects of poor sleep on executive function. Although the formal interaction test between actigraphy-assessed sleep efficiency and self-reported PA was not statistically significant, in stratified models, a similar pattern was observed across all PA estimates (accelerometer, diary). We consider this to be an important finding given the aging population and the high prevalence of sleep disturbances observed among older women. Thus, greater levels of PA in older women may offer protection against the detrimental effects of poor sleep on executive function, in addition to the other well-documented benefits of a physically active lifestyle.
In the present analytic sample, actigraphy-assessed sleep efficiency, but not total sleep time, was associated with executive function. These findings are consistent with Blackwell and colleagues (31) who reported that actigraphy-assessed sleep efficiency, but not total sleep time, was associated with executive function. Similar findings have also been reported using polysomnography measures of sleep (32,33). Perhaps sleep disturbance or sleep quality, rather than the total amount of time spent sleeping, is most important for executive function. It is also interesting that only actigraphy-assessed sleep efficiency, and not diary-reported sleep efficiency, showed associations with executive function. However, self-reported sleep is often discrepant from direct measures, with some evidence to suggest that women report greater discrepancies than men (13,34). Consistent with previous work, only a modest correlation between actigraphy-assessed and diary-reported sleep efficiency was observed in the present study. Thus, including both direct and self-reported measures of sleep, especially in studies of women, is important given the distinctness of these measures and the potential for these measures to have differential associations with cognitive function or other health outcomes.
The study had several limitations. The sample was primarily white, well-educated, older women with good overall cognition, which may affect the external validity of related study findings. Furthermore, our results may be biased based on the subset of women who were willing and able to complete all study measures. We measured sleep and PA across an entire week close in time to cognitive function testing. However, this week may not be reflective of habitual sleep or PA patterns of the participants. Additionally, we are unable to separate the acute versus chronic influences of these behaviors. We did not examine any potential mechanisms whereby high levels of PA might buffer the impact of poor sleep on executive function, which is an important area for future work. Finally, our cross-sectional study design prohibits us from determining causality.
The study’s strengths include concurrent collection of direct and self-reported measures of both sleep and PA activity over an entire week in the participant’s natural environment. We measured cognitive function in two domains (executive function, verbal fluency). Our results suggest that the joint influence of sleep and PA may not generalize across all cognitive domains and may be specific to executive function. Moreover, we measured executive function with two commonly used tasks and found similar results across tasks. Although future work is needed to confirm our findings, our results underscore the importance of considering both sleep and PA in future cognitive function studies.
Funding
This work was supported by the National Institutes of Health (R01 HL28266, T32 HL07560).
References
- 1. Salthouse T. Consequences of age-related cognitive declines. Annu Rev Psychol. 2012;63:201–226. :10.1146/annurev-psych-120710-100328 [DOI] [PMC free article] [PubMed] [Google Scholar]
- 2. De Luca CR, Wood SJ, Anderson V, et al. Normative data from the CANTAB. I: development of executive function over the lifespan. J Clin Exp Neuropsychol. 2003;25:242–254. :10.1076/jcen.25.2.242.13639 [DOI] [PubMed] [Google Scholar]
- 3. Keller JN. Age-related neuropathology, cognitive decline, and Alzheimer’s disease. Ageing Res Rev. 2006;5:1–13. :10.1016/j.arr.2005.06.002 [DOI] [PubMed] [Google Scholar]
- 4. Diamond A. Executive functions. Annu Rev Psychol. 2013;64:135–168. :10.1146/annurev-psych-113011-143750 [DOI] [PMC free article] [PubMed] [Google Scholar]
- 5. Carlson MC, Fried LP, Xue QL, Bandeen-Roche K, Zeger SL, Brandt J. Association between executive attention and physical functional performance in community-dwelling older women. J Gerontol B Psychol Sci Soc Sci. 1999;54:S262–S270. :10.1093/geronb/54B.5.S262 [DOI] [PubMed] [Google Scholar]
- 6. Johnson JK, Lui LY, Yaffe K. Executive function, more than global cognition, predicts functional decline and mortality in elderly women. J Gerontol A Biol Sci Med Sci. 2007;62:1134–1141. [DOI] [PMC free article] [PubMed] [Google Scholar]
- 7. Wilckens KA, Erickson KI, Wheeler ME. Age-related decline in controlled retrieval: the role of the PFC and sleep. Neural Plast. 2012;2012:624795. :10.1155/2012/624795 [DOI] [PMC free article] [PubMed] [Google Scholar]
- 8. Martella D, Casagrande M, Lupiáñez J. Alerting, orienting and executive control: the effects of sleep deprivation on attentional networks. Exp Brain Res. 2011;210:81–89. [DOI] [PubMed] [Google Scholar]
- 9. Kramer AF, Erickson KI, Colcombe SJ. Exercise, cognition, and the aging brain. J Appl Physiol. 2006;101:1237–1242. :10.1152/japplphysiol.00500.2006 [DOI] [PubMed] [Google Scholar]
- 10. Colcombe SJ, Kramer AF, McAuley E, Erickson KI, Scalf P. Neurocognitive aging and cardiovascular fitness: recent findings and future directions. J Mol Neurosci. 2004;24:9–14. :10.1385/JMN:24:1:009 [DOI] [PubMed] [Google Scholar]
- 11. Wendell CR, Gunstad J, Waldstein SR, Wright JG, Ferrucci L, Zonderman AB. Cardiorespiratory fitness and accelerated cognitive decline with aging. J Gerontol A Biol Sci Med Sci. 2014;69:455–462. :10.1093/gerona/glt144 [DOI] [PMC free article] [PubMed] [Google Scholar]
- 12. Kravitz HM, Zhao X, Bromberger JT, et al. Sleep disturbance during the menopausal transition in a multi-ethnic community sample of women. Sleep. 2008;31:979–990. [PMC free article] [PubMed] [Google Scholar]
- 13. Unruh ML, Redline S, An MW, et al. Subjective and objective sleep quality and aging in the sleep heart health study. J Am Geriatr Soc. 2008;56:1218–1227. :10.1111/j.1532-5415.2008.01755.x [DOI] [PubMed] [Google Scholar]
- 14. Bassett DR, Jr, Wyatt HR, Thompson H, Peters JC, Hill JO. Pedometer-measured physical activity and health behaviors in U.S. adults. Med Sci Sports Exerc. 2010;42:1819–1825. :10.1249/MSS.0b013e3181dc2e54 [DOI] [PMC free article] [PubMed] [Google Scholar]
- 15. Tudor-Locke C, Schuna JM, Jr, Barreira TV, et al. Normative steps/day values for older adults: NHANES 2005-2006. J Gerontol A Biol Sci Med Sci. 2013;68:1426–1432. :10.1093/gerona/glt116 [DOI] [PubMed] [Google Scholar]
- 16. Thies W, Bleiler L. 2013 Alzheimer’s disease facts and figures. Alzheimers Dement. 2013;9:208–245. :10.1016/j.jalz.2013.02.003 [DOI] [PubMed] [Google Scholar]
- 17. Matthews KA, Meilahn E, Kuller LH, Kelsey SF, Caggiula AW, Wing RR. Menopause and risk factors for coronary heart disease. N Engl J Med. 1989;321:641–646. :10.1056/NEJM198909073211004 [DOI] [PubMed] [Google Scholar]
- 18. Kushida CA, Chang A, Gadkary C, Guilleminault C, Carrillo O, Dement WC. Comparison of actigraphic, polysomnographic, and subjective assessment of sleep parameters in sleep-disordered patients. Sleep Med. 2001;2:389–396. [DOI] [PubMed] [Google Scholar]
- 19. Matthews CE. Calibration of accelerometer output for adults. Med Sci Sports Exerc. 2005;37(suppl 11):S512–S522. :10.1249/01.mss.0000185659.11982.3d [DOI] [PubMed] [Google Scholar]
- 20. Nichols JF, Morgan CG, Chabot LE, Sallis JF, Calfas KJ. Assessment of physical activity with the Computer Science and Applications, Inc., accelerometer: laboratory versus field validation. Res Q Exerc Sport. 2000;71:36–43. :10.1080/02701367.2000.10608878 [DOI] [PubMed] [Google Scholar]
- 21. Ainsworth BE, Haskell WL, Whitt MC, et al. Compendium of physical activities: an update of activity codes and MET intensities. Med Sci Sports Exerc. 2000;32(suppl 9):S498–S504. [DOI] [PubMed] [Google Scholar]
- 22. Teng EL, Chui HC. The Modified Mini-Mental State (3MS) examination. J Clin Psychiatry. 1987;48:314–318. [PubMed] [Google Scholar]
- 23. Folstein MF, Folstein SE, McHugh PR. “Mini-mental state”. A practical method for grading the cognitive state of patients for the clinician. J Psychiatr Res. 1975;12:189–198. [DOI] [PubMed] [Google Scholar]
- 24. McDowell I, Kristjansson B, Hill GB, Hébert R. Community screening for dementia: the Mini Mental State Exam (MMSE) and Modified Mini-Mental State Exam (3MS) compared. J Clin Epidemiol. 1997;50:377–383. [DOI] [PubMed] [Google Scholar]
- 25. Wechsler D. Wechsler Adult Intelligence Scale. 3rd ed. San Antonio, TX: Harcourt Assessment; 1997. [Google Scholar]
- 26. Beres CA, Baron A. Improved digit symbol substitution by older women as a result of extended practice. J Gerontol. 1981;36:591–597. :10.1093/geronj/36.5.591 [DOI] [PubMed] [Google Scholar]
- 27. Gaudino EA, Geisler MW, Squires NK. Construct validity in the Trail Making Test: what makes Part B harder? J Clin Exp Neuropsychol. 1995;17:529–535. :10.1080/01688639508405143 [DOI] [PubMed] [Google Scholar]
- 28. Tombaugh TN. Trail Making Test A and B: normative data stratified by age and education. Arch Clin Neuropsychol. 2004;19:203–214. :10.1016/S0887-6177(03)00039-8 [DOI] [PubMed] [Google Scholar]
- 29. Spreen O, Strauss E. A Compendium of Neuropsychological Tests: Administration, Norms, and Commentary. 2nd ed. New York, NY: Oxford University Press; 1998. [Google Scholar]
- 30. Beck AT, Ward CH, Mendelson M, Mock J, Erbaugh J. An inventory for measuring depression. Arch Gen Psychiatry. 1961;4:561–571. [DOI] [PubMed] [Google Scholar]
- 31. Blackwell T, Yaffe K, Ancoli-Israel S, et al. Poor sleep is associated with impaired cognitive function in older women: the study of osteoporotic fractures. J Gerontol A Biol Sci Med Sci. 2006;61:405–410. [DOI] [PubMed] [Google Scholar]
- 32. Bastien CH, Fortier-Brochu E, Rioux I, LeBlanc M, Daley M, Morin CM. Cognitive performance and sleep quality in the elderly suffering from chronic insomnia. Relationship between objective and subjective measures. J Psychosom Res. 2003;54:39–49. :10.1016/S0022-3999(03)00548-8 [DOI] [PubMed] [Google Scholar]
- 33. Foley DJ, Masaki K, White L, Larkin EK, Monjan A, Redline S. Sleep-disordered breathing and cognitive impairment in elderly Japanese-American men. Sleep. 2003;26:596–599. [DOI] [PubMed] [Google Scholar]
- 34. van den Berg JF, Miedema HM, Tulen JH, Hofman A, Neven AK, Tiemeier H. Sex differences in subjective and actigraphic sleep measures: a population-based study of elderly persons. Sleep. 2009;32:1367–1375. [DOI] [PMC free article] [PubMed] [Google Scholar]