

Post-stroke fatigue is common, but its causes are unclear. Using TMS to investigate motor functioning in affected individuals, Kuppuswamy et al. show that low levels of excitability of the cortical areas that control motor output are associated with high levels of post-stroke fatigue.
Keywords: stroke rehabilitation, motor cortex, motor evoked potentials, transcranial magnetic stimulation, behavioural neurology
Abstract
The pathophysiology of post-stroke fatigue is poorly understood although it is thought to be a consequence of central nervous system pathophysiology. In this study we investigate the relationship between corticomotor excitability and self-reported non-exercise related fatigue in chronic stroke population. Seventy first-time non-depressed stroke survivors (60.36 ± 12.4 years, 20 females, 56.81 ± 63 months post-stroke) with minimal motor and cognitive impairment were included in the cross-sectional observational study. Fatigue was measured using two validated questionnaires: Fatigue Severity Scale 7 and Neurological Fatigue Index – Stroke. Perception of effort was measured using a 0–10 numerical rating scale in an isometric biceps hold-task and was used as a secondary measure of fatigue. Neurophysiological measures of corticomotor excitability were performed using transcranial magnetic stimulation. Corticospinal excitability was quantified using resting and active motor thresholds and stimulus-response curves of the first dorsal interosseous muscle. Intracortical M1 excitability was measured using paired pulse paradigms: short and long interval intracortical inhibition in the same hand muscle as above. Excitability of cortical and subcortical inputs that drive M1 output was measured in the biceps muscle using a modified twitch interpolation technique to provide an index of central activation failure. Stepwise regression was performed to determine the explanatory variables that significantly accounted for variance in the fatigue and perception scores. Resting motor threshold (R = 0.384; 95% confidence interval = 0.071; P = 0.036) accounted for 14.7% (R2) of the variation in Fatigue Severity Scale 7. Central activation failure (R = 0.416; 95% confidence interval = −1.618; P = 0.003) accounted for 17.3% (R2) of the variation in perceived effort score. Thus chronic stroke survivors with high fatigue exhibit high motor thresholds and those who perceive high effort have low excitability of inputs that drive motor cortex output. We suggest that low excitability of both corticospinal output and its facilitatory synaptic inputs from cortical and sub-cortical sites contribute to high levels of fatigue after stroke.
Introduction
Fatigue is one of the most common self-reported symptoms after stroke (Christensen et al., 2008; Flinn and Stube, 2010; Barbour and Mead, 2012; Eilertsen et al., 2013) and is thought to be a consequence of CNS pathophysiology (Staub and Bogousslavsky, 2001; De Groot et al., 2003; Winward et al., 2009; Kutlubaev and Mead, 2012). Despite the high prevalence of fatigue, its nature and time course varies across different neurological conditions (Friedman and Friedman, 2001; Schepers et al., 2006; Snaphaan et al., 2011; Andersen et al., 2012; Naess et al., 2012; Hildebrandt and Eling, 2014). It is now widely accepted that fatigue is not a non-specific reaction to damage to the CNS but a disease-specific symptom and can occur independently of co-morbidities (van Eijsden et al., 2012; Ghajarzadeh et al., 2013; Storch et al., 2013). Fatigue after stroke is chronic (Ingles et al., 1999; Schepers et al., 2006; Snaphaan et al., 2011), unrelated to prior activity (Tseng et al., 2010), can be both physical and mental (Barbour and Mead, 2012; Young et al., 2013) with a higher reported incidence in survivors with minimal impairment (Van Zandvoort et al., 1998; Ingles et al., 1999; Staub and Bogousslavsky, 2001). In this study we investigated the underlying neurophysiological mechanisms of primary, non-exercise related, self-reported, physical fatigue in stroke survivors with minimal impairment.
There is no accepted common definition of fatigue because of its psychophysical and multidimensional nature. In this study we adopt a modified version of a clinically relevant definition previously proposed: ‘fatigue is a feeling arising from difficulty in initiation of or sustaining voluntary effort’ (Chaudhuri and Behan, 2004). Voluntary effort is controlled by numerous biological systems (Fig. 1), anyone of which when perturbed could give rise to the feeling of fatigue. Imbalance in homeostatic mechanisms such as sleep disturbance can give rise to fatigue but pharmacological intervention in those with post-stroke fatigue improves symptoms of sleep disturbance while fatigue remains unaltered (Brioschi et al., 2009). Similarly, disturbances within the motivational and limbic systems e.g. depression, could also give rise to fatigue, but in stroke survivors with both fatigue and depression, administration of fluoxetine, duloxetine or citalopram significantly improves depression but not fatigue (Choi-Kwon et al., 2007; Karaiskos et al., 2012). The remaining element of the ‘controllers of voluntary effort’ matrix (Fig. 1) to consider is the executive system comprising the interrelated circuitry of sensory afferents, cognitive processing and motor efferents. Despite physical exercise exacerbating fatigue in stroke patients, exercise is not the predominant trigger (Staub and Bogousslavsky, 2001; Annoni et al., 2008) suggesting that activity in the sensory afferents is not the primary source of fatigue. Recently it has been proposed that fatigue and fatigability are two independent constructs in neurological diseases and that fatigue arises more centrally (Tseng et al., 2010; Kluger et al., 2013), possibly involving the motor efferents.
Figure 1.

Adapted from Chaudhuri and Behan (2004).
The involvement of motor efferents in generating post-stoke fatigue can be studied using transcranial magnetic stimulation (TMS) (Taylor et al., 2006), a form of non-invasive brain stimulation regularly used to investigate central motor circuitry (Eldaief et al., 2013). TMS over motor cortex evokes corticospinal activity and a muscle twitch in contralateral muscles. Motor threshold, a TMS measure, partly depends on the excitability of the cortex, which in turn depends on the threshold for stimulating nerve axons, as well as for evoking synaptic activity. All other things being equal, threshold gives an overall measure of how easy it is to activate motor cortex output and might change with fatigue. In other neurological conditions such as multiple sclerosis, those with high levels of fatigue exhibited significantly lower levels of M1 excitability both at rest (Liepert et al., 2005) and before movement (Morgante et al., 2011) after adjusting for severity of motor impairment. In this study we hypothesize that stroke survivors with high fatigue will exhibit low corticospinal excitability.
Motor cortex output is also modulated by inhibitory interneurons within the motor cortex whose contribution to M1 output can be quantified by measuring the attenuation of response to a test TMS pulse that is preceded by a conditioning TMS pulse. By varying the interval between the test and conditioning pulses, the different GABAergic inhibitory circuits can be studied (Kujirai et al., 1993). High levels of intracortical inhibition could potentially lead to low M1 output, therefore stroke survivors with high fatigue may exhibit high levels of intra-cortical inhibition.
Volitional movement depends strongly on the output of M1 and the sense of effort may describe the sensation produced when one initiates inputs from other parts of the nervous system to drive M1. TMS can be used to estimate whether ‘volition’ is maximally driving M1 output using the modified twitch interpolation technique (Todd et al., 2003). In essence, if the output of M1 is being maximally activated, then a TMS pulse cannot recruit any additional muscle force. If TMS can recruit additional output during maximum effort then voluntary drive of motor cortex is said to be suboptimal: this is known as central activation failure (CAF). Exercise increases CAF more than normal in patients with post-stroke fatigue (Knorr et al., 2011), which suggests that one or more of the inputs that drive M1 output are impaired in their ability to activate motor outputs. However, although this might account for a perception of increased effort during volitional contraction, it does not address the cause of non-exercise related fatigue.
Attempts at understanding what causes non-exercise related fatigue after stroke have thus far focussed on systems other than the central motor circuitry but have had limited results. In this study we examine whether fatigue after stroke may relate to other measures of corticospinal function such as its intrinsic levels of excitability or inhibition. These could change the relationship between inputs into motor cortex and the final output that is produced. Specifically we hypothesize that reducing this relationship is associated with the perception of post-stroke fatigue, whereas CAF during effort may be more closely related to perception of muscular effort. Results of this study will provide some mechanistic understanding of what might cause fatigue and open the way towards better fatigue management strategies.
Materials and methods
Study design
Cross-sectional observational study
The study was approved by the Riverside Research Ethics Committee (12/LO/1474). Stroke survivors were recruited consecutively via the Thames Stroke Research Network from the University College NHS Trust Hospital, Epsom NHS Trust Hospital, Royal Surrey NHS Trust Hospital and from community stroke groups.
Patient characteristics
Seventy stroke survivors (60.36 ± 12.4 years, 20 females, 56.81 ± 63 months post-stroke) with a first-time ischaemic or haemorrhagic lesion participated in the study. Patients were screened for compatibility with TMS procedures. Additional exclusion criteria included, centrally acting medication, high score on the Hospital Anxiety and Depression Scale (>11) and poor function. Functional screening included upper limb functional tests and cognitive tests. Poor upper limb function was defined as having <60% of the unaffected limb score in more than one of the following measures: (i) Nine Hole Peg Test; (ii) Action Research Arm Test (ARAT); and (iii) Grip strength. Poor cognitive function was defined as a score >5 on the Sustained Attention Index and Symbol Digit Modalities Test.
Functional screening
Upper limb functional tests
Nine Hole Peg Test: The time taken to insert nine pegs into the same number of holes using one hand was measured. The best of three attempts was taken as the score for each individual.
Grip strength: With verbal encouragement from the experimenter, a dynamometer was used to measure grip strength of both hands. The best of three attempts for each hand was taken as the grip strength.
Action Research Arm Test: Participants were asked to manipulate various objects to test grasp, grip, pinch and gross arm function both with their affected and unaffected limb (Lang et al., 2006; Yozbatiran et al., 2008).
Cognitive function
Cognitive function was measured using the following tests.
Symbol Digit Modalities Test: The SDMT test, both coding and copy was administered as described in the Wechsler Adult Intelligence Scale III manual (Zhu et al., 2001).
Sustained Attention Index: This auditory attention test, a part of the Birmingham Cognitive Screen, was administered as described previously (Humphreys et al., 2012).
Self-reported measures
Fatigue scales
Two scales were used to capture self-reported fatigue: the Fatigue Severity Scale (FSS-7), which has been widely used and validated across different conditions (Johansson et al., 2014); and the Neurological Fatigue Index, a stroke specific scale (Mills et al., 2012). Both questionnaires were administered before the testing sessions.
Perception of effort
A numerical rating scale of 1–10, with 10 being maximal effort and 1 being minimal effort, was used to measure participants’ perception of effort while performing submaximal isometric contractions of the elbow flexor muscles in a custom built force device.
Motor cortex physiology
All neurophysiological tests were performed on the affected side upper limb muscles, the first dorsal interosseous or the elbow flexor group of muscles. Single and paired pulse paradigms were performed on the first dorsal interosseous and twitch interpolation technique was performed on the elbow flexor muscle group based on robustness of these protocols in the abovementioned muscle groups shown in previous work. As post-stroke fatigue is not muscle-specific, any differences in cortical control of muscles should not be muscle-specific.
Single and paired pulse paradigm experimental set-up
EMG recordings were obtained from the affected side first dorsal interosseous muscle with the participants seated in a chair and arms resting on a pillow on their lap. Following skin preparation using alcohol swabs, surface neonatal pre-wired disposable electrodes (1041PTS Neonatal Electrode, Kendell) were used in a belly-tendon montage to collect EMG signals from the muscle. A digitimer D360 amplifier was used to filter (10–1000 Hz) and amplify (×1000) the EMG signal before collecting it using Signal version 5.07 via the CED interface (Power 1401, CED Ltd.). A 90 mm figure of eight coil attached to a BiStim magnetic stimulator (Magstim) was used to stimulate the hand area of the motor cortex. The hotspot was localized and threshold was determined as follows: the vertex (cross-over point between the mid-point between the two tragi and midpoint between nasion and inion) was marked using a dry wipe marker. Four centimetres lateral and 2 cm anterior from the vertex was then marked on the contralateral hemisphere, which is the approximate location of M1. This was used as a rough guide for a starting point for determining the first dorsal interosseous hotspot. At 50% MSO (maximal stimulator output) (or higher or lower in some patients) the coil was moved in 1 cm blocks for ∼2 cm anterior, posterior, lateral and medial to the marked region. The subjects were instructed to relax, keep their eyes open and stay alert throughout the stimulation protocol. Three stimuli were delivered at each spot and the location with the highest average motor evoked potential response was taken as the hotspot. At rest, the intensity at which a response of at least 50 µV was obtained in 5 of 10 stimuli was taken as the resting motor threshold (RMT). Under active conditions (minimal pinch grip), the intensity at which a response of at least 200 µV was obtained in 5 of 10 stimuli was taken as the active motor threshold (AMT).
Short interval intracortical inhibition
A total of 80 stimuli, 20 single pulses and 60 paired pulses were delivered to test intracortical inhibition (ICI). The test pulse was set to evoke a 0.5–1 mV response and the conditioning pulses were set to one of three possible intensities (70%, 80% or 90% AMT). The interstimulus interval was either 2 or 3 ms. Equal numbers of pulses in each condition was delivered randomly at random intervals ranging from 5–6 s.
Long interval intracortical inhibition
A total of 20 stimuli were delivered randomly, 10 of which were single pulse and the other 10 were double pulse. An interstimulus interval of 100 ms and an intensity required to elicit a 1 mV response were used for both the test and conditioning pulse.
Stimulus-response curve
A total of 36 single pulse stimuli were delivered. The starting intensity was at RMT with increases of 10% after every six stimuli until a level of 150% RMT was reached (in some participants due to a high threshold it was possible to reach only up to 130% RMT).
Voluntary activation using modified twitch interpolation technique
The experimental set-up used for obtaining measures of voluntary activation was replicated from a previous study (Todd et al., 2003). Force and EMG measures were obtained from the affected elbow flexor group of muscles using the software Spike 2 version 6.15. EMG was obtained using surface EMG electrodes, the same as those used over first dorsal interosseous, in a belly tendon montage. Each participant was first asked to produce their maximum voluntary force in the isometric elbow flexion task by pulling as hard as they could on the bar. They were then provided visual feedback of their force and asked to produce 25% maximum voluntary force. While they maintained 25% maximum voluntary force, a circular coil was placed over the vertex and single pulses were delivered to produce a force twitch and motor evoked potentials were recorded on the EMG channel. The TMS intensity for the experiment was determined as follows: two pulses were delivered at any given TMS intensity. The TMS intensity was increased in 5% MSOs. The starting intensity was determined by the first dorsal interosseous threshold of the individual. For low threshold individuals (<40%) we started at 65% MSO and for those with high threshold (>40%) starting intensity was set at 75%. The average peak-to-peak motor evoked potential amplitudes were measured. The intensity at which the motor evoked potential amplitude saturated while the force level remained constant was taken as the TMS intensity for the rest of the experiment. Superimposed twitches were obtained at 25%, 50%, 75% and 100% maximal voluntary contraction (MVC) using a 90 mm circular coil placed over the vertex. Six repeats at each of the conditions were performed in a random order.
Analysis
Functional screening test scores
Action Research Arm Test, grip and Nine Hole Peg Test scores were normalized by expressing the affected limb score as a percentage of the unaffected limb. A principal component analysis was performed for the three scores across 70 subjects. The first principal component that accounted for 60.4% of variance was taken as the composite behavioural score for each subject. Symbol Digit Modalities Test was analysed by calculating the time taken to code one symbol and copy one symbol. The difference between the two was taken as the score for information processing speed. Sustained Attention Index was calculated by subtracting the number of erroneous responses in Block 3 from the number of erroneous responses in Block 1 of the auditory attention task.
Self-reported measures
Fatigue scales: An average of the FSS-7 scores and the sum of NFI-stroke scores was calculated.
Perception of effort: The Numerical Rating Scale scores were normalized by subtracting the expected score from the given score for each force level.
Motor cortex physiology
The motor evoked potential responses from each run (short interval ICI, long interval ICI and stimulus-response) were stored as a Signal data file for offline analysis. Each short interval ICI, long interval ICI and stimulus-response file had 80, 20 and 36 frames, respectively, each frame containing a single motor evoked potential response. The first frame/response of every file was discarded in the final analysis. It has been previously shown that the first response to a TMS pulse can be exaggerated (Schmidt et al., 2009), possibly reflecting some startle effect and therefore the first response was discarded. Of the remaining responses, 49/9310 responses were discarded from the data set comprising short interval ICI, long interval ICI and stimulus-response files of 70 participants because of either missing stimuli or background disturbance. Custom written script in Signal was used to obtain frame-by-frame amplitude of motor evoked potentials. All motor cortex neurophysiology tests were performed while the target muscle was totally relaxed with the exception of the measures of CAF and AMT. AMT was performed while the subject maintained minimal pinch which was ∼10% MVC. For CAF, participants produced forces of fixed levels relative to the individual’s maximum voluntary force using visual feedback.
Short interval ICI: The amplitudes of motor evoked potentials across each condition were averaged and expressed as a percentage of the test motor evoked potential size. The short interval ICI score was obtained by averaging across all six conditions.
Long interval ICI: Motor evoked potential responses to the second pulse were expressed as a percentage of the response to the first pulse and the control pulses taken together.
Stimulus-response curve: The amplitudes of motor evoked potentials were averaged across each of the six conditions, RMT, 1.1RMT, 1.2RMT, 1.3RMT, 1.4RMT and 1.5RMT. The slope of the measures up to 1.3 T was taken as stimulus-response slope score for each participant. The 1.4 T and 1.5 T responses were excluded because in those with high threshold, due to limitations of the machine, high intensity pulses could not be delivered.
CAF: Superimposed twitch size was calculated as the difference between background force (3 ms before delivery of TMS pulse) and the peak force obtained after the TMS pulse. The twitch sizes were calculated at 50%, 75% and 100% MVC. The estimated resting twitch (ERT) was taken as the y-intercept of force and twitch size. The twitch size obtained using 25% MVC was not used in calculating estimated resting twitch as it has been previously shown that at 25% MVC the twitch sizes does not proportionately increase with decreasing voluntary force as seen in changes of voluntary force from a 100 to 75 to 50. VAERT = 1−SIT/ERT × 100 at 100% MVC condition (average of six measures), where SIT = superimposed twitch. In several participants the expected correlation between force and twitch size was absent. Therefore an alternate formula 1 − SIT/BF × 100; where BF = background force was used to calculate voluntary activation (VABG). In those participants where it was possible to calculate voluntary activation measure using the estimated resting twitch and background force, we found that there was a systematic overestimation of voluntary activation when background force was used instead of estimated resting twitch. Both measures were highly correlated (Supplementary Fig. 1). In the final analysis the voluntary activation measure was calculated using background force for all participants to maintain consistency. Previously, in patient populations where the expected correlation between twitch size and force was absent, modified versions of the voluntary activation formula have been used (Chiou et al., 2014). A 100% voluntary activation would imply no deficit in central activation and therefore 0 CAF. The CAF measure was calculated by subtracting VABG from 100.
Statistical tests
Self-reported fatigue scores (FSS-7, NFI-stroke) and perceived effort score taken as the primary and secondary measures of fatigue are the two independent variables of interest in this study. Thresholds (resting and active), ICI (short and long interval), stimulus-response slopes and CAF are the six measures of cortical excitability in this study. As there was no a priori hypothesis regarding the weight of the contribution of each variable towards fatigue, two backward stepwise regression procedures were performed using Sigmaplot/Sigmastat (version 12.5), one with FSS-7 score (primary fatigue score) as the dependent variable and another with perceived effort (secondary fatigue score) as the dependent variable.
Selection of independent variables for multiple regression procedures
The two criteria for inclusion in a multiple regression procedure are that the variables are normally distributed and are independent of the other variables. Non-normally distributed data sets (long interval ICI and CAF) were log transformed. Based on these two criteria, RMT, long interval ICI and CAF were included as independent variables. An additional third multiple regression procedure was performed with RMT being replaced by AMT. AMT was not used in the original regression as RMT and AMT were highly correlated although they represent slightly different measures of excitability.
Post hoc t-tests were performed to determine the effect size between those with and without fatigue in both the primary and secondary measures of fatigue. Correlation analysis was performed between the measures of cortical excitability.
Results
Behavioural scores
The low level of impairment in this cohort of stroke survivors was reflected in all the motor and cognitive scores (Table 1 and Figs 2B and 3A).
Table 1.
Patient characteristics
| Gender |
Male |
Female |
||
|---|---|---|---|---|
| Affected side | Right | Left | Right | Left |
| n | 28 | 22 | 10 | 10 |
| Age (years ± SD) | 59.47 ± 12.25 | 65.51 ± 10.03 | 59.31 ± 14.11 | 52.59 ± 12.57 |
| Post-stroke (months) | 41.28 ± 45.35 | 83.63 ± 74.68 | 69.37 ± 78.2 | 28.72 ± 42.56 |
| NHPT (% unaffected) | 87.23 ± 31.71 | 79.3 ± 20.84 | 94.2 ± 28.74 | 66.49 ± 21.76 |
| Grip (% unaffected) | 90.26 ± 26.64 | 85.63 ± 8.92 | 102.68 ± 23.71 | 76.33 ± 18.34 |
| ARAT (% unaffected) | 97.56 ± 9.06 | 98.14 ± 3.47 | 99.47 ± 1.18 | 98.42 ± 4.99 |
| SDMT (mental speed) | 1.54 ± 0.78 | 1.6 ± 0.89 | 1.41 ± 0.63 | 1.397 ± 0.96 |
| SAI (attention) | 0.29 ± 1.27 | 0 ± 0.71 | 0.1 ± 1.52 | −0.1 ± 0.57 |
A total of 70 stroke survivors participated in the study. Participants were all high functioning with good physical strength (hand grip using dynamometer), dexterity (Nine Hole Peg Test) and functional ability (Action Research Arm Test) in their affected limbs when compared to their unaffected side. They were also cognitively high functioning as evidenced by a very high Sustained Attention Index and high information processing speed (Symbol Digit Modalities Test: coding-copy). All patients had a score of ≤11 on the Hospital and Anxiety Depression Scale.
ARAT = Action Research Arm Test; NHPT = Nine Hole Peg Test; SAI= Sustained Attention Index; SDMT = Symbol Digit Modalities Test.
Figure 2.

Patient demographics. (A) Stroke survivors of wide-ranging ages participated in the study. (B) All participants had good cognitive ability as shown by a relatively high information processing speed (IPS), an average of 1 s per symbol in the Symbol Digit Modalities Test (Coding – Copy) and Sustained Attention Index (SAI). Zero indicates very high attention score and positive scores show progressively poorer attention. Self-reported fatigue was quantified using two questionnaires, FSS (C) and Neurological Fatigue Index – Stroke specific scale (NFI-Stroke, D). The fatigue levels in the current study population included those with both high and low levels of fatigue. (E) FSS and NFI-stroke were significantly correlated.
Figure 3.

Behavioural scores. (A) The behavioural scores of the affected upper limb as a percentage of the unaffected side, motor thresholds (F) and CAF (B) in 70 subjects. (C) The black bar represents the test response as a percentage of itself and the box plot is the mean conditioned motor evoked potential (MEP) response sizes in the long interval ICI protocol. In (D) average raw motor evoked potential sizes at various percentages of threshold (x-axis values, T to 1.5 T) are represented by the filled circles. The error bars represent standard errors. In (E), the black bar represents the test response as a percentage of itself, the white bars show responses where interstimulus interval was 2 ms, grey where interstimulus interval was 3 ms and the intensities on the x-axis are the intensities of conditioning pulses. The error bars represent standard error. The box plot in (E) shows the average short interval ICI across all six conditions. In C and E all conditioned responses were significantly smaller than test response (black bar), P < 0.05. The box plots (all grey boxes with horizontal line inside them) show the distribution of the data points with the horizontal line representing the median of the data and the black dots representing the outliers. NHPT = Nine Hole Peg Test; ARAT = Action Research Arm Test; SIT = superimposed twitch; BF = background force; MSO = maximal stimulator output.
Corticospinal excitability
The average resting and active thresholds in the cohort were 53.1% MSO ± 1.6 and 48.8% MSO ± 1.5 (Fig. 3F). The two measures were highly correlated (Pearson Product Moment Correlation, CC = 0.931, P < 0.001).
Short interval intracortical inhibition
The conditioning stimulus attenuated the size of motor evoked potential (Fig. 3E). A Friedman repeated measures ANOVA on ranks revealed a significant reduction in amplitude of the conditioned motor evoked potential when compared to the test motor evoked potential at all intensities of conditioning stimulation and at both interstimulus intervals (2 and 3 ms), [χ2(6,70) = 57.334, P < 0.001]. Each of the six conditions was significantly different from the test condition (P < 0.05; Tukey paired test) (Fig. 3E).
Long interval intracortical inhibition
The conditioned motor evoked potential was significantly smaller than the test motor evoked potential (Wilcoxon signed ranks test, Z = −5.176, P < 0.001) (Fig. 3D).
Central activation failure
Levels of CAF in this cohort were low (0.66 ± 0.04) (Fig. 3B). The motor evoked potential responses in the biceps muscle was stable in size across the various levels of voluntary effort (Fig. 7), with a tendency for them to be smaller and slightly narrower during MVC, as reported previously (Todd et al., 2003).
Figure 7.
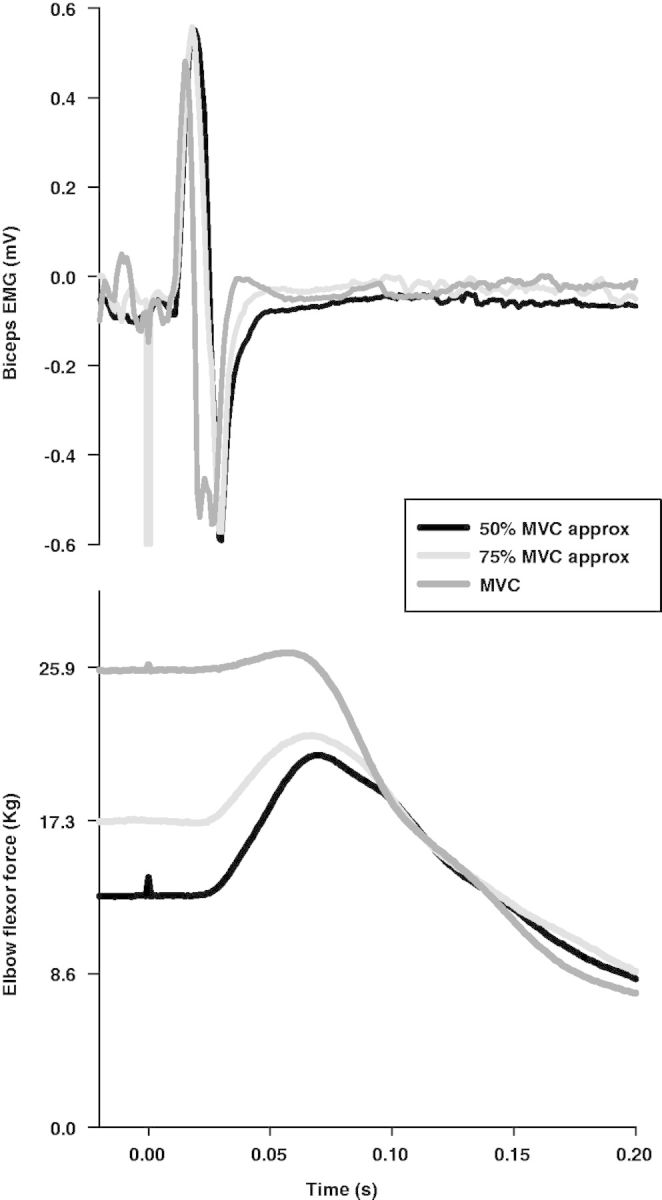
Example traces from the Central Activation Failure test. Single motor evoked potential (top) and twitch (bottom) responses from an individual subject show a decrease in the size of twitch with increasing voluntary force while the motor evoked potential sizes remain the same.
Stimulus-response curve
Motor evoked potentials increased in amplitude with increasing intensities of TMS (Fig. 2F). Stimulus-response curves were correlated with both RMT (Spearman rank order correlation, CC = −0.399, P = 0.017, Fig. 4B) and CAF (Spearman rank order correlation, CC = −0.297, P = 0.036, Fig. 4A).
Figure 4.
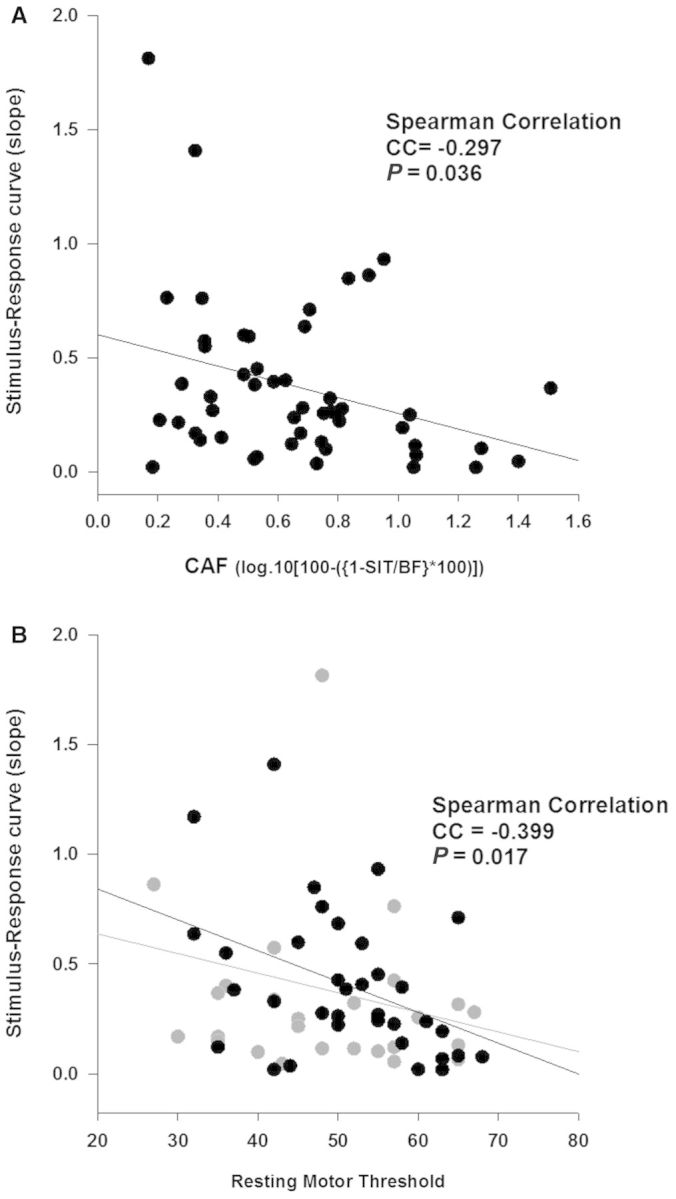
M1 excitability and central activation failure. Intracortical M1 excitability as measured by stimulus-response curve was correlated with corticospinal excitability (B, RMT, n = 70) and excitability of inputs to M1 as measured by CAF (A, n = 55). The grey circles in B represent thresholds of those participants (n = 30) who were unable to completely relax their muscle during measurement and thereby might have been an underestimation of RMT. Two data points in (A) and three data points in (B), have been excluded from graphical representation but have been included in statistical analysis. SIT = superimposed twitch; BF = background force.
Fatigue scores
FSS-7 ranged from 1 to 7, 3.61 ± 0.22 (mean ± SE) (Supplementary Fig. 1C) and NFI-stroke ranged from 0 to 30, 15.51 ± 1 (Fig. 2D). FSS-7 and NFI-stroke had a high correlation (Pearson Product Moment Correlation, CC = 0.847, P < 0.001, Fig. 2E) and therefore from all further analysis was done with FSS-7 as the primary fatigue score.
Backward regression analysis
The dependent variables included in the regression for FSS-7 were RMT, long interval ICI and CAF. Of the three measures of cortical excitability, RMT (R = 0.384; 95% CI = 0.071; P = 0.036, Fig. 5A) accounted for 14.7% of the variation in FSS-7 (R2) but there was no significant contribution from the other two measures. A further two-tailed t-test between those with very high (≥5, n = 18) and very low (≤2, n = 18) FSS-7 score revealed a mean difference in RMT of 12.2% (Fig. 5B). When the regression was performed with AMT and not RMT, similar results were obtained with a marginally higher R2.
Figure 5.
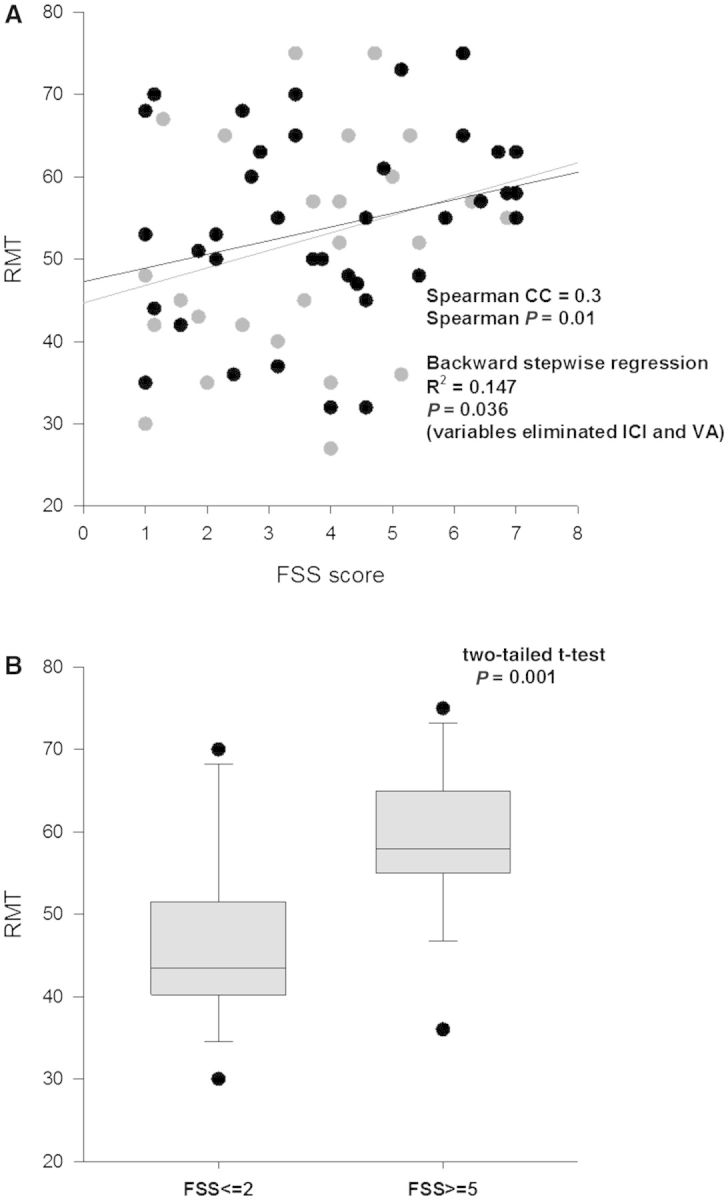
Corticospinal tract excitability and FSS score. RMT was correlated with FSS. In (A) the grey circles represent resting threshold of all participants (n = 70). In 40 of 70 participants, a true resting state was achieved during threshold measurement (black circles), the remaining 30 patients were unable to relax completely and there may have been a slight underestimation of resting threshold. In (B) the difference between resting thresholds in those with no fatigue (FSS score <2, n = 18) and those with extreme fatigue (FSS score >5, n = 18) is shown.
The dependent variables included in the regression for perceived effort were stimulus-response slope, long interval ICI and CAF. Of the three measures of cortical excitability, CAF (R = 0.416; 95% CI = −1.618; P = 0.003, Fig. 6B) accounted for 17.3% of the variation in perceived effort (R2) with no significant contribution from the other two measures. A further two-tailed t-test between those who overestimated effort (n = 28) and underestimated effort (n = 24) revealed a mean difference in CAF of 0.18 (Fig. 6A).
Figure 6.
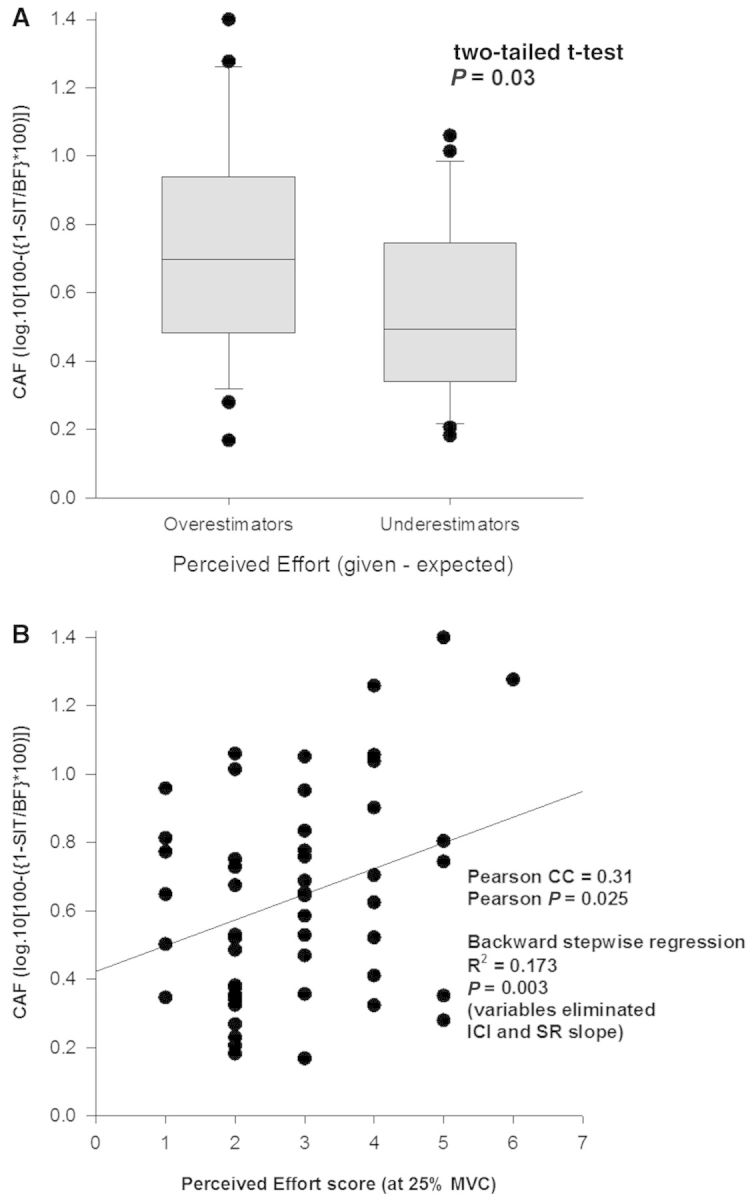
Perceived effort and CAF. Participants self-reported effort score while performing a 25% MVC, on a scale of 0–10 correlated with the level of ‘extra-M1’ excitability as measured by CAF (B). A significant difference in CAF (s) was seen in those who overestimated the effort required to produce a 25% MVC (≥3) and those who underestimated the required effort (≤2). Fifty-five of 70 participants were able to tolerate the CAF testing. SIT = superimposed twitch; BF = background force.
Discussion
The main finding of this study is that in minimally impaired stroke survivors with high levels of fatigue, it is harder to elicit a response to TMS than in those with low levels of fatigue. In other words, high fatigue is related to high TMS threshold. One factor that contributes to high threshold is low corticospinal excitability and we argue below that this may be one of the mechanistic links with high fatigue. The second significant finding is that CAF, a measure of inability to drive M1 maximally, is significantly smaller in those with low ‘perception of effort’, a secondary measure of fatigue, i.e. those who perceive a task to be more effortful exhibit more CAF. The relatively modest R2 values for both significant findings are likely to be a reflection of the multi-dimensional nature of fatigue and the scales used to capture fatigue. A significant negative finding was that fatigue was not correlated with measures of synaptically mediated GABAergic inhibition.
Only a modest amount (15–17%) of variance in the fatigue levels captured by the FSS-7 score is explained by the neurophysiological measures investigated in this study. However, it should be recalled that some statements in the fatigue scale FSS-7 assess the impact of fatigue on daily activities. This is highly dependent on the nature of activities an individual wishes to undertake, which are unlikely to relate to neurophysiological factors. Thus we would never expect a physiological measure to account for more than a proportion of the variance in FSS-7 scores. In addition, we acknowledge that other components of the sensory-motor system may also contribute to fatigue. For example, afferent inputs excited by muscle activity can influence motor pathways at many levels of the CNS. It is possible that differences in these inputs, or in the access of the inputs to motor outputs, is affected in post-stroke fatigue and contributes to reduced volitional drive in the twitch interpolation task. Although, we believe this could not account for the primary finding of this study, a correlation between RMT and FSS-7 as RMT is measured during complete rest. Other contributors to fatigue may include higher level executive components. Nonetheless, the fact that a reasonable amount of variance in the FSS-7 scores is explained by two simple neurophysiological measures is a valuable insight into the possible sources of fatigue in stroke.
Corticospinal excitability assessed by TMS thresholds is highly variable in the general population (Wassermann, 2002). Structural factors such as coil to cortical surface distance (Stokes et al., 2007), white matter microstructure (Hübers et al., 2012), cortical thickness (List et al., 2013) and hand dominance (Triggs et al., 1994, 1999) all contribute to the variability in thresholds. Physiological factors also contribute, the main ones being the excitability of axon membranes that are the sites where TMS activates neurons as well as synaptic excitability, which causes discharge of corticospinal neurons. Single dose drug studies targeted at blocking ion channels or synaptic neurotransmitter receptors, significantly alter thresholds (Boroojerdi et al., 2001; Di Lazzaro et al., 2003; Reis et al., 2004; Ziemann, 2004). In this study we show that self-reported fatigue score correlates positively with TMS thresholds: participants with high fatigue scores had high thresholds. Although we have no direct evidence, it is difficult to envisage how variations in anatomical and structural factors might be causally linked to changes in fatigue. Our hypothesis is therefore that physiological differences in neural excitability, perhaps specifically excitability of inputs that drive motor cortex output, may influence measures of fatigue. It could therefore be that fatigue is perceived when the volitional input to motor cortex produces less than expected output because of reduced excitability. It should be noted that RMTs can reflect excitability of both cortical M1 neurons and spinal motor neurons (Rothwell et al., 1991) and any correlation with fatigue might be of cortical or spinal origin. AMT on the other hand is thought to be predominantly a reflection of cortical M1 neuron excitability (Rothwell et al., 1991). As highly correlated variables, only RMT was used in the original regression but a further regression analysis where AMT replaced RMT also showed similar results with AMT being the only variable that explained some of the variance in fatigue scores.
Neither short nor long interval intracortical inhibition, which are due to activity in GABAergic inhibitory connections, were correlated with measures of fatigue suggesting that fatigue is not due to some form of over-activity in inhibitory circuits. Instead, the correlation with RMT and AMT suggests that it involves an excitatory effect, perhaps modulated abnormally by other neurotransmitter systems. Excitatory and inhibitory systems that drive motor function are independently regulated and a recent fatigue model in neurological diseases suggested that suppression of the excitatory system and not over-activity of the inhibitory system may lead to the development of fatigue (Tanaka and Watanabe, 2012). Our results support this theory in the stroke population.
In this study, reduced motor cortical excitability was seen not only in those with high fatigue but also in those with high CAF i.e. when the inputs to motor cortex fail to produce maximal output. This result further supports our hypothesis that fatigue may be perceived when the volitional input to motor cortex produces less than the expected output. To better understand the origin of volitional input to motor cortex, one must look into the anatomical and functional connectivity of motor cortex. The motor cortex has strong anatomical connections with other cortical and subcortical regions such as the pre-motor cortices, supplementary motor areas, cingulate motor areas, basal ganglia and the cerebellum (Strick et al., 1998; Wichmann and DeLong, 1998; Dum and Strick, 2002) all of which can modulate motor cortex excitability (Chen et al., 2001; Gerschlager et al., 2001; Kühn et al., 2003; Boros et al., 2008; Kirimoto et al., 2011; Lee et al., 2013). Further studies are required to establish if reduced activity in one or more of the functionally active inputs to the motor cortex is responsible for the less than expected output from the motor cortex. Alternatively, less than expected output could equally be due to non-responsiveness to the received inputs by the motor cortex as reflected in the high motor cortex thresholds in those with fatigue.
We also show that those with high CAF perceive a given task to be more effortful than those with low CAF. The sense of effort is thought not to arise from the sensory afferents active during a muscle contraction (Carson et al., 2002; Lafargue et al., 2003; Weerakkody et al., 2003) but arises centrally possibly from those elements that drive motor output (Carson et al., 2002; Lafargue and Franck, 2009). Our results support this idea. The results are also in accordance with reports that patients with fatigue perceive activities to be more effortful than before stroke (Flinn and Stube, 2010; Barbour and Mead, 2012; Young et al., 2013). One could argue that everyday activities do not require maximal force levels and what we show in this study is a difference CAF that is only measured at maximal force levels. Although CAF is only measureable during maximal force production, it may also be present during minimal force production. We propose that at lower force levels, the applied effort does not give rise to the expected force due to the presence of CAF resulting in low force level activities being perceived as more effortful. Despite sense of effort contributing to the feeling of fatigue, we did not find any direct relationship between fatigue scores and perceived effort.
To summarize, it appears that the overall excitability of cortical motor pathways, both the motor outputs and the inputs that drive motor output, are diminished in those with post-stroke fatigue. Neuronal excitability is partly dependent on spontaneous neuronal firing rates. Reduced neuronal firing rates seen immediately after stroke will therefore reduce the excitability of those neurons (Altwegg-Boussac et al., 2014). We propose that fatigue after stroke results from reduced homeostatic rebalancing of spontaneous neuronal firing rates in the period after stroke, leading to the lowered corticomotor excitability that we have demonstrated.
Acknowledgements
We would like to thank Mr Paul Hammond for the technical support he provided for this project.
Glossary
- AMT
active motor threshold
- CAF
central activation failure
- FFS
Fatigue Severity Scale
- ICI
intracortical inhibition
- MVC
maximal voluntary contraction
- RMT
resting motor threshold
- TMS
transcranial magnetic stimulation
Funding
Dr Annapoorna Kuppuswamy is funded by the Stroke Association under the Senior Research Training Fellowship scheme.
Supplementary material
Supplementary material is available at Brain online.
References
- Altwegg-Boussac T, Chavez M, Mahon S, Charpier S. Excitability and responsiveness of rat barrel cortex neurons in the presence and absence of spontaneous synaptic activity in vivo. J Physiol. 2014;592:3577–95. doi: 10.1113/jphysiol.2013.270561. [DOI] [PMC free article] [PubMed] [Google Scholar]
- Andersen G, Christensen D, Kirkevold M, Johnsen SP. Post-stroke fatigue and return to work: a 2-year follow-up. Acta Neurol Scand. 2012;125:248–53. doi: 10.1111/j.1600-0404.2011.01557.x. [DOI] [PubMed] [Google Scholar]
- Annoni J-M, Staub F, Bogousslavsky J, Brioschi A. Frequency, characterisation and therapies of fatigue after stroke. Neurol Sci. 2008;29(Suppl 2):S244–6. doi: 10.1007/s10072-008-0951-0. [DOI] [PubMed] [Google Scholar]
- Barbour VL, Mead GE. Fatigue after stroke: the patient’s perspective. Stroke Res Treat. 2012;2012:863031. doi: 10.1155/2012/863031. [DOI] [PMC free article] [PubMed] [Google Scholar]
- Boroojerdi B, Battaglia F, Muellbacher W, Cohen LG. Mechanisms influencing stimulus-response properties of the human corticospinal system. Clin Neurophysiol. 2001;112:931–7. doi: 10.1016/s1388-2457(01)00523-5. [DOI] [PubMed] [Google Scholar]
- Boros K, Poreisz C, Münchau A, Paulus W, Nitsche MA. Premotor transcranial direct current stimulation (tDCS) affects primary motor excitability in humans. Eur J Neurosci. 2008;27:1292–300. doi: 10.1111/j.1460-9568.2008.06090.x. [DOI] [PubMed] [Google Scholar]
- Brioschi A, Gramigna S, Werth E, Staub F, Ruffieux C, Bassetti C, et al. Effect of modafinil on subjective fatigue in multiple sclerosis and stroke patients. Eur Neurol. 2009;62:243–9. doi: 10.1159/000232927. [DOI] [PubMed] [Google Scholar]
- Carson RG, Riek S, Shahbazpour N. Central and peripheral mediation of human force sensation following eccentric or concentric contractions. J Physiol. 2002;539:913–25. doi: 10.1113/jphysiol.2001.013385. [DOI] [PMC free article] [PubMed] [Google Scholar]
- Chaudhuri A, Behan PO. Fatigue in neurological disorders. Lancet. 2004;363:978–88. doi: 10.1016/S0140-6736(04)15794-2. [DOI] [PubMed] [Google Scholar]
- Chen R, Garg RR, Lozano AM, Lang AE. Effects of internal globus pallidus stimulation on motor cortex excitability. Neurology. 2001;56:716–23. doi: 10.1212/wnl.56.6.716. [DOI] [PubMed] [Google Scholar]
- Chiou SY, Shih YF, Chou LW, McGregor AH, Strutton PH. Impaired neural drive in patients with low back pain. Eur J Pain Lond Engl. 2014;18:794–802. doi: 10.1002/j.1532-2149.2013.00428.x. [DOI] [PubMed] [Google Scholar]
- Choi-Kwon S, Choi J, Kwon SU, Kang D-W, Kim JS. Fluoxetine is not effective in the treatment of post-stroke fatigue: a double-blind, placebo-controlled study. Cerebrovasc Dis. 2007;23:103–8. doi: 10.1159/000097045. [DOI] [PubMed] [Google Scholar]
- Christensen D, Johnsen SP, Watt T, Harder I, Kirkevold M, Andersen G. Dimensions of post-stroke fatigue: a two-year follow-up study. Cerebrovasc Dis. 2008;26:134–41. doi: 10.1159/000139660. [DOI] [PubMed] [Google Scholar]
- Dum RP, Strick PL. Motor areas in the frontal lobe of the primate. Physiol Behav. 2002;77:677–82. doi: 10.1016/s0031-9384(02)00929-0. [DOI] [PubMed] [Google Scholar]
- Van Eijsden HM, van de Port IGL, Visser-Meily JMA, Kwakkel G. Poststroke fatigue: who is at risk for an increase in fatigue? Stroke Res Treat. 2012;2012:863978. doi: 10.1155/2012/863978. [DOI] [PMC free article] [PubMed] [Google Scholar]
- Eilertsen G, Ormstad H, Kirkevold M. Experiences of poststroke fatigue: qualitative meta-synthesis. J Adv Nurs. 2013;69:514–25. doi: 10.1111/jan.12002. [DOI] [PubMed] [Google Scholar]
- Eldaief MC, Press DZ, Pascual-Leone A. Transcranial magnetic stimulation in neurology: a review of established and prospective applications. Neurol Clin Pract. 2013;3:519–26. doi: 10.1212/01.CPJ.0000436213.11132.8e. [DOI] [PMC free article] [PubMed] [Google Scholar]
- Flinn NA, Stube JE. Post-stroke fatigue: qualitative study of three focus groups. Occup Ther Int. 2010;17:81–91. doi: 10.1002/oti.286. [DOI] [PubMed] [Google Scholar]
- Friedman JH, Friedman H. Fatigue in Parkinson’s disease: a nine-year follow-up. Mov Disord. 2001;16:1120–2. doi: 10.1002/mds.1201. [DOI] [PubMed] [Google Scholar]
- Gerschlager W, Siebner HR, Rothwell JC. Decreased corticospinal excitability after subthreshold 1 Hz rTMS over lateral premotor cortex. Neurology. 2001;57:449–55. doi: 10.1212/wnl.57.3.449. [DOI] [PubMed] [Google Scholar]
- Ghajarzadeh M, Jalilian R, Eskandari G, Sahraian MA, Azimi A, Mohammadifar M. Fatigue in multiple sclerosis: relationship with disease duration, physical disability, disease pattern, age and sex. Acta Neurol Belg. 2013;113:411–14. doi: 10.1007/s13760-013-0198-2. [DOI] [PubMed] [Google Scholar]
- De Groot MH, Phillips SJ, Eskes GA. Fatigue associated with stroke and other neurologic conditions: implications for stroke rehabilitation. Arch Phys Med Rehabil. 2003;84:1714–20. doi: 10.1053/s0003-9993(03)00346-0. [DOI] [PubMed] [Google Scholar]
- Hildebrandt H, Eling P. A longitudinal study on fatigue, depression, and their relation to neurocognition in multiple sclerosis. J Clin Exp Neuropsychol. 2014;36:410–7. doi: 10.1080/13803395.2014.903900. [DOI] [PubMed] [Google Scholar]
- Hübers A, Klein JC, Kang J-S, Hilker R, Ziemann U. The relationship between TMS measures of functional properties and DTI measures of microstructure of the corticospinal tract. Brain Stimul. 2012;5:297–304. doi: 10.1016/j.brs.2011.03.008. [DOI] [PubMed] [Google Scholar]
- Humphreys GW, Bickerton W, Samson D, Riddoch MJ. London: Psychology Press; 2012. BCoS Cognitive Screen. [Google Scholar]
- Ingles JL, Eskes GA, Phillips SJ. Fatigue after stroke. Arch Phys Med Rehabil. 1999;80:173–8. doi: 10.1016/s0003-9993(99)90116-8. [DOI] [PubMed] [Google Scholar]
- Johansson S, Kottorp A, Lee KA, Gay CL, Lerdal A. Can the Fatigue Severity Scale 7-item version be used across different patient populations as a generic fatigue measure–a comparative study using a Rasch model approach. Health Qual Life Outcomes. 2014;12:24. doi: 10.1186/1477-7525-12-24. [DOI] [PMC free article] [PubMed] [Google Scholar]
- Karaiskos D, Tzavellas E, Spengos K, Vassilopoulou S, Paparrigopoulos T. Duloxetine versus citalopram and sertraline in the treatment of poststroke depression, anxiety, and fatigue. J Neuropsychiatry Clin Neurosci. 2012;24:349–53. doi: 10.1176/appi.neuropsych.11110325. [DOI] [PubMed] [Google Scholar]
- Kirimoto H, Ogata K, Onishi H, Oyama M, Goto Y, Tobimatsu S. Transcranial direct current stimulation over the motor association cortex induces plastic changes in ipsilateral primary motor and somatosensory cortices. Clin Neurophysiol. 2011;122:777–83. doi: 10.1016/j.clinph.2010.09.025. [DOI] [PubMed] [Google Scholar]
- Kluger BM, Krupp LB, Enoka RM. Fatigue and fatigability in neurologic illnesses: proposal for a unified taxonomy. Neurology. 2013;80:409–16. doi: 10.1212/WNL.0b013e31827f07be. [DOI] [PMC free article] [PubMed] [Google Scholar]
- Knorr S, Ivanova TD, Doherty TJ, Campbell JA, Garland SJ. The origins of neuromuscular fatigue post-stroke. Exp Brain Res. 2011;214:303–15. doi: 10.1007/s00221-011-2826-5. [DOI] [PubMed] [Google Scholar]
- Kühn AA, Meyer B-U, Trottenberg T, Brandt SA, Schneider GH, Kupsch A. Modulation of motor cortex excitability by pallidal stimulation in patients with severe dystonia. Neurology. 2003;60:768–74. doi: 10.1212/01.wnl.0000044396.64752.4c. [DOI] [PubMed] [Google Scholar]
- Kujirai T, Caramia MD, Rothwell JC, Day BL, Thompson PD, Ferbert A, et al. Corticocortical inhibition in human motor cortex. J Physiol. 1993;471:501–19. doi: 10.1113/jphysiol.1993.sp019912. [DOI] [PMC free article] [PubMed] [Google Scholar]
- Kutlubaev MA, Mead GE. One step closer to understanding poststroke fatigue. Neurology. 2012;79:1414–15. doi: 10.1212/WNL.0b013e31826d604e. [DOI] [PubMed] [Google Scholar]
- Lafargue G, Franck N. Effort awareness and sense of volition in schizophrenia. Conscious Cogn. 2009;18:277–89. doi: 10.1016/j.concog.2008.05.004. [DOI] [PubMed] [Google Scholar]
- Lafargue G, Paillard J, Lamarre Y, Sirigu A. Production and perception of grip force without proprioception: is there a sense of effort in deafferented subjects? Eur J Neurosci. 2003;17:2741–9. doi: 10.1046/j.1460-9568.2003.02700.x. [DOI] [PubMed] [Google Scholar]
- Lang CE, Wagner JM, Dromerick AW, Edwards DF. Measurement of upper-extremity function early after stroke: properties of the action research arm test. Arch Phys Med Rehabil. 2006;87:1605–10. doi: 10.1016/j.apmr.2006.09.003. [DOI] [PubMed] [Google Scholar]
- Di Lazzaro V, Oliviero A, Profice P, Pennisi MA, Pilato F, Zito G, et al. Ketamine increases human motor cortex excitability to transcranial magnetic stimulation. J Physiol. 2003;547:485–96. doi: 10.1113/jphysiol.2002.030486. [DOI] [PMC free article] [PubMed] [Google Scholar]
- Lee M, Kim SE, Kim WS, Han J, Kim H-J, Kim HJ, et al. Cortico-cortical modulation induced by 1-Hz repetitive transcranial magnetic stimulation of the temporal cortex. J Clin Neurol. 2013;9:75–82. doi: 10.3988/jcn.2013.9.2.75. [DOI] [PMC free article] [PubMed] [Google Scholar]
- Liepert J, Mingers D, Heesen C, Bäumer T, Weiller C. Motor cortex excitability and fatigue in multiple sclerosis: a transcranial magnetic stimulation study. Mult Scler. 2005;11:316–21. doi: 10.1191/1352458505ms1163oa. [DOI] [PubMed] [Google Scholar]
- List J, Kübke JC, Lindenberg R, Külzow N, Kerti L, Witte V, et al. Relationship between excitability, plasticity and thickness of the motor cortex in older adults. Neuroimage. 2013;83:809–16. doi: 10.1016/j.neuroimage.2013.07.033. [DOI] [PubMed] [Google Scholar]
- Mills RJ, Pallant JF, Koufali M, Sharma A, Day S, Tennant A, et al. Validation of the Neurological Fatigue Index for stroke (NFI-Stroke) Health Qual Life Outcomes. 2012;10:51. doi: 10.1186/1477-7525-10-51. [DOI] [PMC free article] [PubMed] [Google Scholar]
- Morgante F, Dattola V, Crupi D, Russo M, Rizzo V, Ghilardi MF, et al. Is central fatigue in multiple sclerosis a disorder of movement preparation? J. Neurol. 2011;258:263–72. doi: 10.1007/s00415-010-5742-x. [DOI] [PubMed] [Google Scholar]
- Naess H, Lunde L, Brogger J, Waje-Andreassen U. Fatigue among stroke patients on long-term follow-up. The Bergen Stroke Study. J Neurol Sci. 2012;312:138–41. doi: 10.1016/j.jns.2011.08.002. [DOI] [PubMed] [Google Scholar]
- Reis J, Wentrup A, Hamer HM, Mueller H-H, Knake S, Tergau F, et al. Levetiracetam influences human motor cortex excitability mainly by modulation of ion channel function–a TMS study. Epilepsy Res. 2004;62:41–51. doi: 10.1016/j.eplepsyres.2004.08.001. [DOI] [PubMed] [Google Scholar]
- Rothwell JC, Thompson PD, Day BL, Boyd S, Marsden CD. Stimulation of the human motor cortex through the scalp. Exp Physiol. 1991;76:159–200. doi: 10.1113/expphysiol.1991.sp003485. [DOI] [PubMed] [Google Scholar]
- Schepers VP, Visser-Meily AM, Ketelaar M, Lindeman E. Poststroke fatigue: course and its relation to personal and stroke-related factors. Arch Phys Med Rehabil. 2006;87:184–8. doi: 10.1016/j.apmr.2005.10.005. [DOI] [PubMed] [Google Scholar]
- Schmidt S, Cichy RM, Kraft A, Brocke J, Irlbacher K, Brandt SA. An initial transient-state and reliable measures of corticospinal excitability in TMS studies. Clin Neurophysiol Neurophysiol. 2009;120:987–93. doi: 10.1016/j.clinph.2009.02.164. [DOI] [PubMed] [Google Scholar]
- Snaphaan L, van der Werf S, de Leeuw F-E. Time course and risk factors of post-stroke fatigue: a prospective cohort study. Eur J Neurol. 2011;18:611–17. doi: 10.1111/j.1468-1331.2010.03217.x. [DOI] [PubMed] [Google Scholar]
- Staub F, Bogousslavsky J. Fatigue after stroke: a major but neglected issue. Cerebrovasc Dis. 2001;12:75–81. doi: 10.1159/000047685. [DOI] [PubMed] [Google Scholar]
- Stokes MG, Chambers CD, Gould IC, English T, McNaught E, McDonald O, et al. Distance-adjusted motor threshold for transcranial magnetic stimulation. Clin Neurophysiol. 2007;118:1617–25. doi: 10.1016/j.clinph.2007.04.004. [DOI] [PubMed] [Google Scholar]
- Storch A, Schneider CB, Wolz M, Stürwald Y, Nebe A, Odin P, et al. Nonmotor fluctuations in Parkinson disease: severity and correlation with motor complications. Neurology. 2013;80:800–9. doi: 10.1212/WNL.0b013e318285c0ed. [DOI] [PubMed] [Google Scholar]
- Strick PL, Dum RP, Picard N. Motor areas on the medial wall of the hemisphere. Novartis Found Symp. 1998;218:64–75. doi: 10.1002/9780470515563.ch5. [DOI] [PubMed] [Google Scholar]
- Tanaka M, Watanabe Y. Supraspinal regulation of physical fatigue. Neurosci Biobehav Rev. 2012;36:727–34. doi: 10.1016/j.neubiorev.2011.10.004. [DOI] [PubMed] [Google Scholar]
- Taylor JL, Todd G, Gandevia SC. Evidence for a supraspinal contribution to human muscle fatigue. Clin Exp Pharmacol Physiol. 2006;33:400–5. doi: 10.1111/j.1440-1681.2006.04363.x. [DOI] [PubMed] [Google Scholar]
- Todd G, Taylor JL, Gandevia SC. Measurement of voluntary activation of fresh and fatigued human muscles using transcranial magnetic stimulation. J Physiol. 2003;551:661–71. doi: 10.1113/jphysiol.2003.044099. [DOI] [PMC free article] [PubMed] [Google Scholar]
- Triggs WJ, Calvanio R, Macdonell RA, Cros D, Chiappa KH. Physiological motor asymmetry in human handedness: evidence from transcranial magnetic stimulation. Brain Res. 1994;636:270–6. doi: 10.1016/0006-8993(94)91026-x. [DOI] [PubMed] [Google Scholar]
- Triggs WJ, Subramanium B, Rossi F. Hand preference and transcranial magnetic stimulation asymmetry of cortical motor representation. Brain Res. 1999;835:324–9. doi: 10.1016/s0006-8993(99)01629-7. [DOI] [PubMed] [Google Scholar]
- Tseng BY, Billinger SA, Gajewski BJ, Kluding PM. Exertion fatigue and chronic fatigue are two distinct constructs in people post-stroke. Stroke J Cereb Circ. 2010;41:2908–12. doi: 10.1161/STROKEAHA.110.596064. [DOI] [PMC free article] [PubMed] [Google Scholar]
- Wassermann EM. Variation in the response to transcranial magnetic brain stimulation in the general population. Clin Neurophysiol. 2002;113:1165–71. doi: 10.1016/s1388-2457(02)00144-x. [DOI] [PubMed] [Google Scholar]
- Weerakkody N, Percival P, Morgan DL, Gregory JE, Proske U. Matching different levels of isometric torque in elbow flexor muscles after eccentric exercise. Exp Brain Res. 2003;149:141–50. doi: 10.1007/s00221-002-1341-0. [DOI] [PubMed] [Google Scholar]
- Wichmann T, DeLong MR. Models of basal ganglia function and pathophysiology of movement disorders. Neurosurg Clin N Am. 1998;9:223–36. [PubMed] [Google Scholar]
- Winward C, Sackley C, Metha Z, Rothwell PM. A population-based study of the prevalence of fatigue after transient ischemic attack and minor stroke. Stroke J Cereb Circ. 2009;40:757–61. doi: 10.1161/STROKEAHA.108.527101. [DOI] [PubMed] [Google Scholar]
- Young CA, Mills RJ, Gibbons C, Thornton EW. Poststroke fatigue: the patient perspective. Top Stroke Rehabil. 2013;20:478–84. doi: 10.1310/tsr2006-478. [DOI] [PubMed] [Google Scholar]
- Yozbatiran N, Der-Yeghiaian L, Cramer SC. A standardized approach to performing the action research arm test. Neurorehabil Neural Repair. 2008;22:78–90. doi: 10.1177/1545968307305353. [DOI] [PubMed] [Google Scholar]
- Van Zandvoort MJ, Kappelle LJ, Algra A, De Haan EH. Decreased capacity for mental effort after single supratentorial lacunar infarct may affect performance in everyday life. J Neurol Neurosurg Psychiatry. 1998;65:697–702. doi: 10.1136/jnnp.65.5.697. [DOI] [PMC free article] [PubMed] [Google Scholar]
- Zhu J, Tulsky DS, Price L, Chen HY. WAIS-III reliability data for clinical groups. J Int Neuropsychol Soc. 2001;7:862–6. [PubMed] [Google Scholar]
- Ziemann U. TMS and drugs. Clin Neurophysiol. 2004;115:1717–29. doi: 10.1016/j.clinph.2004.03.006. [DOI] [PubMed] [Google Scholar]