Abstract
Finite element analysis (FEA) is an advanced computer technique of structural stress analysis developed in engineering mechanics. Because the compressive behavior of vertebral bone shows nonlinear behavior, a nonlinear FEA should be utilized to analyze the clinical vertebral fracture. In this article, a computed tomography-based nonlinear FEA (CT/FEA) to analyze the vertebral bone strength, fracture pattern, and fracture location is introduced. The accuracy of the CT/FEA was validated by performing experimental mechanical testing with human cadaveric specimens. Vertebral bone strength and the minimum principal strain at the vertebral surface were accurately analyzed using the CT/FEA. The experimental fracture pattern and fracture location were also accurately simulated. Optimization of the element size was performed by assessing the accuracy of the CT/FEA, and the optimum element size was assumed to be 2 mm. It is expected that the CT/FEA will be valuable in analyzing vertebral fracture risk and assessing therapeutic effects on osteoporosis.
Keywords: vertebral fracture, bone strength, finite element analysis, osteoporosis
One of the major diseases of the aging spine is vertebral compression fracture related to osteoporosis. Osteoporosis is progressive with age, especially in postmenopausal women. To assess the vertebral compression fracture and to prevent fractures, it is essential to analyze and predict vertebral fracture. Finite element method (FEM) is a numerical technique for finding approximate solutions to boundary value problems. It uses variational methods to minimize an error function and produce a stable solution. A typical work out of the method involves dividing the domain of the problem into a collection of subdomains, with each subdomain represented by a set of element equations to the original problem, followed by systematically recombining all sets of element equations into a global system of equations for the final calculation. The global system of equations has known solution techniques, and can be calculated from the initial values of the original problem to obtain a numerical answer. Finite element analysis (FEA) is a practical application of FEM for performing engineering analysis. It includes the use of mesh generation techniques for dividing a complex problem into small elements, as well as the use of software program coded with FEM algorithm.
FEA, an advanced computer technique of structural stress analysis developed in engineering mechanics, was first introduced to orthopedic biomechanics in 1972 to evaluate stress in human bones [1]. Since then, this method has been used to study the mechanics of human bones [2]. In the early 1990s, the FEA using 3-dimensional (3D) computed tomography (CT) data was developed and was clinically applied to assess vertebral bone strength [3]. The cadaver studies have verified CT-based FEA predicts failure loads and fracture patterns for 10-mm-thick vertebral sections [4].
There have been several attempts to predict fracture strength, and the correlations between compressive vertebral strength and predicted strength were reported to be high (r=0.89-0.95) [5-7]. However, the slopes of the regression line between the measured fracture loads and the predicted were much less than 1.0 (0.569-0.86) and no quantitative prediction could have been made with dependable accuracy. Furthermore, previous models did not compare the fracture pattern and fracture location within a whole vertebra. For clinical application, it is essential for a simulation method to be able to analyze and predict vertebral bone strength, fracture pattern, and fracture location because these are the requisite predictors of a vertebral fracture.
Analysis of vertebral fracture is difficult because of complex geometry, elastoplasticity, and thin cortical shell of the vertebra. The vertebra has elaborate architecture and geometry with curved surfaces, which cannot be modeled with eight-node hexahedron elements. Previous mechanical tests showed that there was a difference between tensile and compressive behavior of the bone [8-10]. The compressive behavior showed nonlinear behavior. Therefore, a nonlinear FEA should be utilized to analyze the clinical vertebral fracture.
The cortical shell of the vertebra is estimated to be thin with a thickness of less than 0.5 mm [11-13]. On the other hand, the resolution of a clinically available CT scanner is very low with a pixel spacing larger than 0.25 mm. With the currently available CT resolution, a thin cortical shell cannot be precisely modeled. The thickness tends to be overestimated and its density to be underestimated [14,15]. Therefore, it would be necessary to construct a thinner part of the cortical shell from data that is independent of CT data.
The purpose of this review article is to introduce a CT-based nonlinear FEA (CT/FEA) analyzing the vertebral bone strength, fracture pattern, and fracture location, and then to evaluate the accuracy of the CT/FEA by performing mechanical testing with human cadaveric specimens [16,17].
MATERIALS AND METHODS
Computed tomography-based nonlinear finite element analysis (CT/FEA)
The study was conducted with the approval of ethics committee and ethical guidelines of The University of Tokyo. Twelve thoracolumbar (T11, T12, and L1) vertebrae with no skeletal pathologies were collected within 24 hours of death from 4 males (31, 55, 67, and 83 years old). All of the specimens were obtained at The University of Tokyo Hospital. They were stored at -70 C° after each step in the protocol. The vertebrae were disarticulated, and the discs were excised. Then the posterior elements of each vertebra were removed by cutting through the pedicles. The vertebrae were immersed in water and axial CT images with a slice thickness of 1 mm and pixel width of 0.351 mm were obtained using Lemage SX/E (GE Yokokawa Medical System, Tokyo, Japan) with a calibration phantom containing hydroxyapatite rods.
The CT data were transferred to a workstation (Endeavor Pro-1000, Epson Direct Co., Nagano, Japan). The 3D finite element models of the vertebrae were constructed from the CT data using CT/FEA (MECHANICAL FINDER; Mitsubishi Space Software Co., Tokyo, Japan). Trabecular bone was simulated using 1 mm, 2 mm, or 3 mm linear tetrahedral elements (Figure 1). On average, there were 403,033, 47,687, and 11,903 elements constructed using 1 mm, 2 mm, and 3 mm tetrahedral elements, respectively. To the outer surface of the tetrahedral elements, triangular plates were attached as to form a cortical shell. The thickness of the cortical shell was set as 0.4 mm based on the previous papers [12,13]. To allow for bone heterogeneity, the mechanical properties of each element were computed from the Hounsfield unit value. Ash density of each voxel was determined from the linear regression equation created by these values of the calibration phantom. Ash density of each element was set as the average ash density of the voxels contained in one element. Young’s modulus and yield stress of each tetrahedron element were calculated from the equations proposed by Keyak et al. [18]. Young’s modulus of human vertebra cancellous tissue was reported as 3.8-13.4 GPa [19-22]; Young’s modulus of each triangular-plate forming a cortical shell was set as 10 GPa. Poisson’s ratio of each element was set as 0.4, which was used in the previous papers [18, 23].
Figure 1.

Finite element models. A whole vertebral body constructed with 1 mm (left), 2 mm (middle), or 3 mm (right) tetrahedral elements from the computed tomography data.
A uniaxial compressive load with uniform distribution was applied on the upper surface of the vertebra and all the elements and all the nodes of the lower surface were completely restrained. The models were analyzed using the CT/FEA. A nonlinear FEA by Newton-Raphson method was utilized. To allow for the nonlinear phase, mechanical properties of the elements were assumed to be bi-linear elastoplastic, and the isotropic hardening modulus was set as 0.05, which is generally used in the analysis of concrete materials. Each element was assumed to yield when its Drucker-Prager equivalent stress reached the element yield stress. Failure was defined as occurring when the minimum principal strain of an element was less than -10,000 microstrain. Vertebral fracture was defined as being when at least one element failed. The predicted fracture load was defined as the load that caused at least one element failed, and the predicted fracture load was defined as the analyzed bone strength. The bone strength, the sites where elements failed and the distribution of minimum principal strain were analyzed.
Mechanical testing
Quasi-static uniaxial compressive load testing of the vertebrae was conducted. Load, cross-head displacement, and principal strain at the vertebral surface were measured. To restrain the specimens for load testing, both upper and lower surfaces of the vertebrae were embedded in dental resin (Ostron; GC Dental Products Co., Aichi, Japan) so that the two surfaces were exactly parallel. Then the embedded specimens were placed on a mechanical testing machine (TENSILON UTM-2.5T; Orientec, Tokyo, Japan) and were compressed at a cross-head displacement rate of 0.5 mm per minute. A compression plate with a ball joint was used to apply a uniform load onto the upper surface of the specimen. The applied load was measured by a load cell (T-CLB-5-F-SR; T. S. Engineering, Kanagawa, Japan). The load and the cross-head displacement were recorded using MacLab/4 (AD Instruments, Castle Hill, NSW, Australia) at a sampling rate of 2 Hz. One of the four rosette strain gauges (SKF-22358; Kyowa Electronic, Tokyo, Japan) was attached to each of anterior, left, right and posterior surfaces of the vertebra. The strain readings were recorded at a sampling rate of 0.5 Hz and stored by a data logger (U-CAM-20PC-1; Kyowa Electronic, Tokyo, Japan); then, principal strain was calculated at each of the attachment sites. The ultimate load achieved was defined as the measured bone strength. To determine the actual fracture pattern and fracture location, antero-posterior and lateral soft X-ray pictures (Softex, Kanagawa, Japan) and micro-CT (MCT-CB100MF: Hitachi Medico Technology Corporation, Tokyo, Japan) images scanned with 70 kV, 100 μA, and a voxel size of 107 μm were obtained after the mechanical testing. The micro-CT images were processed and reconstructed to obtain the images at the mid-sagittal cross section and at the mid-frontal cross section. The types and sites of the experimental fractures were judged from the soft X-ray pictures and the reconstructed micro-CT images.
The undecalcified mid-sagittal histological sections of the vertebral bodies were directly observed. The specimens were immersed in Villanueva bone stain solution for 7 days for staining, then dehydrated and embedded in methylmethacrylate (Wako Pure Chemical Industries, Ltd., Osaka, Japan). The specimens were sawed to a thickness of 300 μm with a very fine toothed saw (BS3000: EXAKT, Hamburg, Germany) and then ground to a thickness of 50 μm with a polishing wheel. The ground specimens were immersed in Naphtol green B solution (Wako Pure Chemical Industries, Ltd.) for 30 minutes to stain the bone surface green.
A 3D surface acquisition system using an image encoder (VOXELAN; Hamano Engineering, Kanagawa, Japan) was employed to identify the gauge attachment sites on the shell elements by matching the 3D surface image with the CT/FEA. All three images of the 3D CT/FEA, the 2D digitized image, and the 3D surface image, were matched and the strain gauge attachment sites were then identified. The minimum principal strain was calculated with an applied load of 1,000 N, under which all specimens were in the elastic phase.
Pearson’s correlation analysis was used to evaluate correlations between the CT/FEA analyzed bone strength and the measured bone strength by mechanical testing, as well as between the analyzed and the measured minimum principal strains.
RESULTS
Bone strength and minimum principal strain
There was a strong linear correlation between the analyzed bone strength by the CT/FEA with 1 mm tetrahedral elements and the measured bone strength by mechanical testing (r = 0.938, p < 0.0001), and the slope of the regression line was 0.934. With 2 mm elements, the correlation was even stronger (r = 0.978, p < 0.0001), and the slope of the regression line was 0.881. With 3 mm elements, the correlation was slightly weaker (r = 0.866, p < 0.0001), and the slope of the regression line was 0.937. There was a strong linear correlation between the bone strength analyzed by the 1 mm element model and that by the 2 mm (r = 0.959, p < 0.0001), and the slope of the regression line was 0.868. With the 1 mm and 3 mm models, the correlation was slightly weaker (r = 0.912, p < 0.0001), and the slope of the regression line was 0.839. With the 2 mm and 3 mm models, the correlation was much weaker (r = 0.878, p < 0.0001), and the slope of the regression line was 0.730.
There was also a significant linear correlation between the CT/FEA analyzed minimum principal strain and the measured strain by mechanical testing (r = 0.838, p < 0.0001), and the slope of the regression line was 0.929 (Figure 2).
Figure 2.
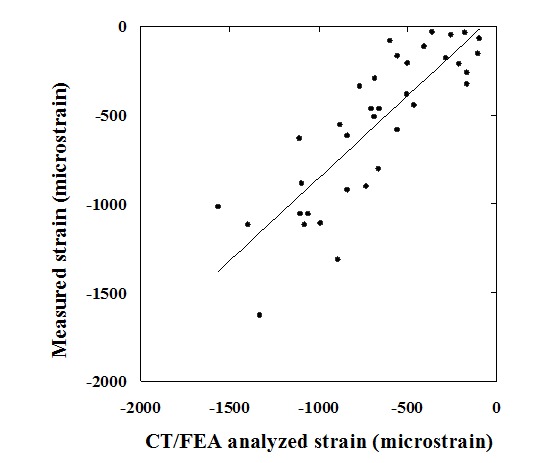
CT/FEA analyzed minimum principal strain versus measured minimum principal strain. Values of CT/FEA analyzed minimum principal strain and those of measured minimum principal strain by mechanical testing were significantly correlated.
Fracture pattern and fracture location
There were two types of experimental fractures after the mechanical testing. Obvious fracture lines were recognized in six vertebrae. There were no obvious fracture lines in the other six, but they had apparent residual deformities after the mechanical testing. The anterior part of the vertebra was compressed in three out of the six. The other two sustained middle part compression and in one there was compression of the entire vertebra.
In the six specimens with fracture lines, the experimental fracture locations in the specimens agreed well with those of the CT/FEA analyzed element failure. The area with markedly low minimum principal strain by the CT/FEA agreed well with that of the experimental fracture line at the mid-section of the vertebra (Figure 3). Fracture line was obviously visualized in 1 mm and 2 mm models. In 3 mm model, the area with markedly low minimum principal strain was blurred. From observation of the histology at the mid-section of the same specimens, densification of the longitudinal and transverse mineralized trabeculae was recognized at the area corresponding to the experimental fracture line. It was noted that the compressed trabeculae were collapsed and accumulated by loading (Figure 4).
Figure 3.

The reconstructed micro-CT image and the minimum principal strain distribution analyzed by the CT/FEA. The minimum principal strain distribution constructed with1 mm (left), 2 mm (middle), and 3 mm (right) elements at the mid-sagittal cross section.
Figure 4.
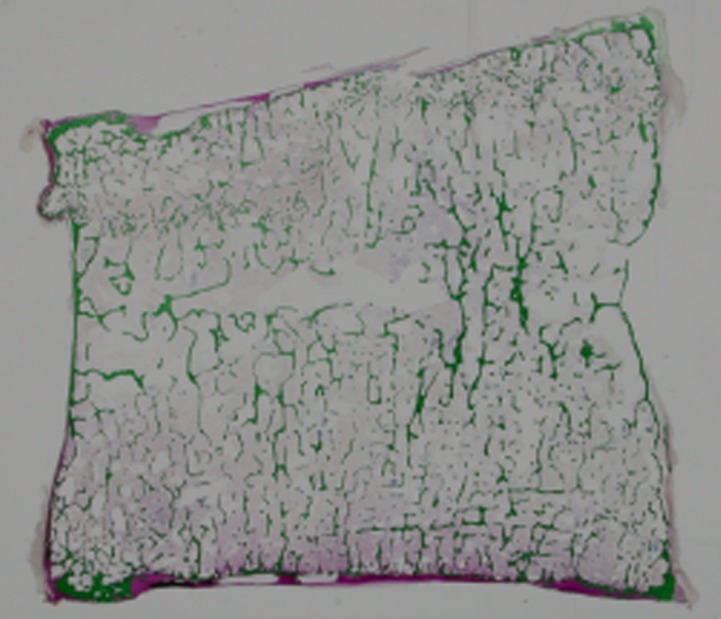
The mid-sagittal section of the undecalcified specimen after the mechanical testing. Direct histological observation revealed that the fracture line in the upper part consisted of piled calcified trabecular bone.
In the other six specimens with apparent residual deformities and without obvious fracture lines, vertebral compression fractures were occurred. In the specimen with anterior compression fracture, marked radiolucency was recognized at the anterior part of the vertebra, where the trabecular pattern was observed to be very coarse (Figure 5). The CT/FEA showed that the failed elements appeared at the same anterior part as the area with coarse trabeculae (Figure 6). Likewise, the area with large absolute value of the minimum principal strain localized at the anterior part, which agreed with the area of the experimental compression fracture (Figure 7). Histological findings of the same specimen disclosed that the thick longitudinal mineralized trabecula and bone marrow were observed only at the posterior part; on the contrary, there was little continuity of the longitudinal trabecula with less content of the bone marrow at the anterior part (Figure 8). It was shown that the compressive loading caused massive failure of the longitudinal trabecula at the anterior part, which resulted in compression fracture. In addition, springing back of the anterior part of the vertebral body by unloading made the trabecula course within this part.
Figure 5.
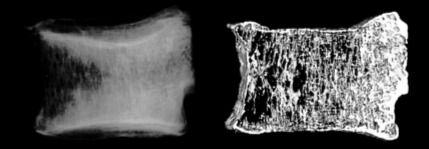
The lateral soft X-ray radiogram and the reconstructed micro-CT image after the mechanical testing. Marked radiolucency was recognized at the anterior part of the vertebra.
Figure 6.
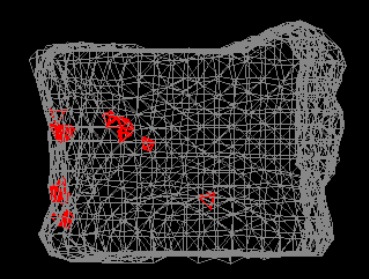
CT/FEA analysis. Red elements as the failed elements appeared at the anterior part of the vertebra.
Figure 7.

The minimum principal strain distribution. CT/FEA analysis with 1 mm (left), 2 mm (middle), and 3 mm (right) elements.
Figure 8.
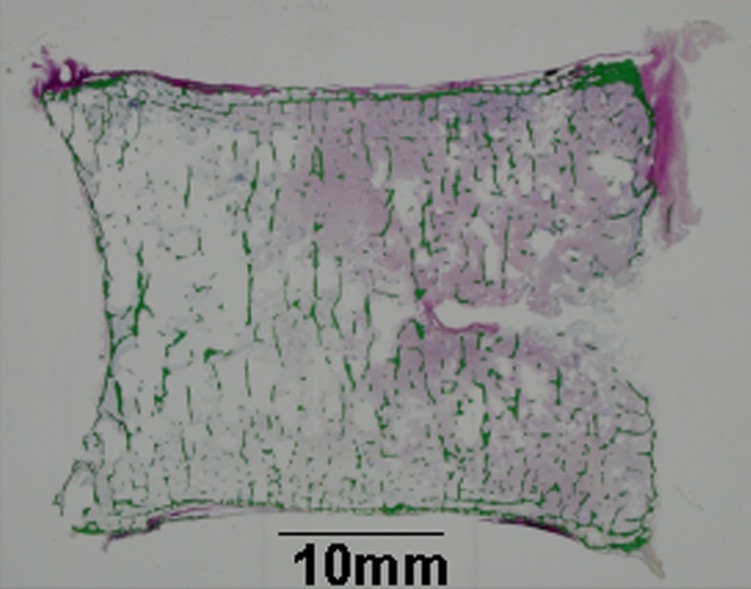
The histological examination of the mid-section of the specimen after the mechanical testing. There was little continuity of the longitudinal trabecula with less content of the bone marrow at the anterior part.
DISCUSSION
The characteristics of the CT/FEA in this review were as follows: adoption of the tetrahedral elements to model the surface curvature of the entire vertebra, utilization of nonlinear analysis to match the elastoplasticity of the vertebra during compression, construction of a cortical shell as the surface of the model, and adoption of Drucker-Prager equivalent stress instead of von-Mises stress as a criterion of an element yield. It has been reported that the thin cortex of a vertebra contributes 12-75 % to its overall strength and the contribution of the cortex is estimated to be significantly larger in osteoporotic individuals [24]. Thus, the importance of the strength of the cortical shell should be taken into consideration when analyzing the fracture load for osteoporosis patients.
The limitation of the CT/FEA is that the cortical shell was treated as a homogenous material because the pixels of CT scans were too large to model the thin cortex. In addition, with the limited resolution of currently available CT scanners, the micro-architecture of the bone cannot be precisely assessed. Micro-CT and synchrotron micro-CT can visualize bone microstructure [25]. Therefore, an FEA based on micro-CT data may show more accurate simulation because it would be possible to model a cortical shell with heterogeneous properties and also to assess the micro-architecture. However, obtaining micro-CT scans of a whole vertebra in vivo would be impossible with the currently available scanners. Also, use of thinner CT slices to obtain images leads to more radiation exposure. To decrease radiation exposure for clinical use, somewhat thicker slices would be more appropriate. To decrease radiation exposure as much as possible during CT scanning, optimization of the element size was performed by assessing the accuracy of the CT/FEA.
Three models with a different element size of 1 mm, 2 mm and 3 mm were assessed. With an element size of 1 mm and 2 mm, the correlation between the bone strength analyzed by the CT/FEA and that measured experimentally was very strong (r > 0.90). With an element size of 3 mm, the correlation was slightly weaker (r < 0.90). Although all of the three models were generated using CT data obtained with a 1 mm slice thickness, these results suggested that the elements with a size of 1 mm or 2 mm could be used to accurately evaluate the bone strength. There was a stronger correlation (r = 0.978) with 2 mm tetrahedral elements than with either 1 mm or 3 mm elements. The correlation was better than in previous studies (r = 0.89-0.95) [5-7]. The slope of the regression line obtained with 2 mm tetrahedral elements was 0.881, which was also better than in previous studies (0.569-0.86) [5-7]. The previous FEA studies had failed to model the surface curvature of the vertebra, match the elastoplasticity of the vertebra, or model a cortical shell. These results indicated that the CT/FEA in this study evaluate compressive vertebral strength more accurately. The correlation between the fracture load with 1 mm and 2 mm elements (r = 0.959) was stronger than both of the correlations between 1 mm and 3 mm (r = 0.912), and between 2 mm and 3 mm (r = 0.878). The slope of the regression line relating 1 mm and 2 mm (0.868) was also better than that relating 1 mm and 3 mm (0.839), and that relating 2 mm and 3 mm (0.730). These results indicated that the CT/FEA with the 1 mm and 2 mm elements achieved more accurate results than the 3 mm elements. Considering reduction of radiation exposure, the optimum CT slice thickness and element size were assumed to be 2 mm. With 2 mm CT slice thickness and element size, vertebral bone strengths in 78 elderly women were assessed using the CT/FEA [17], showing that this method can be used in alive subjects.
There were two types of vertebral fracture pattern: one showed fracture line and the other showed no fracture lines but had apparent residual deformities. Both fracture types could be simulated. Fracture location was most accurately simulated by the distribution of very low levels of the minimum principal strain. Therefore, we speculated that fracture was initiated at the sites of failed elements and propagated along with the area with very low minimum principal strain.
The analysis was made under a very simple loading condition with quasi-static uniaxial vertical loading. The condition was the simplest but it minimized experimental error which might have occurred to some degree with complicated loading conditions. Arbitrary load magnitude or direction can be set for the same simulation model. So it is possible to analyze bone strength or fracture location of vertebra for loading conditions which actually cause fractures, although it would be very hard to create these fractures under an experimental condition. The CT/FEA has also been applied for analyzing vertebral bone strength under loading conditions in activities of daily living [26]. Vertebral strength under the forward bending condition was significantly lower than under the uniaxial compressive loading condition.
The posterior portion of the vertebra was excised in this study. A 3D surface acquisition system using an image encoder was employed to identify the gauge attachment sites on the shell elements. With posterior portion of the vertebra such as lamina or spinous process, obtaining 3D surface image of the posterior part of the vertebral body should be blocked. That was one of the reasons why the posterior portion of the vertebra was excised. Clinically, most of the vertebral fractures occur in vertebral body.
The unique features and the advantages of the CT/FEA are that this method can predict vertebral bone strength, fracture pattern, and fracture location before the actual fracture. In clinical data, the CT/FEA method had higher discriminatory power for vertebral fracture than lumbar spine areal bone mineral density by dual energy X-ray absorptiometry and lumbar spine volumetric bone mineral density by quantitative CT [27, 28]. It is expected that the CT/FEA will be valuable in estimating fracture risk of vertebrae clinically.
SUMMARY AND CONCLUSIONS
CT/FEA which analyzed the vertebral bone strength, fracture pattern, and fracture location was introduced. The accuracy of the CT/FEA was validated by performing experimental mechanical testing with human cadaveric specimens. Vertebral bone strength and the minimum principal strain at the vertebral surface were accurately analyzed using the CT/FEA. The experimental fracture pattern and fracture location were also accurately simulated. Optimization of the element size was performed by assessing the accuracy of the CT/FEA, and the optimum element size was assumed to be 2 mm. It is expected that the CT/FEA will be valuable in analyzing vertebral fracture risk and assessing therapeutic effects on osteoporosis.
Footnotes
Conflict of interests
The author has no conflict of interest to disclose.
References
- [1].Brekelmans WA,Poort HW,Slooff TJ (1972). A new method to analyse the mechanical behaviour of skeletal parts. Acta Orthop Scand, 43: 301-317. [DOI] [PubMed] [Google Scholar]
- [2].Huiskes R,Chao EY (1983). A survey of finite element analysis in orthopedic biomechanics: the first decade. J Biomech, 16: 385-409. [DOI] [PubMed] [Google Scholar]
- [3].Faulkner KG,Cann CE,Hasegawa BH (1991). Effect of bone distribution on vertebral strength: assessment with patient-specific nonlinear finite element analysis. Radiology, 179: 669-674. [DOI] [PubMed] [Google Scholar]
- [4].Silva MJ,Keaveny TM,Hayes WC (1998). Computed tomography-based finite element analysis predicts failure loads and fracture patterns for vertebral sections. J Orthop Res, 16: 300-308. [DOI] [PubMed] [Google Scholar]
- [5].Martin H,Werner J,Andresen R,Schober HC,Schmitz KP (1998). Noninvasive assessment of stiffness and failure load of human vertebrae from CT-data. Biomed Tech, 43: 82-88. [DOI] [PubMed] [Google Scholar]
- [6].Liebschner MA,Kopperdahl DL,Rosenberg WS,Keaveny TM (2003). Finite element modeling of the human thoracolumbar spine. Spine, 28: 559-565. [DOI] [PubMed] [Google Scholar]
- [7].Crawford RP,Cann CE,Keaveny TM (2003). Finite element models predict in vitro vertebral body compressive strength better than quantitative computed tomography. Bone, 33: 744-750. [DOI] [PubMed] [Google Scholar]
- [8].Keaveny TM,Wachtel EF,Ford CM,Hayes WC (1994). Differences between the tensile and compressive strengths of bovine tibial trabecular bone depend on modulus. J Biomech, 27: 1137-1146. [DOI] [PubMed] [Google Scholar]
- [9].Kopperdahl DL,Keaveny TM (1998). Yield strain behavior of trabecular bone. J Biomech, 31: 601-608. [DOI] [PubMed] [Google Scholar]
- [10].Morgan EF,Keaveny TM (2001). Dependence of yield strain of human trabecular bone on anatomic site. J Biomech, 34: 569-577. [DOI] [PubMed] [Google Scholar]
- [11].Silva MJ,Wang C,Keaveny TM,Hayes WC (1994). Direct and computed tomography thickness measurements of the human, lumbar vertebral shell and endplate. Bone, 15: 409-414. [DOI] [PubMed] [Google Scholar]
- [12].Vesterby A,Mosekilde L,Gundersen HJ, et al. (1991). Biologically meaningful determinants of the in vitro strength of lumbar vertebrae. Bone, 12: 219-224. [DOI] [PubMed] [Google Scholar]
- [13].Mosekilde L (1993). Vertebral structure and strength in vivo and in vitro. Calcif Tissue Int, 53: S121-S126. [DOI] [PubMed] [Google Scholar]
- [14].Dougherty G,Newman D (1999). Measurement of thickness and density of thin structures by computed tomography: a simulation study. Med Phys, 26: 1341-1348. [DOI] [PubMed] [Google Scholar]
- [15].Prevrhal S,Engelke K,Kalender WA (1999). Accuracy limits for the determination of cortical width and density: the influence of object size and CT imaging parameters. Phys Med Biol, 44: 751-764. [DOI] [PubMed] [Google Scholar]
- [16].Imai K,Ohnishi I,Bessho M,Nakamura K (2006). Nonlinear finite element model predicts vertebral bone strength and fracture site. Spine, 31: 1789-1794. [DOI] [PubMed] [Google Scholar]
- [17].Imai K,Ohnishi I,Yamamoto S,Nakamura K (2008). In vivo assessment of lumbar vertebral strength in elderly women using CT-based nonlinear finite element model. Spine, 33: 27-32. [DOI] [PubMed] [Google Scholar]
- [18].Keyak JH,Rossi SA,Jones KA,Skinner HB (1998). Prediction of femoral fracture load using automated finite element modeling. J Biomech, 31: 125-133. [DOI] [PubMed] [Google Scholar]
- [19].Jensen KS,Mosekilde L (1990). A model of vertebral trabecular bone architecture and its mechanical properties. Bone, 11: 417-423. [DOI] [PubMed] [Google Scholar]
- [20].Rho JY,Tsui TY,Pharr GM (1997). Elastic properties of human cortical and trabecular lamellar bone measured by nanoindentation. Biomaterials, 18: 1325-1330. [DOI] [PubMed] [Google Scholar]
- [21].Hou FJ,Lang SM,Hoshaw SJ,Reimann DA,Fyhrie DP (1998). Human vertebral body apparent and hard tissue stiffness. J Biomech, 31: 1009-1015. [DOI] [PubMed] [Google Scholar]
- [22].Ladd AJ,Kinney JH,Haupt DL,Goldstein SA (1998). Finite-element modeling of trabecular bone: comparison with mechanical testing and determination of tissue modulus. J Orthop Res, 16: 622-628. [DOI] [PubMed] [Google Scholar]
- [23].Overaker DW,Langrana NA,Cuitino AM (1999). Finite element analysis of vertebral body mechanics with a nonlinear microstructural model for the trabecular core. J Biomech Eng, 121: 542-550. [DOI] [PubMed] [Google Scholar]
- [24].Rockoff SD,Sweet E,Bleustein J (1969). The relative contribution of trabecular and cortical bone to the strength of human lumbar vertebrae. Calcif Tissue Res, 3: 163-175. [DOI] [PubMed] [Google Scholar]
- [25].Ito M (2005). Assessment of bone quality using micro-computed tomography (micro-CT) and synchrotron micro-CT. J Bone Miner Metab, 23: S115-S121. [DOI] [PubMed] [Google Scholar]
- [26].Matsumoto T,Ohnishi I,Bessho M,Imai K,Ohashi S,Nakamura K (2009). Prediction of vertebral strength under loading conditions occurring in activities of daily living using a computed tomography-based nonlinear finite element method. Spine, 34: 1464-1469. [DOI] [PubMed] [Google Scholar]
- [27].Imai K,Ohnishi I,Matsumoto T,Yamamoto S,Nakamura K (2009). Assessment of vertebral fracture risk and therapeutic effects of alendronate in postmenopausal women using a quantitative computed tomography-based nonlinear finite element method. Osteoporos Int, 20: 801-810. [DOI] [PubMed] [Google Scholar]
- [28].Imai K (2011). Vertebral fracture risk and alendronate effects on osteoporosis assessed by a computed tomography-based nonlinear finite element method. J Bone Miner Metab, 29: 645-651. [DOI] [PubMed] [Google Scholar]


