Abstract
Purpose:
The purpose of this work is to develop a clinically feasible method of calculating actual delivered dose distributions for patients who have significant respiratory motion during the course of stereotactic body radiation therapy (SBRT).
Methods:
A novel approach was proposed to calculate the actual delivered dose distribution for SBRT lung treatment. This approach can be specified in three steps. (1) At the treatment planning stage, a patient-specific motion model is created from planning 4DCT data. This model assumes that the displacement vector field (DVF) of any respiratory motion deformation can be described as a linear combination of some basis DVFs. (2) During the treatment procedure, 2D time-varying projection images (either kV or MV projections) are acquired, from which time-varying “fluoroscopic” 3D images of the patient are reconstructed using the motion model. The DVF of each timepoint in the time-varying reconstruction is an optimized linear combination of basis DVFs such that the 2D projection of the 3D volume at this timepoint matches the projection image. (3) 3D dose distribution is computed for each timepoint in the set of 3D reconstructed fluoroscopic images, from which the total effective 3D delivered dose is calculated by accumulating deformed dose distributions. This approach was first validated using two modified digital extended cardio-torso (XCAT) phantoms with lung tumors and different respiratory motions. The estimated doses were compared to the dose that would be calculated for routine 4DCT-based planning and to the actual delivered dose that was calculated using “ground truth” XCAT phantoms at all timepoints. The approach was also tested using one set of patient data, which demonstrated the application of our method in a clinical scenario.
Results:
For the first XCAT phantom that has a mostly regular breathing pattern, the errors in 95% volume dose (D95) are 0.11% and 0.83%, respectively for 3D fluoroscopic images reconstructed from kV and MV projections compared to the ground truth, which is clinically comparable to 4DCT (0.093%). For the second XCAT phantom that has an irregular breathing pattern, the errors are 0.81% and 1.75% for kV and MV reconstructions, both of which are better than that of 4DCT (4.01%). In the case of real patient, although it is impossible to obtain the actual delivered dose, the dose estimation is clinically reasonable and demonstrates differences between 4DCT and MV reconstruction-based dose estimates.
Conclusions:
With the availability of kV or MV projection images, the proposed approach is able to assess delivered doses for all respiratory phases during treatment. Compared to the planning dose based on 4DCT, the dose estimation using reconstructed 3D fluoroscopic images was as good as 4DCT for regular respiratory pattern and was a better dose estimation for the irregular respiratory pattern.
Keywords: SBRT, 4DCT, respiratory motion, treatment verification
1. INTRODUCTION
Discrepancies between planned and delivered dose to tumors and normal tissues can potentially lead to unsafe and/or ineffective treatments, caused by increased dose to critical structures and decreased dose to the tumor. As the organ displacement around the diaphragm could be 2–3 cm or larger in the superior–inferior (SI) direction, respiratory motion should be fully considered for radiation treatments involving thoracic and upper abdominal cancers that involve lung, stomach, pancreas, and liver.1 The discrepancy could be especially severe in stereotactic body radiation therapy (SBRT) for lung cancer treatment because the consequence is magnified by its low fraction number (3–5 fractions) and high fractional dose (12–18 Gy per fraction). However, as in vivo dosimetry is currently not available clinically, dose–response studies are generally based on prescribed or planned dose instead of delivered dose. Studies of actual delivered dose with respiratory motion are therefore of great significance to address the differences between prescribed and delivered doses. Accurate knowledge of delivered radiation dose distribution can improve the safety of treatment delivery by detecting the discrepancies, improve the quality of treatments by allowing plan adaptations based on actual delivered dose and patient motion pattern, and increase the precision of dose–response studies by providing accurate estimation of endpoints.
For the purpose of dose assessment and verification, the general idea is to place some type of detector close to the patient and correlate the detector response with the dose in the treatment volume using an established model.2 Several methods have been reported to assess delivered dose during treatment. Electronic portal imaging devices (EPIDs) play an important role in dose assessment and verification because they are available on existing clinical equipments and require no additional imaging dose. Several approaches have been developed to link EPID images to actual delivered dose. Berbeco et al.3–6 proposed a dose estimation method based on beam’s-eye-view images (MV images acquired by EPID), which was applied for liver IMRT and lung SBRT dose verification. This approach gave a good estimation of the tumor dose but cannot calculate the 3D dose to normal tissues that move relative to the tumor. Elmpt et al.7,8 combined MV cone-beam CT with images recorded by EPID during treatment to verify the delivered dose. McDermott et al.9 acquired kV cone beam CT images and MV portal images to verify hypofractionated IMRT treatment dose for rectal cancer patients. Recently, Hurwitz et al.10 proposed to reconstruct the 3D images of respiratory phases during treatment using external surrogate signals, based on which the actual delivered dose can be calculated for the entire volume.
In this work, we propose a comprehensive approach to assess actual 3D delivered dose for patients who have significant respiratory motion during SBRT treatment. The basic idea is to reconstruct 3D images of the patient using kV or MV projection images acquired at sampled timepoints during the treatment, calculate 3D dose distributions for the timepoints, and accumulate deformed doses to assess the actual delivered dose to tumor and critical organs. This approach can be incorporated into current SBRT planning and treatment practice as it is developed using readily available information that can be processed offline, after each treatment delivery.
This is the first proof-of-concept study of delivered dose assessment for SBRT lung cancer treatment that combines principal component analysis (PCA) approach11–16 for 3D reconstructions at sampled timepoints and the Monte Carlo-based Dose Planning Method (DPM)17 for dose calculation. Although the PCA approach has been validated for tumor localization with the presence of significant respiratory motion, further investigation was needed to investigate the feasibility, accuracy, and potential usefulness of using these 3D images for dose calculation, particularly for patients who breathe differently than they did during acquisition of the 4DCT used for motion modeling.
This approach was first validated using two modified digital extended cardio-torso (XCAT) phantoms with lung tumors and different respiratory motions.18,19 The estimated dose was compared to the dose that would be calculated for routine 4DCT-based planning and to the actual delivered dose in treatment. The approach was also applied to a patient dataset.
2. MATERIALS AND METHODS
2.A. Workflow of the proposed dose estimation approach
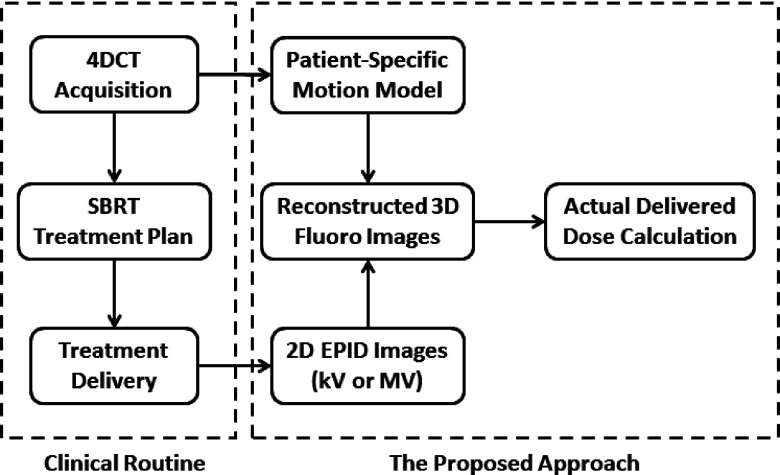
Figure 1 illustrates the workflow of our proposed approach to assess 3D actual delivered dose with respiratory motion in SBRT lung treatment in the context of a typical clinical setting. The left box groups standard procedures for SBRT lung treatment. 4DCT images are acquired to account for respiratory motions in the treatment planning stage. The right box groups major steps of our approach. (1) At the treatment planning stage, a patient-specific motion model is extracted from planning 4DCT data. This model assumes that the displacement vector field (DVF) of any timepoint of respiratory motion can be described as a linear combination of some basis DVFs.11–13 (2) During the treatment, 2D time-varying projection images (either kV or MV) are acquired, from which time-varying fluoroscopic 3D images of the patient are reconstructed using the motion model. The DVF of each phase in the time-varying reconstruction is an optimized linear combination of basis DVFs such that the 2D projection of the 3D volume at this phase matches the projection image.14,15 (3) The 3D dose distribution is computed for each timepoint in the set of 3D reconstructed fluoroscopic images, from which the total effective 3D delivered dose is calculated by accumulating deformed dose distributions. Each of the steps will be described in more detail in Secs. 2.B–2.F.
FIG. 1.
Flowchart of the proposed approach to assess 3D actual delivered dose with respiratory motion for SBRT treatment.
2.B. Simulation data sets
2.B.1. Modified XCAT phantom data
A mass-conserving XCAT digital phantom18,19 was used to validate the dose assessment approach. A modified XCAT phantom incorporates predefined tumor trajectories and generates synchronized anatomical motion based on local mass conservation. Details of adaptive calculation of chest wall and diaphragm motion and the generation of mass-conserving 3D data based on recorded tumor trajectories are described in the literatures.19 The 3D patient tumor trajectories were experimentally acquired with the Mitsubishi real-time radiation therapy (RTRT) system in the Radiation Oncology Clinic at the Nippon Telegraph and Telephone Company in Sapporo, Japan, which was detailed in the literature.20
Two sets of modified XCAT phantoms (XCAT1 and XCAT2) were generated using the respiratory pattern of two patients. Each set of phantoms corresponds to 54 s of respiratory motion with tumor trajectories measured at 2 Hz. In both sets, each 3D phantom image had a dimension of 256 × 256 × 140 with a voxel size of 2 × 2 × 2.5 mm in the left–right (LR), anterior–posterior (AP) and SI directions, respectively.
2.B.2. Patient data
The performance of the proposed approach was also tested using patient data acquired at our clinic. One set of lung cancer patient data was selected who had a mass in the left lung and underwent SBRT treatment. The 4DCT data were acquired using a sixteen-slice LightSpeed RT16 CT scanner (GE Medical Systems, Milwaukee, WI) in an axial cine mode with a voxel size of 1.27 × 1.27 × 2.5 mm, which corresponded to one nominal breathing cycle and was used for treatment planning. The EPID images were acquired during SBRT treatment on a Novalis Tx linear accelerator using 6 MV at a dose rate of 600 MU/min. The imager has a physical size of 40 × 30 cm and a pixel pitch of 0.39 mm. The EPID images were acquired at 2 frames/s with 2 × 2 binning mode (512 × 384 pixels). The source-to-axis (SAD) and source-to-imager (SID) distances were 100 and 180 cm, respectively. The field size defined by the multileaf collimator (MLC) was approximately 5 × 4 cm and the gantry angle was 20° when EPID images were acquired. There are a total of 160 EPID images corresponding to 80 s.
2.C. Dose assessment framework
For the purpose of validating the proposed dose calculation approach, a framework was designed to compare the delivered dose obtained from 4DCT, ground-truth fluoroscopic images and 3D reconstructed fluoroscopic images. These three types of doses are explained as follows.
-
(1)
4DCT and 4DCT dose: 4DCT images are a set of 3D images corresponding to respiratory phases in one complete cycle (start-of-inhale to end-of-exhale). Given a field design, the delivered dose to tumor is different for each phase because of different tumor positions, and the accumulated dose from all 4DCT phases is called the 4DCT dose. For XCAT1 and XCAT2, the set of 4DCT images is selected as a subset of XCAT phantoms that covers a single respiratory cycle. For the patient, 4DCT images from treatment simulation were used.
-
(2)
Ground-truth 3D fluoroscopic images and ground-truth dose: For XCAT1 and XCAT2, another subset was selected from the set of XCAT phantoms to simulate the “actual” XCAT “patient” images with respiratory motions in multiple cycles during treatment delivery, which are called the ground-truth fluoroscopic images. Dose distributions were calculated for all timepoints of the ground-truth fluoroscopic images and were accumulated to assess the actual dose delivered to the GTV, which is the ground truth for comparison. There is no ground-truth dose for the patient case because it is not possible to obtain the actual 3D patient images during treatment.
-
(3)
Reconstructed 3D fluoroscopic images and reconstruction dose: 3D images are reconstructed using the motion model and projection images to approximate 3D fluoroscopic images. For XCAT1 and XCAT2, a kV image or an MV image is simulated as digitally reconstructed radiographs (DRRs) for each time point of the ground-truth fluoroscopic images. The kV image is calculated at 90° view angle with 80 keV (mean energy for 150 kVp) and the MV image is calculated at 45° view angle with 1 MeV (mean energy for 6 MV). Based on the kV or MV image, the 3D image is computed using our patient-specific motion model to approximate the anatomy at each timepoint. The set of resulting 3D images is called reconstructed 3D fluoroscopic images. In the patient case, there were no kV images and only the MV images were available. Dose distributions were then calculated for each phase of the reconstructed 3D fluoroscopic images and were accumulated to assess the dose to GTV. This is called the reconstruction dose, which could be kV reconstruction dose or MV reconstruction dose.
2.D. Patient-specific motion model
Our group and collaborators have developed a patient-specific motion model11–15 based on the assumption that the anatomy displacement due to the respiratory motion at any phase can be described as a linear combination of a set of basis DVFs. The key part of a patient-specific motion model is the set of basis DVFs (eigenvectors), which represent the “basic” motion vectors of each voxel. These basis DVFs are calculated from the planning 4DCT data, which can be achieved in the following two steps.
2.D.1. DVF
Assume the 4DCT image set includes N time-varying images (N phases) in a complete respiratory cycle. If one of the time-varying images is selected as the reference image, then any of the other N − 1 time-varying images can be deformed to the reference image using a deformable image registration (dir) algorithm, which will generate a DVF that links any time-varying image with the reference image through Eq. (1).
| (1) |
The phase of peak exhale was selected as the reference phase. A variation of Demon’s algorithm implemented on GPU was selected to compute dir as it has been well validated for lung CT.21 As CT images of chest show high anatomical contrast among lung, tumor, muscle, and ribs, the passive force algorithm was selected to compute deformation vectors because it can better handle images with large gradient. The deformation vectors were sequentially updated at three levels of spatial resolution from low (4 × downsampled) to high (original), and at each level, they are iteratively updated until a specified stopping criteria (difference of relative norm less than 1 × 10⁻⁴).21 The accuracy of deformable image registration is critical element of the modeling procedure. The demons algorithm used in this study has been validated on patient lung 4DCT using the data at dir-labs.com. Other deformable image registration algorithms could be substituted in if improved ones are developed.
2.D.2. Basis DVF decomposition
PCA was employed to compute the basis DVFs ui (called eigenvectors or principle components) from the N − 1 DVFs obtained from above. PCA is able to identify and rank principal components (most significant eigenvectors) while eliminating redundancies. In term of ui, each DVF can be written as
| (2) |
where is the mean DVF of all phases from 4DCT and wi is the coefficients for the i-th eigenvector. K is the number of principal components. For this work, we choose K = 3, which has been shown to provide good results in previous studies.10–15
2.E. Reconstruction of 3D fluoroscopic patient images
It is assumed that during treatment delivery, the patient’s anatomy change caused by respiratory motion can be characterized using the same set of basis DVFs as that from 4DCT. Thus, it is possible to reconstruct a set of fluoroscopic 3D patient images by finding the proper coefficients of the linear combinations in Eq. (2) such that at each phase, the reconstructed 3D image can produce a projection that matches the corresponding projection image acquired during treatment. Li et al.11–13 proposed an algorithm to iteratively computing the linear coefficients for each 3D image by minimizing a cost function as in Eq. (3),
| (3) |
where is the L2-norm of the error between the linear projection of the 3D object and the acquired projection image. is the reference image, is the reconstructed 3D image, P is the linear projection operator, and y is the projection image at each phase. Both a and b are correctors to address possible background and intensity differences.
The projection image y could be either a kV image acquired by an On-Board Imager (OBI) or an MV image acquired by an EPID. The kV image usually has a larger field-of-view (40 × 30 cm) and a higher soft tissue contrast, and the tissues’ linear attenuation coefficients at kV match that for the 4DCT image. A small rectangular field with approximately the same size as the treatment fields was used for MV projections. Preliminary evidence suggests that as long as the tumor can be distinguished in the MV image, the algorithm is able to produce similar reconstruction accuracy as is achievable with kV images.15
2.F. Dose calculation and accumulation
A Monte Carlo-based method was used to calculate delivered dose for each 3D image, which could be any phase in 4DCT, ground-truth or reconstructed fluoroscopic images. The package was developed and validated by Seco et al.22 and has been used in several studies.10,22–26 The major steps are illustrated in Fig. 2.
FIG. 2.
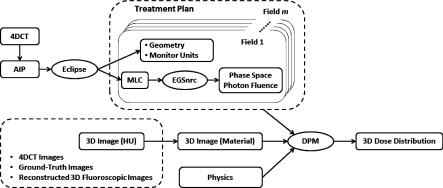
Flowchart of the Monte Carlo-based dose calculation approach.
Treatment plans were created with eight static MLC fields, where the MLCs were fit to the outline of the PTV in the beam’s-eye-view of each field. Field shaping was performed in eclipse v.11 (Varian Medical Systems, Palo Alto, CA). The PTV was defined as the ITV with no margin added for setup error (except for the patient case, as described in Sec. 3). Calculated based on 4DCT, plans were normalized to deliver 54 Gy to 95% of the gross tumor volume (a tumor D95 of 54 Gy). The MLC and beam geometries were imported into EGSnrc and used to calculate the phase space information of photon fluence for a 6 MV x-ray beam modeled for a Varian 2100C/D linear accelerator. Fifteen million photons per field were simulated to maintain the statistical uncertainty below 1%. Based on the 3D image in Hounsfield units, 3D image with material type and electron density information was prepared, which, together with phase space information, geometry information, and parameters of all involved physical interactions, were input into and processed by DPM (Ref. 17) to calculate the 3D dose distribution for each 3D image/timepoint.
Due to anatomical changes caused by respiratory motion, the calculated dose distributions for each phase cannot be directly added together to obtain the total delivered dose. Using DVFs derived from deformable image registration between the images upon which dose is being calculated, and the reference phase, dose distributions at each time point were deformed to match the 3D anatomy at the reference phase. The dose was then accumulated across all timepoints to determine the final dose estimation. The detailed procedure is shown in Fig. 3. The accuracy of dose deformation is important in dose assessment especially when the dose gradient is steep.
FIG. 3.
Flowchart of dose accumulation to calculate the delivered dose.
3. RESULTS
3.A. XCAT phantom studies
3.A.1. Respiratory motion
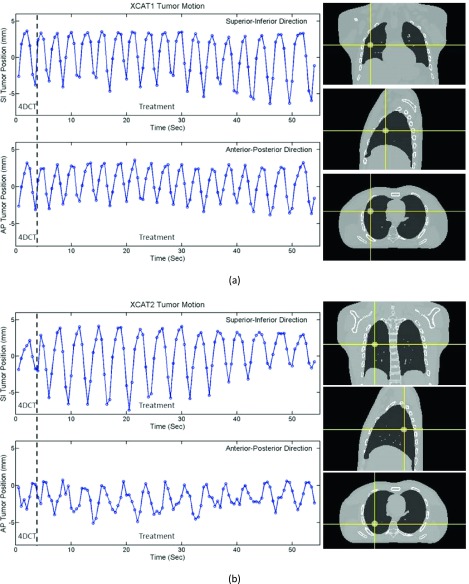
The ground-truth tumor positions of the two XCAT phantoms are illustrated in Figs. 4(a) and 4(b) where the relative positions in both SI and AP directions are shown. XCAT1 has a mostly regular breathing pattern and the cycle chosen as 4DCT is comparable to the cycles used for treatment. XCAT2, however, has an irregular breathing pattern and the motion in 4DCT cycle is relatively small.
FIG. 4.
Design of the two XCAT phantoms. (a) XCAT1 has a fairly regular breathing pattern and the tumor motion in 4DCT is a good representation of that during simulated treatment. (b) XCAT2 has irregular breathing patterns where tumor motion in 4DCT is smaller than that during simulated treatment.
3.A.2. Accuracy of dose deformation
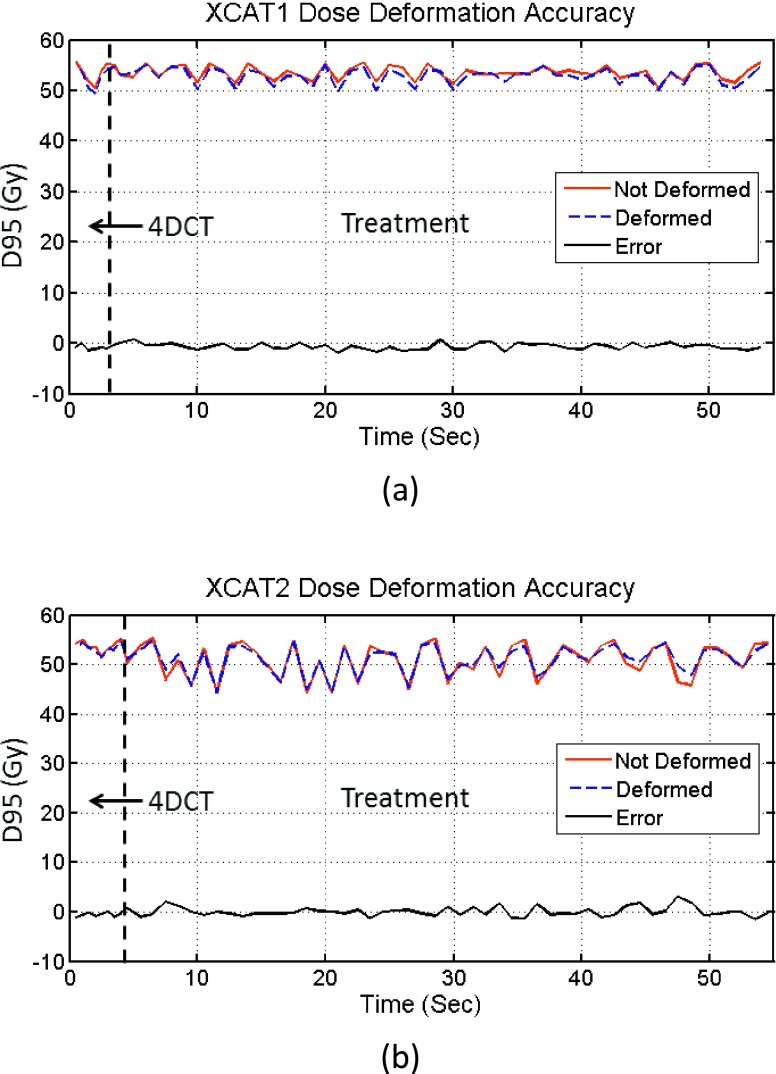
The accuracy of dose deformation was assessed for XCAT1 and XCAT2 using the ground-truth 3D fluoroscopic images. Dose distributions were deformed using the method described in Fig. 3. For this experiment, a nondeforming, rigidly moving tumor was used. In this scenario, the actual absorbed dose of the tumor at any timepoint should not be altered by dose accumulation. The dose to the tumor should not be changed when it is shifted back to a reference phase using the DVFs derived from image registration. Thus, the accuracy of dose accumulation based on the DVFs can be assessed by comparing the dose to the tumor at each time point before and after deformation to the reference phase. To quantify the dose distributions in the tumor volume at each timepoint, we define the “scaled instantaneous D95” of the tumor. This is the D95 of the tumor if the entire dose had been delivered at a given timepoint (with the anatomy and tumor stationary in the position at that timepoint). Figure 5 shows comparisons of the scaled instantaneous D95 of the tumor before and after dose deformation, for each timepoint. The errors of scaled instantaneous D95 values due to deformation are also plotted, and for most phases, the absolute errors are smaller than 1%, showing that the dose accumulation does not introduce large errors in this scenario.
FIG. 5.
Dose deformation accuracy of the two XCAT phantoms. (a) XCAT1 and (b) XCAT2. D95 refers to the scaled instantaneous D95 of the tumor, as defined in the main text.
3.A.3. Comparison of ground-truth dose and reconstruction dose
The concept of scaled instantaneous D95 value was also used as an indicator to compare how the 3D dose distributions of reconstructed time-varying images resemble the ground truth. For the two XCAT phantoms, D95 values were measured at all phases in 4DCT, ground-truth images, and both kV and MV reconstructed fluoroscopic images, and the values are plotted in Fig. 6. It is clear that D95 changes with tumor displacement and that at timepoints where the tumor displacement is large, D95 could be smaller than the prescribed dose. D95 curves of both kV and MV reconstructions generally follow the trend of the ground truth well. The MV curve is lower at timepoints with large displacement.
FIG. 6.
Accuracy of reconstruction dose for the two XCAT phantoms. (a) XCAT1 and (b) XCAT2. D95 refers to the scaled instantaneous D95 of the tumor.
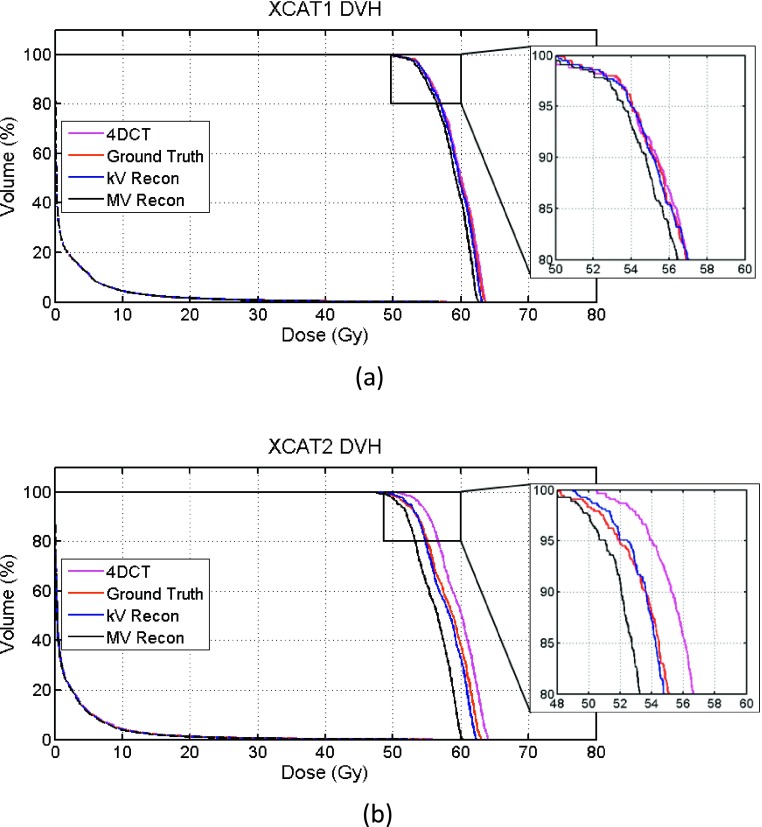
Figure 7 compares the dose–volume histogram (DVH) curves of 4DCT, ground truth, and kV recon and MV recon images for both XCAT phantoms, where the bin size is 1 cGy. Quantitative measurements are listed in Table I. In XCAT1, the 4DCT leads to an accurate dose estimation, as expected due to the mostly regular breathing pattern. The kV recon curve is also overlapped with the ground truth, and the MV curve is shifted a little bit toward lower dose. Compared to the ground truth, the percentage errors in D95 are 0.093%, 0.11%, and 0.83% for 4DCT, kV and MV recons, respectively. Due to the irregular breathing pattern of XCAT2, the falling edge of the ground-truth curve of XCAT2 is shifted by approximately 2 Gy lower compared to the 4DCT curve. The kV recon curve generally overlaps with the ground truth well, and the falling edge of the MV curve is also closer to the ground truth around D95 area than that of the 4DCT. The percentage errors in D95 are 4.01%, 0.81%, and 1.75% for 4DCT, kV and MV recons, respectively. The lung volumes that receive more than 10 Gy (Lung V10 values) are around 4% of the total lung volume, which is very similar for both cases.
FIG. 7.
DVH plots for both XCAT phantoms (a) XCAT1 and (b) XCAT2. Areas around D95 are enlarged in the insets.
TABLE I.
Comparison of tumor D95 and lung V10 for XCAT phantoms.
| XCAT1 | XCAT2 | |||
|---|---|---|---|---|
| Tumor D95 (error) | Lung V10 (%) | Tumor D95 (error) | Lung V10 (%) | |
| 4DCT | 54.00 Gy (0.093%) | 4.48 | 54.00 Gy (4.01%) | 4.34 |
| Ground truth | 54.05 Gy | 4.44 | 51.92 Gy | 4.12 |
| kV recon | 53.99 Gy (0.11%) | 4.49 | 52.34 Gy (0.81%) | 4.01 |
| MV recon | 53.60 Gy (0.83%) | 4.39 | 51.01 Gy (1.75%) | 3.86 |
3.B. Patient study
A similar approach as that used for the XCAT phantoms was followed for the patient study, except that there is no ground truth for patient studies and only MV portal images were available during treatment delivery. The reconstructed tumor positions are illustrated in Fig. 8. A previous publication analyzed the accuracy of tumor localization based on MV images and our motion modeling approach.15 In that work, the tumor localization accuracy was found to be about 2 mm.
FIG. 8.

Respiratory motion and tumor location of the patient.
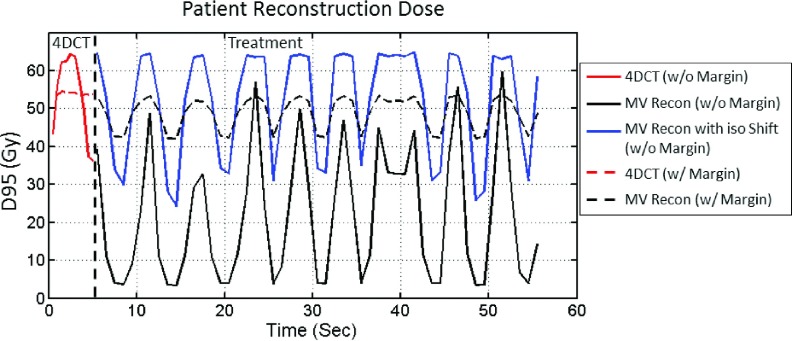
In this section, we simulate the delivery of two treatment plans. The first treatment plan has no setup margin, and the ITV is used as the target, similar to the XCAT experiments in this paper. The second treatment plan has a 7 mm uniform margin expansion added to the ITV to create the PTV. Each plan was normalized to provide a GTV D95 of 54 Gy based on the 4DCT calculation for that plan. The delivery of each plan was simulated using the reconstructed 3D fluoroscopic images from the MV images and compared to the dose estimated from 4DCT. In addition to these simulations, an additional simulation was run with the first treatment plan (no setup margin) where an isocenter shift was used to account for the 6.3 mm systemic shift of the tumor. The scaled instantaneous D95 values for the tumor at all timepoints are plotted in Fig. 9, and the 4DCT values are plotted as well for comparison.
FIG. 9.
Tumor scaled instantaneous D95 values of reconstructed dose distributions for patient.
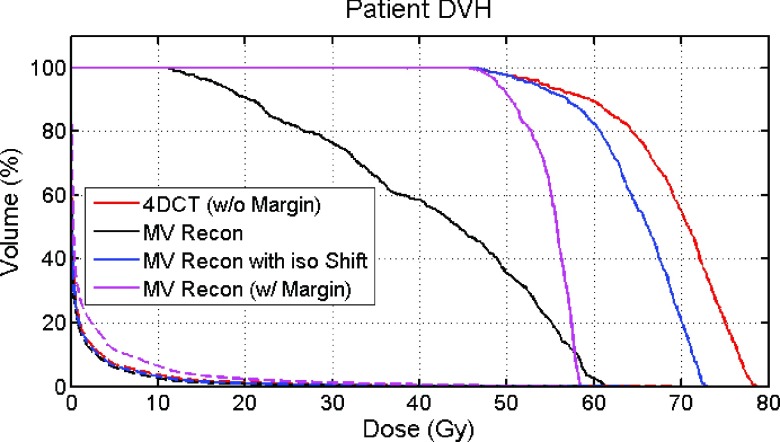
The DVH curves are shown in Fig. 10. For the first treatment plan with no margin, the GTV D95 is 16.46 Gy with no isocenter shift and 52.99 Gy when an isocenter shift is applied. The V10 values for lung are 3.47%, 3.32%, and 3.39%, respectively, for 4DCT dose, MV reconstruction dose, and MV reconstruction dose with isocenter shift. For the second treatment plan, with a 7 mm PTV margin and no isocenter shift, the GTV D95 is 48.87 Gy and the lung V10 is 7.78%.
FIG. 10.
DVH of the patient study. Dashed lines are for the lung DVH and solid lines are for the GTV DVH.
4. DISCUSSION
This work presented a novel approach to assess the actual delivered dose distribution for SBRT lung treatment while accounting for respiratory motion. Two XCAT phantoms were created to demonstrate the performance of our approach for both a regular breathing pattern and an irregular breathing pattern, and a patient case was investigated to examine the feasibility of applying this approach to patient data. (Though no ground truth was available to assess the accuracy of the patient example).
The magnitude of errors in dose accumulation can be affected by several factors. The accuracy of the deformable image registration techniques used to derive DVFs is a primary cause of error. Errors will also be larger in regions of steep dose gradients, where a small spatial error can lead to a large dosimetric error. In general, the error due to deformation in the calculation of D95 for our phantom studies was less than 2% for most timepoints, as shown in Fig. 5. It should be noted that XCAT phantoms used in this work have exact HU levels defined for each part of the anatomy, while patient images have more variation in HU levels, which could lead to deformation or dose accumulation errors.
The reconstruction doses of all timepoints generally follow the ground truth well, but lower D95 values are seen for both kV and MV reconstructions at some timepoints where tumor displacements in SI and/or AP directions are large. The MV reconstruction dose curves are generally lower than the ground truth and kV reconstruction dose, possibly due to better tumor visibility and localization in the kV projections. A large error in kV reconstruction dose around 46 s in Fig. 6(a) is observed. To investigate this discrepancy, we directly compared the ground truth (image and dose distributions) with the kV reconstruction image and the dose distribution. The error of tumor centroid location was only 2.32 mm, and the normalized root mean square error of the 3D dose distributions in the tumor volume was 4.17%. We believe that as the tumor was at the largest SI and AP displacements where the dose gradient is sharpest, small differences in the reconstruction image and dose distribution caused a large difference in the instantaneous D95 value.
We have not studied the angular dependence of reconstruction and dose calculation accuracy in this study. Both MV and kV projections were respectively simulated at a single view angle but used for dose calculation of all treatment beams. Previous studies by Li12 and Mishra14,15 have shown flat angular dependence of the volume reconstruction. However, there can be some angles where other objects in the path of the tumor, or a lack of contrast between the lung and tumor tissues, make it difficult to detect the tumor. In these cases, the proposed approach may still work well if some moving feature can be seen in the image, but if no moving features are discernible, the algorithm will lose accuracy. Further studies will follow.
As expected, for XCAT1 with a regular breathing pattern, the DVH derived from the 4DCT and that derived from our model both match the ground truth very well, and even the biggest error in MV recon is only 0.83%. Our model works well for the irregular breathing pattern of XCAT2, where the error is 0.81% for kV recon and 1.75% for MV recon, both of which are smaller than that of 4DCT (4.01%). The larger errors for the XCAT2 phantom originated from the limitation of the PCA-based motion model because in this study, the amplitude of breathing pattern during treatment is much larger than that obtained from 4DCT. Even though, our approach still produced a more accurate assessment of the actual delivered dose than that of 4DCT.
Our patient study demonstrated the feasibility of applying the methods to patient data, and produced results that seem reasonable, but a quantitative analysis of the dose estimates cannot be made due to the lack of ground-truth data. While the 4DCT images of XCAT phantoms are selected as subsets within a single breathing cycle that are free of motion-induced artifacts, the 4DCT of the patient study does show such artifacts. These artifacts associated with the sequential acquisitions at each couch position could potentially cause additional errors in motion modeling and dose calculation. Before the methods described in this work could be applied clinically, a more thorough study on the accuracy of dose estimation would be required, including measurements in a realistic physical phantom, and a larger patient study where different methods of delivered dose estimation could be compared. The methods would need to be investigated for other tumor locations, trajectories, and shapes, as well as for different treatment plans and beam configurations.
The major limitation of 4DCT-based motion model and dose assessment is that planning 4DCT might not be able to faithfully represent the patient anatomy during treatment since there might be tumor baseline drifting or interfractional anatomical or motion pattern changes, and this could lead to inaccuracy in dose assessment. The extension and impact of such uncertainties must be further investigated through clinical studies. We are also working on dose assessment using cone beam CT-based model, which can potentially account for these uncertainties in a clinical environment.
One concern of using intratreatment kV projections is cross-scatter from MV treatment beam, which may reduce the image quality of the kV image27 and bring reconstruction errors. This issue was not addressed in this study but can be resolved by using interleaved pulse sequences to control kV and MV beams.28
The proposed approach is theoretically valid for dose assessment of intensity-modulated treatments, such as IMRT and VMAT. While the kV imaging method should require no changes, MV-based reconstruction is likely to struggle if there is too little information in the EPID image. This approach could also find applications in proton treatments where accurate motion estimation is essential for treatment delivery and dose assessment.29
5. CONCLUSION
We have developed and performed initial testing on a method to estimate the 3D delivered dose distribution in lung SBRT treatment while accounting for deformation caused by respiration. This method estimates delivered dose using time-varying volumetric, or “3D fluoroscopic,” images generated from a 4DCT motion model and 2D projections acquired during treatment imaging. The initial performance of the method was measured in two XCAT phantom cases, and the feasibility of applying it to clinical data was tested in one patient case. While the initial results are promising, more extensive experiments are required to validate the accuracy of the method in patient data.
ACKNOWLEDGMENTS
The authors would like to express their gratitude to Dr. Seiko Nishioka of the Department of Radiology, NTT Hospital, Sapporo, Japan and Dr. Hiroki Shirato of the Department of Radiation Medicine, Hokkaido University School of Medicine, Sapporo, Japan for sharing the 3D patient tumor position dataset. This project was supported, in part, through a Master Research Agreement with Varian Medical Systems, Inc., Radiological Society of North America Research Scholar Grant Nos. RSCH1206 (J.H.L.) and NIH/NCI 1K99CA166186 (R.L.).
REFERENCES
- 1.Keall P. J., Mageras G. S., Balter J. M., Emery R. S., Forster K. M., Jiang S. B., Kapatoes J. M., Low D. A., Murphy M. J., Murray B. R., Ramsey C. R., Van Herk M. B., Vedam S. S., Wong J. W., and Yorke E., “The management of respiratory motion in radiation oncology report of AAPM task group 76,” Med. Phys. 33, 3874–3900 (2006). 10.1118/1.2349696 [DOI] [PubMed] [Google Scholar]
- 2.Mijnheer B., Beddar S., Izewska J., and Reft C., “In vivo dosimetry in external beam radiotherapy,” Med. Phys. 40, 070903 (19pp.) (2013). 10.1118/1.4811216 [DOI] [PubMed] [Google Scholar]
- 3.Berbeco R. I., Hacker F., Ionascu D., and Mamon H., “Clinical feasibility of using an EPID in cine mode for image-guided verification of stereotactic body radiotherapy,” Int. J. Radiat. Oncol., Biol., Phys. 69(1), 258–266 (2007). 10.1016/j.ijrobp.2007.04.051 [DOI] [PubMed] [Google Scholar]
- 4.Berbeca R. I., Hacker F., Zatwarnicki C., Park S.-J., Ionascu D., O’Farrell D., and Mamon H. J., “A novel method for estimating SBRT delivered dose with beam’s-eye-view images,” Med. Phys. 35, 3225–3231 (2008). 10.1118/1.2938514 [DOI] [PubMed] [Google Scholar]
- 5.Rottmann J., Aristophanous M., Chen A., Court L., and Berbeco R., “A multi-region algorithm for markerless beam’s-eye view lung tumor tracking,” Phys. Med. Biol. 55, 5585–5598 (2010). 10.1088/0031-9155/55/18/021 [DOI] [PubMed] [Google Scholar]
- 6.Aristophanous M., Rottmann J., Court L. E., and Berbeco R. I., “EPID-guided 3D dose verification of lung SBRT,” Med. Phys. 38, 495–503 (2011). 10.1118/1.3532821 [DOI] [PubMed] [Google Scholar]
- 7.van Elmpt W., Nijsten S., Petit S., Mijnheer B., Lambin P., and Dekker A., “3D in vivo dosimetry using megavoltage cone-beam CT and EPID dosimetry,” Int. J. Radiat. Oncol., Biol., Phys. 73, 1580–1587 (2009). 10.1016/j.ijrobp.2008.11.051 [DOI] [PubMed] [Google Scholar]
- 8.van Elmpt W., Petit S., De Ruysscher D., Lambin P., and Dekker A., “3D dose delivery verification using repeated cone-beam imaging and EPID dosimetry for stereotactic body radiotherapy of non-small cell lung cancer,” Radiother. Oncol. 94, 188–194 (2010). 10.1016/j.radonc.2009.12.024 [DOI] [PubMed] [Google Scholar]
- 9.McDermott L. N., Wendling M., Nijkamp J., Mans A., Sonke J., Mijnheer B. J., and van Herk M., “3D in vivo dose verification of entire hypo-fractionated IMRT treatments using an EPID and cone-beam CT,” Radiother. Oncol. 86, 35–42 (2008). 10.1016/j.radonc.2007.11.010 [DOI] [PubMed] [Google Scholar]
- 10.Hurwitz M., Williams C. L., Mishra P., Rottmann J., Dhou S., Wagar M., Mannarino E., Mak R. H., and Lewis J. H., “Generation of fluoroscopic 3D images with a respiratory motion model based on an external surrogate signal,” Phys. Med. Biol. 60, 521–535 (2015). 10.1088/0031-9155/60/2/521 [DOI] [PubMed] [Google Scholar]
- 11.Li R., Jia X., Lewis J. H., Gu X., Folkerts M., Men C., and Jiang S. B., “Real-time volumetric image reconstruction and 3D tumor localization based on a single x-ray projection image for lung cancer radiotherapy,” Med. Phys. 37, 2822–2826 (2010). 10.1118/1.3426002 [DOI] [PubMed] [Google Scholar]
- 12.Li R., Lewis J. H., Jia X., Gu X., Folkerts M., Men C., Song W. Y., and Jiang S. B., “3D tumor localization through real-time volumetric x-ray imaging for lung cancer radiotherapy,” Med. Phys. 38, 2783–2794 (2011). 10.1118/1.3582693 [DOI] [PubMed] [Google Scholar]
- 13.Li R., Lewis J. H., Jia X., Zhao T., Liu W., Wuenschel S., Lamb J., Yang D., Low D. A., and Jiang S. B., “On a PCA-based lung motion model,” Phys. Med. Biol. 56, 6009–6030 (2011). 10.1088/0031-9155/56/18/015 [DOI] [PMC free article] [PubMed] [Google Scholar]
- 14.Mishra P., Li R., James S. S., Mak R. H., Williams C. L., Yue Y., Berbeco R. I., and Lewis J. H., “Evaluation of 3D fluoroscopic image generation from a single planar treatment image on patient data with a modified XCAT phantom,” Phys. Med. Biol. 58, 841–858 (2013). 10.1088/0031-9155/58/4/841 [DOI] [PMC free article] [PubMed] [Google Scholar]
- 15.Mishra P., Li R., Mak R. H., Rottmann J., Bryant J. H., Williams C. L., Berbeco R. I., and Lewis J. H., “An initial study on the estimation of time-varying volumetric treatment images and 3D tumor localization from single MV cine EPID images,” Med. Phys. 41, 081713 (8pp.) (2014). 10.1118/1.4889779 [DOI] [PMC free article] [PubMed] [Google Scholar]
- 16.Zhang Y., Yin F.-F., Segars W. P., and Ren L., “A technique for estimating 4D-CBCT using prior knowledge and limited-angle projections,” Med. Phys. 40(12), 121701 (16pp.) (2013). 10.1118/1.4825097 [DOI] [PubMed] [Google Scholar]
- 17.Sempau J., Wilderman S. J., and Bielajew A. F., “DPM, a fast, accurate Monte Carlo code optimized for photon and electron radiotherapy treatment planning dose calculations,” Phys. Med. Biol. 45, 2263–2291 (2000). 10.1088/0031-9155/45/8/315 [DOI] [PubMed] [Google Scholar]
- 18.Williams C. L., Mishra P., Seco J., James S. St., Mak R. H., Berbeco R. I., and Lewis J. H., “A mass-conserving 4D XCAT phantom for dose calculation and accumulation,” Med. Phys. 40, 071728 (10pp.) (2013). 10.1118/1.4811102 [DOI] [PMC free article] [PubMed] [Google Scholar]
- 19.Mishra P., James S. St., Segars W. P., Berbeco R. I., and Lewis J. H., “Adaptation and applications of a realistic digital phantom based on patient lung tumor trajectories,” Phys. Med. Biol. 57, 3597–3608 (2012). 10.1088/0031-9155/57/11/3597 [DOI] [PMC free article] [PubMed] [Google Scholar]
- 20.Shirato H., Oita M., Fujita K., Watanabe Y., and Miyasaka K., “Feasibility of synchronization of real-time tumor-tracking radiotherapy and intensity-modulated radiotherapy from viewpoint of excessive dose from fluoroscopy,” Int. J. Radiat. Oncol., Biol., Phys. 60, 335–341 (2004). 10.1016/j.ijrobp.2004.04.028 [DOI] [PubMed] [Google Scholar]
- 21.Gu X., Pan H., Liang Y., Castillo R., Yang D., Choi D., Castillo E., Majumdar A., Guerrero T., and Jiang S. B., “Implementation and evaluation of various demons deformable image registration algorithms on a GPU,” Phys. Med. Biol. 55, 207–219 (2010). 10.1088/0031-9155/55/1/012 [DOI] [PMC free article] [PubMed] [Google Scholar]
- 22.Seco J., Sharp G. C., Wu Z., Gierga D., Buettner F., and Paganetti H., “Dosimetric impact of motion in free-breathing and gated lung radiotherapy: A 4D Monte Carlo study of intrafraction and interfraction effects,” Med. Phys. 35, 356–366 (2008). 10.1118/1.2821704 [DOI] [PMC free article] [PubMed] [Google Scholar]
- 23.Nohadani O., Seco J., and Bortfeld T., “Motion management with phase-adapted 4D-optimization,” Phys. Med. Biol. 55, 5189–5202 (2010). 10.1088/0031-9155/55/17/019 [DOI] [PMC free article] [PubMed] [Google Scholar]
- 24.Seco J., Panahandeh H. R., Westover K., Adams J., and Willers H., “Treatment of non-small cell lung cancer patient with proton beam-based stereotactic body radiotherapy: Dosimetric comparison with photon plans highlands importance of range uncertainty,” Int. J. Radiat. Oncol., Biol., Phys. 83(1), 354–361 (2012). 10.1016/j.ijrobp.2011.05.062 [DOI] [PubMed] [Google Scholar]
- 25.James S. St., Seco J., Mishra P., and Lewis J. H., “Simulations using patient data to evaluate systematic errors that may occur in 4D treatment planning: A proof of concept study,” Med. Phys. 40, 091706 (7pp.) (2013). 10.1118/1.4817244 [DOI] [PubMed] [Google Scholar]
- 26.Spadea M. F., Verburg J. M., Baroni G., and Seco J., “The impact of low-Z and high-Z metal implants in IMRT: A Monte Carlo study of dose inaccuracies in commercial dose algorithms,” Med. Phys. 41, 011702 (10pp.) (2014). 10.1118/1.4829505 [DOI] [PubMed] [Google Scholar]
- 27.Fledelius W., Worm E., Hoyer M., Grau C., and Poulsen P. R., “Real-time segmentation of multiple implanted cylindrical liver markers in kilovoltage and megavoltage x-ray images,” Phys. Med. Biol. 59, 2787–2800 (2014). 10.1088/0031-9155/59/11/2787 [DOI] [PubMed] [Google Scholar]
- 28.Giles W., Bowsher J., Li H., and Yin F.-F., “Interleaved acquisition for cross scatter avoidance in dual cone-beam CT,” Med. Phys. 39(12), 7719–7728 (2012). 10.1118/1.4768160 [DOI] [PubMed] [Google Scholar]
- 29.Koybasi O., Mishra P., James S. St., Lewis J. H., and Seco J., “Simulation of dosimetric consequences of 4DCT-based motion margin estimation for proton radiotherapy using patient tumor motion data,” Phys. Med. Biol. 59, 853–867 (2014). 10.1088/0031-9155/59/4/853 [DOI] [PubMed] [Google Scholar]


