Abstract
Discovering small-molecule chemical probes of protein function has great potential to elucidate biological pathways and to provide early-stage proof-of-concept for target validation. Discovery of such probes therefore underpins many of the chemical biology and drug discovery efforts in both academia and the pharmaceutical industry. The process generally begins with screening small molecules to identify bona fide “hits” that bind non-covalently to a target protein. This chapter is concerned with the application of biophysical and structural techniques to small-molecule ligand screening, and with the validation of hits from both structural (binding mode) and energetic (binding affinity) stand-points. The methods discussed include differential scanning fluorimetry (thermal shift), fluorescence polarization (FP), surface plasmon resonance, ligand-observed NMR spectroscopy, isothermal titration calorimetry, and protein X-ray crystallography. The principles of these techniques and the fundamental nature of the observables used to detect macromolecule-ligand binding are briefly outlined. The practicalities, advantages, and disadvantages of each technique are described, particularly in the context of detecting weak affinities, as relevant to fragment screening. Fluorescence-based methods, which offer an attractive combination of high throughput and low cost are discussed in detail. It is argued that applying a combination of different methods provides the most robust and effective way to identify high-quality starting points for follow-up medicinal chemistry and to build structure–activity relationships that better inform effective development of high-quality, cell-active chemical probes by structure-based drug design.
Keywords: Fragment screening, Biophysical techniques, Differential scanning fluorimetry, Thermal shift, Fluorescence polarization, Calorimetry, NMR spectroscopy, X-ray crystallography, Surface plasmon resonance
1 Introduction
The discovery and design of small molecules that modulate or probe biological systems motivates much of the present research in chemical biology and drug discovery. The spatial, temporal, and dose-dependent controls of biomolecular activity that are afforded by small molecules have advantages for systematic studies of complex biological processes in comparison to the more traditional gene knockouts or RNAi approaches (1, 2). Potent, selective, and cell-penetrant small-molecule binders, often referred to as “chemical probes,” provide powerful tools to aid elucidation of protein function inside the cell (3-5). In parallel, recent advances in our molecular understanding of many diseases have revealed many new potential targets for small-molecule intervention, significantly expanding the druggable genome (6, 7). The ability to rapidly and robustly discover lead compounds against this increasing range of targets would provide starting points for drug discovery that would significantly impact on our ability to develop the next generation of medicines for clinical application. The identification of biologically active small molecules is however expensive and highly demanding in terms of resources and know-how, inevitably requiring multidisciplinary approaches at the interface of chemistry and biology.
Since the late 1990s within the pharmaceutical industry, and in the past decade in academic and research institutions, significant investment and efforts have focused on high-throughput screening (HTS) of large library collections (>100,000 compounds). Typically, highly robotized complex bioassays are set up using the purified target protein and required labels or assay-components, or as target-based whole cell screens. Hits are identified that exhibit a statistically significant level of activity or inhibition at relatively low concentration (typically 10–100 μM) (8–11). Although these approaches have proven successful at identifying biologically active compounds, direct binding is rarely measured and the assays are consequently known to be significantly prone to artifacts that arise, e.g., from compound aggregation, interference of the compound with the assay or off-target effects (12–14). Significant hit triage efforts are therefore required to deconvolute the true mechanism that underpins the observed response in the assay. It is becoming increasingly apparent that hits identified from these high-throughput screens rarely behave as genuine, reversible small-molecule binders for a given protein target.
More recently, however, significant advances in analytical, biophysical and structural techniques for monitoring weak-to-moderate binding affinities of protein–ligand interactions have facilitated the development and success of fragment-based drug discovery. In fragment screening, compared to HTS, smaller libraries (usually ~1,000 and rarely >10,000) of compounds of relative small size (MW usually <300 Da) are screened at higher concentration (usually >0.5 mM) for direct, non-covalent binding to the target protein (15, 16). It is now widely accepted that bona fide binding hits, even if of low complexity and of weak affinities, represent high quality, attractive points for further medicinal chemistry optimization. More information on the concepts and applications of fragment-based drug discovery are available in several seminal papers and recent reviews (17-25).
One of the results of these recent developments is that fragment screening is now firmly established as an early-stage lead discovery approach, very often performed in parallel with HTS against the target of interest. A second corollary to this approach is that biophysical and structural methods, which were previously only used for quality controls or during the late stages of lead optimization, are now being increasingly used for screening and validation during the early stages of the discovery process. Albeit typically of lower throughput than bioassays used in HTS, biophysical and structural techniques are highly information-rich and thus very valuable early in the development process (15, 16, 26, 27). A number of advantages of biophysical and structural techniques over the complex or indirect bioassays used for HTS provide strong motivation for their increased use:
They allow a direct measurement of binding, so are less prone to artifacts due to compound aggregation and interference with the assay;
They are generally applicable to any protein target class, specifically they do not require an active enzyme or knowledge of the protein’s function;
They enable detection and characterization of low affinities, so are particularly amenable for screening fragment-libraries;
Many biophysical techniques are available, each with different strengths and weaknesses, and it is valuable to apply multiple methods that monitor different “observables”;
Quantitative measurements of direct binding (Kd) or indirect dose–response effects (IC50) provide reliable ways to develop structure-activity relationships early in the drug or probe development process.
The structure of the protein–ligand complex or at least some details on the location of the binding site and the binding mode of the compound can be obtained. This information is often critical for subsequent optimization and development of the compounds.
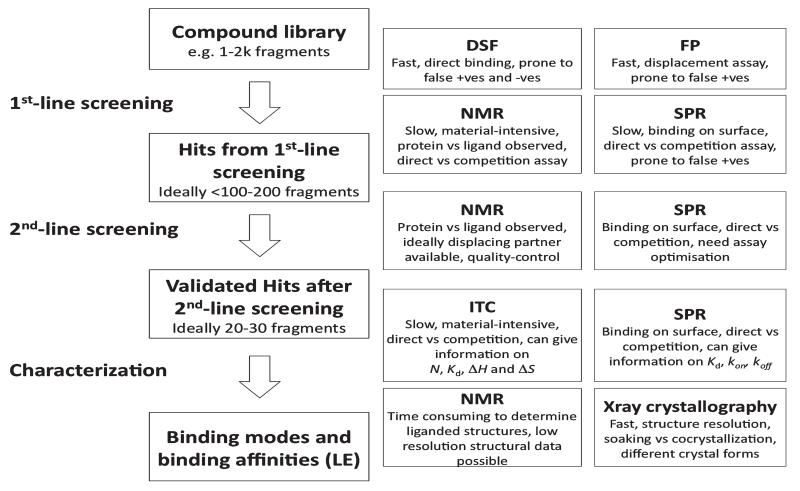
A panel of biophysical techniques—fluorescence-based thermal denaturation/differential scanning fluorimetry (DSF) and fluorescence polarization (FP) assays, isothermal titration calorimetry (ITC), nuclear magnetic resonance spectroscopy (NMR), surface plasmon resonance (SPR), and protein X-ray crystallography (PX)—can be used to monitor and characterize protein–ligand interactions (Fig. 1). Here, I will briefly review the principles of their operation, the advantages and disadvantages of each technique, and the practicalities of their utilization in the context of screening, with a focus on the specific applications of these methods to fragment-based ligand discovery.
Fig. 1.
Flowchart of a possible strategy for compound screening, validation, and characterization using biophysical techniques
1.1 Differential Scanning Fluorimetry (Thermal Shift) Assay
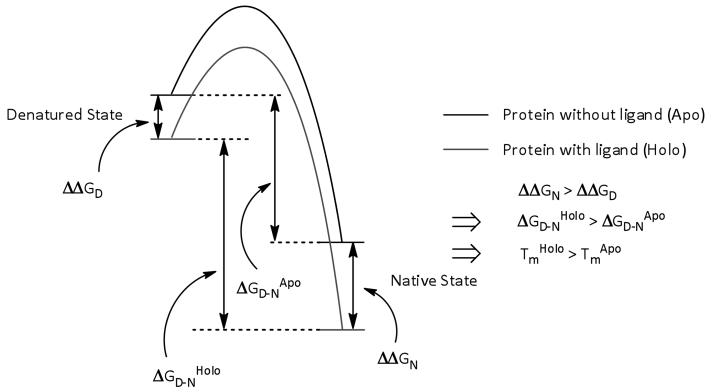
Proteins exist in thermodynamic equilibrium between multiple conformational states and the binding of a small-molecule to the protein will alter the populations of these states. In the simplest case we can consider a two-state system where there is only a folded (native) and an unfolded (denatured) state (Fig. 2). The population of the unfolded state of a protein increases as the temperature of the solution is increased. Usually, specific binding of a small-molecule to a structurally defined site of the native state of a protein will stabilize the native state more than any nonspecific interaction with the denatured state and hence increase the free energy difference between the two states, ΔGD − N (Fig. 2). The effect of this will be to increase the population of the native state at all temperatures and will result in a shift of the melting temperature of the protein (Tm), the temperature at which there is 50 % denaturation, to a higher value. Consequently, by measuring Tm in the presence and absence of a potential ligand it is possible to detect any protein–ligand binding.
Fig. 2.
Energy profile diagram showing protein stabilization by ligand binding. Stabilization of the native, folded state by specific binding of a ligand results in a greater free energy difference between native and denatured states (ΔGD − N) and a higher proportion of folded protein at all temperatures
There are several long-established ways of measuring the Tm of a protein, e.g., through changes in its secondary structure content monitored by circular dichroism or infra-red spectroscopy, through monitoring the heat of the transition by differential scanning calorimetry, or through monitoring the temperature dependent changes in intrinsic fluorescence of a protein due to increased solvent exposure of tryptophan residues in the unfolded state. However, another approach, much better suited to HTS applications, is the so-called “thermal shift” or “thermofluor” DSF assay (28–31).
This, now popular, approach monitors the temperature dependence of the fluorescence signal of an environmentally sensitive fluorescent dye that binds preferentially to the denatured state of a protein. SYPRO Orange is a commercially available dye that is commonly used to measure the change between native and denatured states of a protein. The dye’s fluorescence is quenched in aqueous solution. However, upon binding to a hydrophobic surface a fluorescent signal is emitted. Upon denaturation, the hydrophobic core of the protein becomes solvent exposed and hence the fluorescent dye now has a much larger hydrophobic surface area to bind to relative to a native state protein. Hence by monitoring the fluorescent signal, it is possible to determine the extent of denaturation. Examination of differences in the temperature dependent fluorescence profile of protein plus dye in the presence and absence of a potential ligand may reveal a change in Tm indicative of binding.
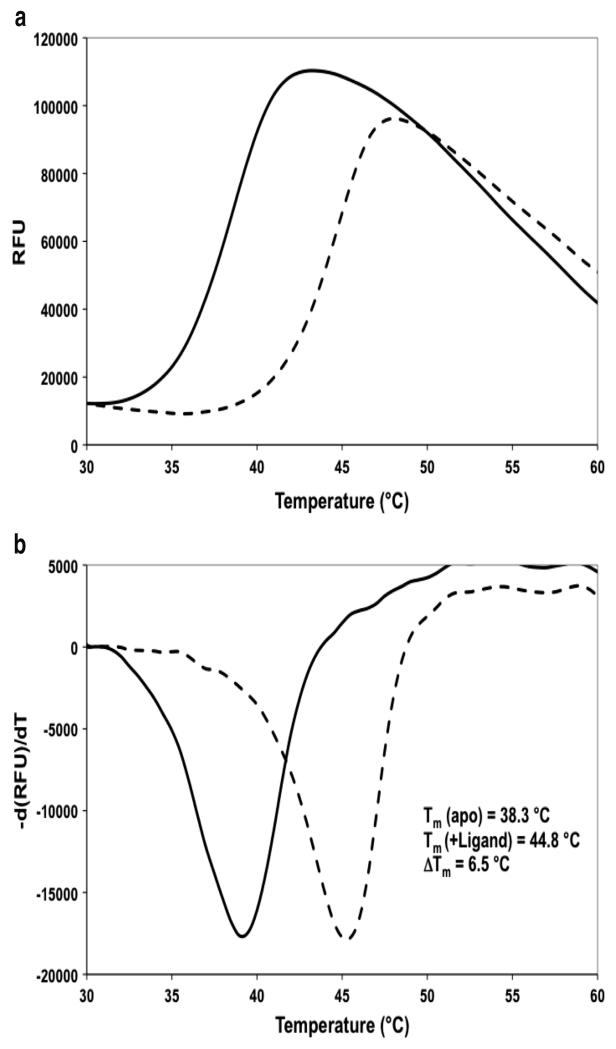
A plot of fluorescence signal against temperature should give a sigmoidal plot (Fig. 3a). The melting temperature is determined by the point of inflection of this curve. This can most easily be assessed by plotting the derivative of the fluorescent signal against temperature (Fig. 3b).
Fig. 3.
Monotoring differential melting behavior of a protein and a protein–ligand complex by fluorescence. (a) Typical DSF plots of a protein in the absence (solid line) and presence (dashed line) of a binding ligand. (b) The derivative of the fluorescent signal is plotted against temperature. The minimum of this derivative plots allow convenient identification of the melting temperatures Tm, from which a thermal shift ΔTm can be measured. Data are shown for the binding of a small molecule inhibitor against the enzyme pantothenate synthetase from Mycobacterium tuberculosis (50)
DSF is being extensively used in high-throughput assays for small-molecule hit identification as it can be easily implemented in microplate formats using a real-time thermal cycler instrument (see Subheadings 2.1 and 3.1 for details).
1.2 Fluorescence Polarization Assay
Measurements of FP and the related anisotropy reveal information on molecular mobility, which is dependent on size and shape. Specifically, the extent of polarization depends on the rotational correlation time of the fluorophore. Processes that significantly alter the rate of rotation of a fluorophore can be monitored through changes in polarization. Such process include the binding of a fluorescent ligand to a protein, in which case the ligand will rotate much more slowly, or changes in the shape or oligomeric state of an intrinsically fluorescent or fluorescently labeled protein induced by ligand binding. In FP, plane-polarized light is used to excite a fluorophore. Experimentally, the degree of polarization is determined from measurements of fluorescence intensities parallel (FII) and perpendicular (F⊥) to a plane, and can be expressed in terms of FP (P) or anisotropy (r):
| (1) |
| (2) |
P and r are both relative quantities with little dependence on dye concentration or fluorescence intensity changes. Consequently, polarization-based readouts are less dye dependent and less susceptible to environmental interferences, such as pH changes, than assays based on fluorescence intensity measurements. The magnitude of both P and r increases as the rotation of the fluorophore slows (see Note 1).
Most frequently, an intrinsically fluorescent ligand is used or a fluorescent dye is attached to small, rapidly rotating molecules, e.g., peptides targeting a protein–protein interface (see Subheading 2.2 for details) (32). When these fluorescent probes are free in solution, rapidly rotating in the absence of their target protein, the initially photoselected orientational distribution becomes randomized prior to emission, resulting in low FP. Conversely, binding of the fluorescent probe to a large, slowly rotating protein maintains much of the high initial FP. FP therefore provides a direct readout of the extent of binding of a fluorescent probe to proteins and other biopolymers, providing a robust assay for screening small molecules that compete with the probe for the same binding site.
Since not all small molecules are fluorescent, FP assays for screening compound libraries tend to be carried out in a competitive inhibition mode by titrating different concentrations of small molecules against a sample containing standard concentrations of protein and a fluorescent-version of a known ligand to generate a dose–response curve, which can be used to determine an IC50 (and through back-calculation a Kd, see Subheading 3.2.2 for details) (33). The choice of these fixed concentrations of target protein and fluorescent ligand throughout the assay is very important and should be optimized taking into account several parameters (see Subheading 3.2.1 for details). This competition mode is particularly useful for screening as the small molecules to be tested do not themselves need to be fluorescent and the screen is selective for binding mechanisms which affect the binding of the known fluorescent ligand either by direct competition or allosterically.
1.3 Isothermal Titration Calorimetry
The strength of ITC lies in its ability to measure directly the heat associated with a chemical reaction in solution. Because measurable heat uptake or release accompanies almost all reactions, ITC is broadly applicable to characterization of protein–ligand interactions and relatively simple to carry out, as no fluorescent labels or modification of the protein or ligand for surface attachment are required. ITC is also the only method currently able to directly measure the enthalpy, ΔH, of a ligand binding to a protein (34).
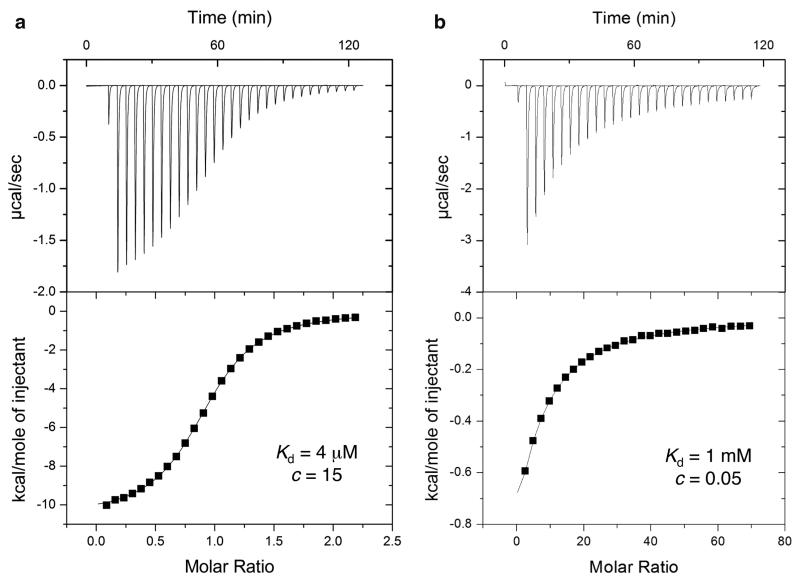
An ITC experiment proceeds by injection of a solution containing one component of the reaction (usually the ligand) into a temperature controlled stirred-cell containing the other component. In the first few injections most of the ligand will bind to the protein, allowing measurement of the enthalpy, ΔH. As the experiment proceeds and the protein saturates with ligand the signal diminishes allowing the estimation of the affinity and stoichiometry. At the end of the titration full saturation is achieved and mainly the background heat of dilution is observed (Fig. 4a).
Fig. 4.
Characterization of protein–ligand binding using ITC. Typical calorimetric titrations to study high affinity (a) and low affinity (b) interactions (i.e., high c and low c conditions, respectively). Low c curves are frequently observed with low affinity fragments. Data are shown for the binding of ATP (left) and of a small molecule fragment (right) against the enzyme pantothenate synthetase from Mycobacterium tuberculosis (50)
Analysis of the integrated heats from each of the injections can determine the association constant (Ka), the enthalpy of binding (ΔH) and the stoichiometry (n). The free energy change due to binding, ΔG, is directly related to Ka by the equation ΔG = −RT ln(Ka), while the entropy of binding (ΔS) can be directly calculated using the thermodynamic equation ΔG = ΔH − TΔS.
A critical parameter that determines the shape of the binding isotherm is the so-called c-value,
| (3) |
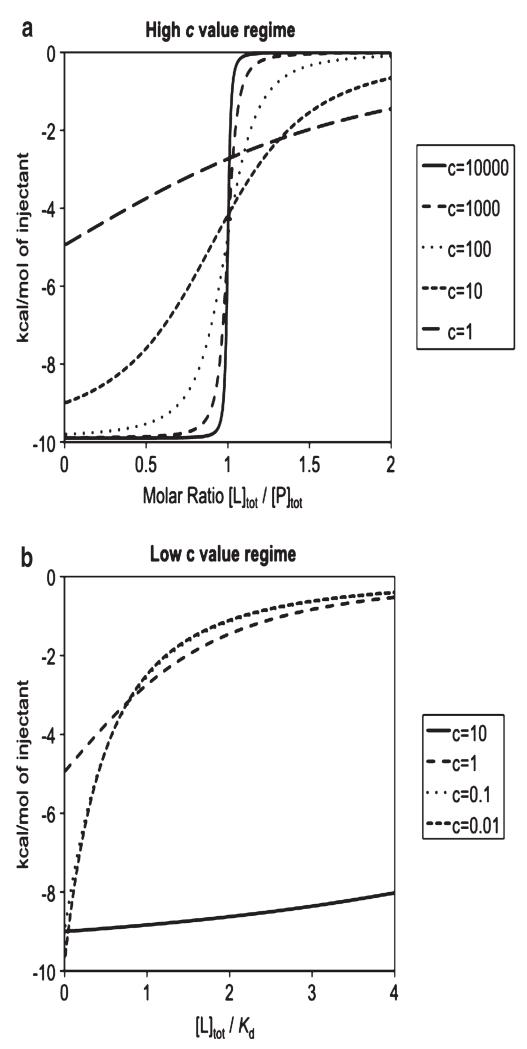
where n is the stoichiometry and PT the total protein concentration. There are two distinct “regimes” that we should consider separately: high c values (c > 10, see Fig. 4a) and low c values (c < 10), see Fig. 4b) (35). A comparison of how the different titration curves are predicted based on the different c values conditions is shown by the simulations in Fig. 5. The low affinity, low c, regime is much more common for fragment binding. The design and analysis of ITC experiments in both regimes are considered in detail in the Chapter 4.
Fig. 5.
Experimental design for ITC under (a) high and (b) low c value regimes, showing typical sigmoidal and hyperbolic curves, respectively. The resulting ΔH (kcal/mol) is plotted vs. the molar ratio of total ligand and protein concentrations (a) and the ratio between total ligand concentration and the dissociation constant (b). The simulated curves assume a ΔH of −10 kcal/mol except the last two curves in panel b (c = 0.1 and 0.01) in which case the curves are magnified by factors of 10 and 100, respectively, to emphasize their similar curved shapes (35)
1.4 Surface Plasmon Resonance
Surface plasmon resonance (SPR) is an optical technique based on the transfer of light (electromagnetic) energy to electrons in a thin layer of metal in contact with a solution. Gold is the preferred metal as it is compatible with a number of linking chemistries and will not oxidize over time.
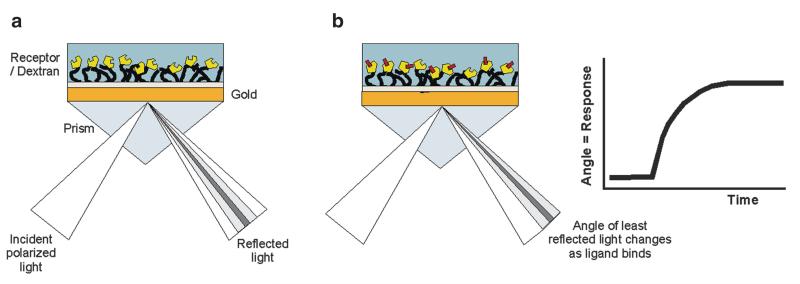
In the standard SPR set up, a beam of polarized monochromatic light is shone through a prism at a thin-layer of gold coating one surface of the prism. The prism causes the light to be reflected at the gold-coated surface. However, light is not reflected precisely at the prism-gold junction, but it (or its electromagnetic field) penetrates some distance into and beyond the gold (in a phenomenon called evanescent wave formation). At a particular angle of incidence, absorption of some of the light by the electrons in the gold excites charged density waves, called “surface plasmons,” which propagate along the metal surface. This absorption is maximum where transfer of momentum matches that of the plasmons. At this resonance condition, i.e., at a specific incident angle, the intensity of the reflected light is reduced sharply. The evanescent wave extends ~100–200 nm into the solution and decays exponentially away from it. Consequently, if the gold layer is sufficiently thin the resonance condition/angle depends not only on the metal, but also on the properties (refractive index) of the medium just above the gold surface. SPR is thus highly sensitive to changes in the environment close to the gold—aqueous solution interface, while processes in bulk solution have no influence on the angle of minimum reflectance. A change in the refraction index at the surface of the sensor (due for example to something binding near the surface) may hence be monitored as a shift in the resonance angle (36).
In SPR, a “chip” is used which contains a glass surface that is coated by a thin layer of gold, required for the SPR response. A dextran matrix is covalently attached via a linker layer on the solution side of the gold film, to allow immobilization of receptor molecules, e.g., the protein on the surface (Fig. 6). When an analyte for example a ligand in solution binds to the protein the refractive index near the surface changes and an SPR shift is detected, which can be monitored in real time in a so-called “sensogram.” Since the change in refractive index, i.e., the SPR signal, is proportional to the mass bound at the surface, it is possible to measure the affinity and kinetic rate constant of the interaction.
Fig. 6.
Operation of a surface plasmon resonance biosensor. (a) The glass of the sensor chip is coated with a thin layer of gold, a dextran matrix is attached via a linker layer to the gold and receptors are cross-linked to the dextran. Light is reflected from the surface of a sensor chip and resonant absorption is seen at an angle dependent on the quantity of material bound at the surface. (b) When an interaction occurs, a shift in the resonant angle is observed that is proportional to the amount of material bound. A plot of resonance signal vs. time, the sensogram, can be monitored in real time
Immobilization of the receptor molecule to the sensor surface is required and is of primary importance to the design of a successful assay. The coupling method must be efficient, must produce a highly stable association (to prevent signal drift) and must allow control of the amount of material immobilized (see Note 2).
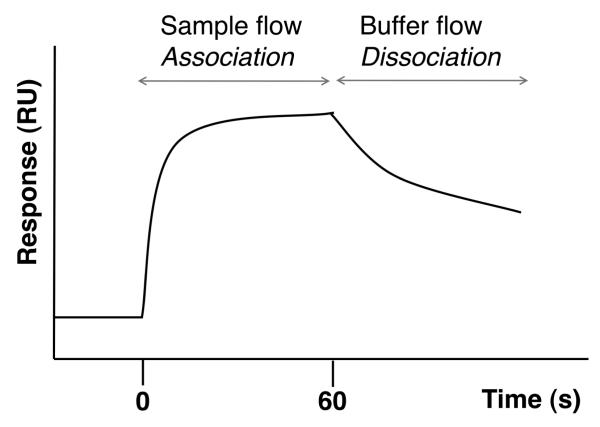
Once the protein has been attached to the surface, the partner ligand can be flowed through the chip, and if a binding event occurs it can be directly monitored in a sensogram. A schematic representation of a typical sensogram trace is shown in Fig. 7 where signal increases until the protein binding sites are saturated, subsequently buffer without ligand is flowed over the chip and ligand is progressively removed. Both the on-rate and off-rate constants of the binding process can be determined and their ratio gives an accurate estimate of affinity. The ability to characterize slow off-rate ligands is particularly useful during the optimization of the pharmacokinetic properties of lead compounds and drugs.
Fig. 7.
Typical binding sensogram observed with an SPR biosensor. After baseline equilibration, at t = 0 s a solution containing one of the binding partners (e.g., a small molecule ligand) is flowed over the surface to which is attached the other binding partner. As the ligand binds to the protein, an increase in signal is observed due to the increase in material at the surface. Analysis of this part of the binding gives the observed rate constant (kobs), from which the association rate constant of the interaction (kon) is obtained, if the ligand concentration is known, using the equation kobs = kon[L] + koff. The signal plateaus once equilibrium has been established, then (here at t = 60 s) buffer replaces the ligand solution and the protein–ligand complex starts dissociating. Analysis of this part of the binding curve gives the dissociation rate constant (koff). The response level at equilibrium can yield the concentration of active ligand in the sample. The binding affinity can be calculated from the ratio of the rate constants (Kd = 1/Ka = koff/kon). A pulse of a regeneration solution (e.g., high salt, low pH, etc.) is then typically used to disrupt the non-covalent interaction and regenerate the surface. These types of curves are typically recorded over a range of ligand concentrations (affinity can also be determined from the ligand concentration dependence of the response), and often over a range of different temperatures, to allow for reliable determination of the kinetic and thermodynamic parameters
Advances in instrument sensitivity and experimental design have allowed SPR to be established as a front line method for primary fragment screening; however, nonspecific effects due to the use of high concentrations of small molecules required to studying weak affinities of fragments can often be seen with this assay. Experimental details for small-molecule screening are given in the Chapter 6 including considerations particular to fragments.
1.5 Nuclear Magnetic Resonance Spectroscopy
NMR spectroscopy is a powerful technique to study protein–ligand and protein–protein interactions in a solution environment, and is being used extensively in the pharmaceutical industry for hit identification. Different experimental formats have been used which are based on observing either the NMR signals of the ligand or the protein. Improvements in instrumentation and advances in automation are facilitating rapid screening of increasingly large compound libraries (37).
Binding equilibria modulate both the frequency and width of NMR spectral lines in response to the rate of “chemical exchange” between the free and bound states of the ligand and receptor. Observation of these modulated spectral parameters forms the basis for all NMR screening experiments.
In a two-state equilibrium, ligand and protein molecules will exist in either a free (L, P) or complexed (PL) state. In the free state, both protein and ligand retain their intrinsic NMR parameters (e.g., chemical shifts, relaxation rates, translational and diffusion coefficients). In each other’s presence, the mutual binding affinity of ligand and protein drives an exchange process that toggles both sets of molecules between the free and complexed states.
Under these conditions, the ligand transiently adopts NMR parameters characteristic of the typically much larger receptor. Alternatively, from the receptor’s perspective, the ligand transiently perturbs the binding site microenvironment, and may alter the distribution of conformations sampled by the receptor molecules. In either case, the exchange modulates the NMR parameters of both molecules.
Since the ligand bound state is thermodynamically favored, the dissociation rate koff is slower than association and, thus, koff is the important limiting factor in defining the kinetics of the chemical exchange process. There are two distinct cases:
-
(a)
Exchange is fast on the NMR time scale. Many cycles of protein–ligand formation and dissociation occur on the “NMR timescale,” i.e., the reciprocal of the frequency differences of signals in the bound and free states. We refer to this as fast-exchange regime. This is the common scenario for moderate to weak affinity ligands, e.g., with a koff > 102 s −1 (and typically a corresponding Kd > 100 μM), such as fragments.
-
(b)
The average lifetime of the protein–ligand complex is much longer than the NMR timescale, typically this may correspond to koff < 10 s −1 and Kd < 10 μM. This is the so-called slow-exchange regime.
Under the fast exchange regime, exchange-modulated NMR parameters can be described as simple sums. Therefore, a general NMR parameter becomes the simple fractional average of its value in the bound (fbound) and free (ffree) populations:
| (4) |
Observed differences between and provide a signature of binding and indicate a hit in a NMR screen based on that parameter (38).
NMR parameters that are employed as observables for ligand binding experiments in fragment screening include chemical shifts, relaxation times (see Note 3), and the nuclear overhauser effect (NOE).
1.5.1 Protein-Observed NMR Experiments
NMR spectroscopic techniques were amongst the first to be applied for fragment screening due to their flexibility and ability to detect weak interactions. Fesik and colleagues at Abbott Laboratories pioneered Structure–Activity Relationships (SAR) by NMR spectroscopy, in which perturbations of the two-dimensional 1H-15N HSQC (Heteronuclear Single Quantum Correlation) spectrum of a protein caused by fragment binding are used to obtain structure and affinity data (17). They demonstrated for the first time that this information could be used in a medium throughput format to detect hits and suggest ways to link them to form high-affinity leads. One of their first examples was the discovery of potent non-peptidic inhibitors of stromelysin, a zinc-dependent matrix metalloprotease and an important drug target (39).
This protein-based approach is readily implemented for screening libraries of compounds usually by adding several small molecules to the protein at a time, in order to improve throughput, and subsequently identifying hits by deconvoluting the positive mixtures. However, several drawbacks are associated with protein-based NMR methods.
-
(a)
The size of the protein target should be <~40 kDa as larger proteins have weaker and overlapping NMR signals.
-
(b)
A high concentration of protein is required (typically >0.1 mM).
-
(c)
The protein needs to be labeled with isotopes, usually 15N and often 13C and/or 2H.
-
(d)
By measuring the changes in protein chemical shifts upon titrating a binding ligand it is possible to measure the Kd; however, this is only straightforward for binding of low-affinity ligands (fast-exchange and Kd > [P]).
-
(e)
Some information on the ligand binding site can be obtained; however, this requires the peaks from the two-dimensional protein NMR spectra to be assigned (which can be a lengthy process).
1.5.2 Ligand-Observed NMR Spectroscopic Experiments
Most of the above limitations are in part addressed by NMR spectroscopic techniques that observe the signal of the ligand instead of the protein. Ligand-observed NMR experiments are generally faster, require less protein and enable direct identification of small molecule binders using simple one-dimensional spectra. These ligand-detected approaches render the molecular weight of the target protein irrelevant, making them of general applicability. Actually, in many ligand-observed NMR experiments the larger the protein target the better because complexation with larger proteins causes greater changes in the NMR parameters, and only very small proteins (MW < 10 kDa) may be problematic. Compounds can still be screened in mixtures, and, in my own experience, this works best with no more than three or four at a time in order to minimize their signal overlap (see Note 4) (40). Within mixtures, individual small molecules can be identified and binding characterized provided their chemical shifts in solution are known. NMR spectra of the ligand or the ligand-mixture are recorded in the presence of the protein and compared to control spectra recorded in the absence of the protein.
Most ligand-based NMR experiments that are employed in screening exploit the efficient transfer of the information on the ligand’s bound state to the free ligand for detection in the fast-exchange regime. These experiments are typically carried out with LT/PT > 10 (so the fraction of free ligand is always higher than that of bound ligand), and the binding compounds usually have Kd > 10 μM. The experimental conditions for fragment-based NMR screening are thus well suited to such fast exchange experiments.
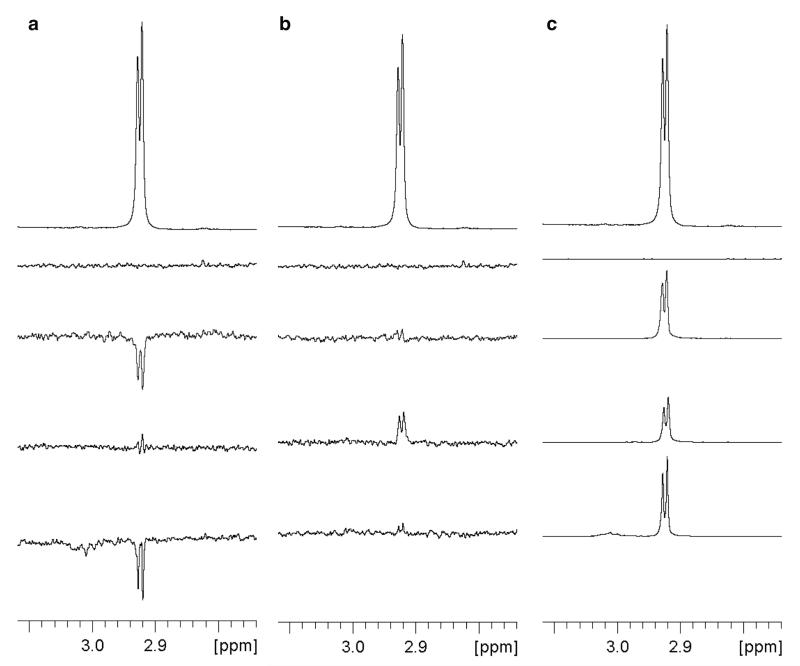
Ligand-based NMR experiments have been described which take advantage of all these properties. Relaxation-edited NMR methods exploit the much faster signal relaxation (decay) of the bound ligand (41). Other techniques rely on the observation of change of sign of NOEs peaks for small organic molecules in the presence of the protein to detect binding. Two commonly used experiments are saturation transfer difference (STD) and Water-LOGSY. STD relies on transfer of magnetization (signal) directly from the protein to the bound ligand complex, e.g., by exciting the aliphatic methyl group region of the protein (Ala, Val, Leu, Ile) the NOE will result in transfer of magnetization to nearby protons of any bound ligand (42). In contrast, in WaterLOGSY the magnetization is transferred indirectly via water molecules at the binding site (43). Examples of the observations of ligand binding via these methods are shown in Fig. 8—in each case careful controls experiments are required to avoid false positive results, for example by repeating the experiments in the presence of a competitor ligand of known binding mode and affinity to provide some information on the specificity of the binding interaction. Further details can be found in the Chapter 14.
Fig. 8.
Identification of ligand binding to a protein using 1D 1H ligand-observed NMR spectroscopy. (a) WaterLOGSY, (b) STD, and (c) relaxation-edited binding and displacement experiments are shown. From top to bottom: normal 1H spectrum of ligand in the absence of protein; a control spectrum of buffer alone; ligand in the absence of protein; ligand in the presence of protein; ligand in the presence of protein and a known high affinity binder (a “displacer”). The spectra show a doublet from a methyl group adjacent to an amide NH of a fragment ligand binding to the human bromodomain of BAZ2B protein (MW = 13.6 kDa, which is on the lower limit for ligand-based NMR techniques), displaced by a high-affinity peptide H3Kac14 (49). The restoration of a spectrum similar to ligand alone by addition of the displacer demonstrates that the ligand binds at the same site. A subsequent X-ray crystal structure of the protein-fragment complex demonstrated that the fragment bound at the Kac binding site of the bromodomain
1.6 Protein X-Ray Crystallography
Historically, protein crystallography was a slow, resource-intensive and time-consuming technique that was used only for lead optimization. Recent years, however, have seen major advances in protein expression, methods for crystallization and structure determination, and it has become easier to access dedicated world-class facilities for X-ray data collection, e.g., at synchrotrons. These transformations have enabled X-ray crystallography to impact more broadly in the drug discovery process. The applications of X-ray crystallography as a screening tool for fragment-based drug discovery were pioneered in the late 1990s by Abbott in the USA and Astex Therapeutics in the UK (44, 45).
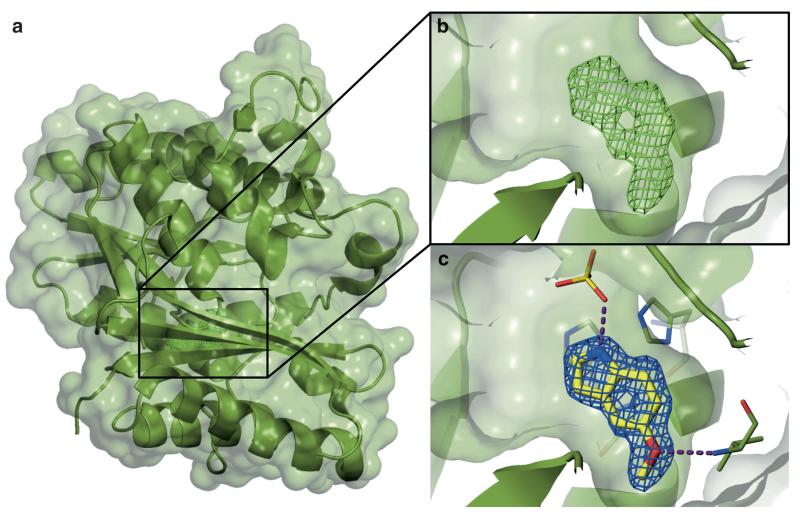
In order to apply protein X-ray crystallography in a screening context, the protein target must first be crystallized and its structure solved (see Note 5). Secondly, a well-established crystallization process and an ability to reliably obtain crystals of protein–ligand complexes is a crucial step in any screening efforts. Protein crystals are exposed to an X-ray source and a diffraction pattern is recorded. It is possible to use this information to reconstruct an electron density map of the molecule causing such a diffraction pattern, thereby allowing one to solve the crystal structure of the protein. If a small molecule is bound to the protein in the crystal, this can be rapidly identified by inspection of differences between the electron density maps of the complex and the protein alone. Detailed examination of these differences and fitting of molecular models into the density enable the identification of the small molecule and its binding mode (Fig. 9).
Fig. 9.
Identification of a fragment bound to a protein by X-ray crystallography. (a) Crystal structure of a protein with a fragment bound. Protein backbone atoms are shown as green ribbons with a transparent superposed van der Waals surface. (b) Visualization of difference electron density (mesh) unexplained by the molecular model of the apo-protein highlights the location of the small molecule binding site. This initial difference Fo − Fc electron density map (contoured to 3σ) allows rapid identification of the bound fragment. (c) Final 2Fo − Fc electron density map (mesh, and contoured to 1σ) upon further refinement including the bound ligand confirms the identity of the fragment and its binding mode. The figures show binding of 5-methoxyindole (a fragment) to the enzyme pantothenate synthetase from Mycobacterium tuberculosis (51)
In some cases, the crystal form of the unliganded protein is not suitable for soaking of small molecules, requiring laborious co-crystallization trials for each small molecule. General procedures for protein X-ray crystallography, ligand soaking and co-crystallization are covered in detail in Chapter 17 (see Note 6). Obtaining a crystal structure of a ligand bound to the target protein is important to inform rational design and careful optimization of the compounds affinities and physicochemical properties by medicinal chemistry based approaches. This is routinely conducted within structure-guided hit-to-lead and lead optimization programs for drug discovery (see Chapter 19).
1.7 Concluding Remarks
In summary, the biophysical techniques and approaches described herein have become widely implemented in small-molecule ligand discovery efforts in both academic and industrial research laboratories worldwide. Each biophysical technique described has diverse but highly complementary sets of capabilities (summarized in Table 1) and particular advantages and disadvantages with regard to compound screening, hit validation, and characterization (summarized in Table 2).
Table 1. Summary of parameters of different biophysical techniques that are important for small molecule screening.
| Technique | Screening throughput | Material consumption | Covalent immobilization | Detectable Kd range |
Binding site information |
|---|---|---|---|---|---|
| DSF | High | Intermediate | None | Up to 5 mM | None |
| FP | High | Low | None | Down to Kd of probe | Limited to competition |
| NMR | Intermediate | Intermediate | None | Low nM—10 mM | Good |
| ITC | Low | High | None | Low nM—5 mM | Limited to competition |
| SPR | Intermediate | Low | Required | pM—2 mM | Limited to competition |
| PX | Low | Intermediate | None | Up to ligand solubility | Excellent |
Table 2. Summary of relative advantages and disadvantages of different biophysical techniques with regard to small molecule screening, validation, and characterization.
| Technique | Advantages | Disadvantages |
|---|---|---|
| DSF |
|
|
| FP |
|
|
| NMR (ligand-observed) |
|
|
| NMR (protein-observed) |
|
|
| ITC |
|
|
| SPR |
|
|
| PX |
|
|
Based on the author’s experience in participating to several small molecule discovery and drug design projects, it is crucial to identify several bona fide binding ligands and to gain some structural information of their interactions with the target protein as early on in a program as possible. To this end, it is strongly argued that applying a combination of orthogonal methods provides the most robust and effective way to identify attractive starting points and to build structure–activity relationships early to better inform effective decision-making during the development of chemical probes by medicinal chemistry. One strategy that is proposed to achieve this is to apply an integrated screening cascade of biophysical techniques, starting from the more high-throughput methods, e.g., DSF and/or FP to screen across a large compound library, then enriching and validating the hit list, e.g., by NMR and/or SPR secondary screens, and ultimately using the more material intensive but more information-rich techniques, e.g., ITC and/or PX to characterize the compounds of interest, see Fig. 1 and (23). This strategy is broadly practicable in most research-intensive academic institutions, and can be feasible even within the constraints and often limited resources of academic laboratories.
To date, the implementation of such an integrated, multidisciplinary approach has been hampered, at least within academia, in part by the fact the individual laboratories have traditionally tended to develop strong, deep expertise in individual techniques, e.g., NMR vs. PX or ITC vs. SPR. In addition, many techniques were previously considered too expensive to justify their application in most projects. However, recent developments in instrumentation and automation, coupled to reduction to costs and increased sharing of technical expertise, e.g., across and between industry and academia, are now making the entire platform of the biophysical techniques described here widely available to the research community. Furthermore, the range of techniques at the researcher’s disposal is continually expanding with new methods such as Alpha Screen, Biolayer Interferometry, and Microscale Thermophoresis that are also emerging as suitable techniques for studying of protein–ligand interactions.
In the following sections the focus is on the practicalities of implementation of fluorescence-based techniques that are highly sensitive and relatively low cost making them suitable for wide application to ligand screening in academia and industry. These are usually the first to be applied to a new protein target, before moving on to more detailed characterization by ITC, SPR, NMR and crystallography as outlined above and considered in detail elsewhere in this volume.
2 Materials
2.1 Differential Scanning Fluorimetry
Thermal cyclers are available from a number of suppliers, including Roche Applied Sciences, e.g., LightCyler® 480 Real-Time PCR System; Stratagene, e.g., Mx3005P Real-Time QPCR Systems; Applied Biosystems®, e.g., real-time PCR instruments; and Bio-Rad, e.g., iCycler iQ5 PCR Thermal Cycler. Different instruments from different manufacterers may have different plate capabilities (e.g., 96-well vs. 384-well) as well as different ranges of temperature (e.g., a run can be started at 25 °C with a iCycler iQ5 but can only be started at 37 °C with a LightCycler 480). Screening assays are typically performed in 96-well thin-wall white PCR plates, but can also be implemented in a 384-well format.
Several environmentally sensitive fluorescent dyes are available for use in DSF; however, by far the most commonly used is Sypro Orange. The wavelengths for excitation and emission are 490 and 575 nm, respectively. Sypro Orange comes as a 5,000× concentrated solution in DMSO. Since this dye has the advantage of a high signal to noise ratio, a low final concentration in the range of 1–5× yields optimal data with most proteins. Several buffer types and concentrations should be screened in advance to identify optimal conditions for reproducible protein thermal melts. It may be best to avoid buffers such as Tris, which exhibit large temperature dependence of their pKa. Protein is usually used at concentrations of 1–10 μM, and small molecule ligands should be used at concentrations around or above the (known or expected) dissociation constants of their protein–ligand complex. In case of high affinity ligands, i.e., Kd < 10 μM, a concentration of at least equal that of the protein should be used to ensure significant population of the bound state.
2.2 Fluorescence Polarization
2.2.1 Capabilities of Instruments Required and Suitable Models
FP assays can be carried out using any fluorescence microplate reader capable of orthogonal-plane optical fluorescence readouts, and with an excitation wavelength range typically in the region of 230–900 nm. Several instruments capable of fast readout for HTS are available from different manufacturers, including PHERAstar Microplate Reader models from BMG LABTECH, the Perkin Elmer Envision® Multilabel Reader, and the Tecan Polarion Fluorescence Microplate Reader.
Filters for excitation and emission are required with wavelengths that need to be specified depending on the dye of interest (see below). Screening assays are typically performed in 96-well or 384-well format, e.g., Corning black Nonbinding Surface Microplates, but can also be implemented in a 1,536-well format.
2.2.2 Fluorescent Dyes and Criteria for Selection
Fluorophores that can be used for competitive FP assays can be divided into intrinsic probes, meaning the ligand to be displaced in the assay is naturally fluorescent, and extrinsic probes, which need to be introduced in to the known ligand to aid its detection. The latter strategy is the most commonly used since it is generally applicable to most systems, but has the disadvantage that their introduction may perturb the system. This should be carefully checked in advance during the assay optimization (see Subheading 3.2.1 and Eq. 5). Fluorescent dyes typically used in FP assays include carboxyfluorescein (FAM) or fluorescein thioisocyanate (FITC) dyes. For screens of compounds that modulate protein–peptide interactions FAM or FITC can be conveniently attached at the N-terminus or at the C-terminus of the peptidic sequence of interest using solid-phase peptide synthesis and amide forming reactions. These dyes have excitation maxima around 490 nm, and emission maxima around 520–535 nm. Alternative dyes used include the whole range of Invitrogen’s Alexa fluor dyes that span the visible spectrum.
Criteria for dye selection include consideration of the approximate absorption and emission maxima for the conjugates, which need to be compatible with the instrument being used and importantly with the available optical filters. An important parameter to be considered is the fluorophore brightness. This is expressed as the product of the extinction coefficient ε and the quantum yield Φ of the dye. The extinction coefficient ε (M −1 cm −1) at a given wavelength, typically the maximum of absorbance, expresses the energy capture efficiency of the dye and is a constant value. The quantum yield expresses the emission efficiency of the dye, and is defined as the ratio between the number of photons emitted and the number of photons absorbed by the fluorophore. An ideal fluorophore would have a quantum yield close to one. The quantum yields of a given fluorophore can vary significantly with conditions since fluorescence is strongly influenced by local environment and, consequently, they are not usually reported as a constant. Other important parameters of the dyes to be considered include photostability, susceptibility to photobleaching, pH insensitivity, and water solubility.
FP assays tend to be pretty insensitive to the choice of buffers and pH, hence optimal conditions for the particular protein of interest should be readily used. The choice of protein concentration to be used is critical for dose response screening assays and is described in Subheading 3.2.1. The concentration of fluorescent ligand that is sufficient to give a good polarization signal can be as low as 1–10 nM, thereby reducing the amount of fluorescent labeled ligand required in the assay.
3 Methods
3.1 Differential Scanning Fluorimetry
Screening assays performed in 96-well plates require 50–100 μL per well, whereas only 10–20 μL solution per well would be required in a 384-well format. As the heating rates can be as fast as 2 degrees per minute, a single plate can be screened in less than 30 min. Once a plate has been prepared and before loading it in the thermal cycler, it is good practice to centrifuge the plate for about 1 min. It is mandatory to record several reference samples (i.e., multiple samples of protein in the absence of ligand and presence of equal amount of any co-solvent, e.g., DMSO), and recommended, if possible, to run negative control samples (protein in the presence of a ligand known not to bind to it) as well as positive control samples (protein in the presence of a known binder).
Ligands can be screened individually, e.g., one per well or present in more than one well to allow multiple reads; alternatively they can be initially pooled and screened as mixtures. If a significant thermal shift is detected with a hit pool, then the protein is subsequently screened again against all individual ligands in that pool to determine the specific binding ligand(s).
A number of software tools have been developed and are available to fit the raw data obtained from the protein thermal melt. Custom calculation software based on Microsoft Excel that can be used for data visualization and analysis are available from the Structural Genomics Consortium Oxford (ftp://ftp.sgc.ox.ac.uk/pub/biophysics), see also (46). Commercial software and instrument specific technical guidance is also available from the instrument manufacturers. The entire fluorescence raw data (RFU) from the thermal melt curve can be accurately fitted to by nonlinear regression using, e.g., KaleidaGraph (http://www.synergy.com), SigmaPlot (http://www.sigmaplot.com/), Prism (http://www.graphpad.com/), GraFit (http://www.erithacus.com/grafit), or Origin (http://www.originlab.com). This enables one to obtain the enthalpy of protein unfolding (ΔHu), the heat capacity change upon protein unfolding (ΔCpu), and Tm, according to the equation described by Lo et al. (30). Data fitting using this approach is complicated by the fact that most protein DSF curves do not exhibit the ideal sigmoidal shape with constant pre- and post-transitional fluorescence intensities. This is particularly the case in the high-temperature region of the curve, which often exhibits a progressive decrease in fluorescence due to protein aggregation following unfolding (see Fig. 3a). Given that the temperature midpoint for the unfolding transition (Tm) tends to be the only parameter that is monitored in ligand screening experiments, this is often more conveniently determined indirectly by identifying the inflection point of the RFU curve. For this purpose, most instrument softwares generate a negative first derivative plot of the melting curve raw fluorescence data (−dRFU/dT) against temperature, from which the Tm can be determined as the position of the minimum (see Fig. 3b).
3.2 Fluorescence Polarization
3.2.1 Determination of Optimal Protein Concentration for the Assay
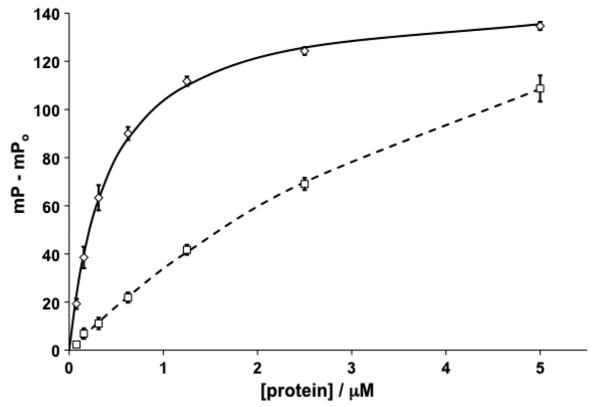
To determine the optimum concentration of protein to use in subsequent screening experiments, a standard curve in which different concentrations of protein are titrated against a known concentration of fluorescently labeled peptide should be recorded. As the concentration of protein is increased, a large FP signal develops. This titration yields the dissociation constant Kd of the complex between the protein and the fluorescent peptide. The selected concentration of the fluorescent peptide must not be much greater in magnitude than 2 × Kd to prevent the stoichiometric titration of the fluorescent ligand. The titration is then repeated in the presence of a fixed amount of a nonfluorescent form of the same peptide that would be expected to compete for binding. A plot similar to that shown in Fig. 10 can then be obtained in which there is a protein concentration dependent reduction in the observed FP signal due to displacement by the nonfluorescent peptide.
Fig. 10.
Typical titration plots of protein into a constant concentration of fluorescent-labeled peptide (12 nM). The background polarization of the reference fluorophore in the absence of protein (mPo) is subtracted from all data recorded in the absence (average data shown as diamonds, curve fit as solid line) and presence (average data shown as squares, curve fit as dashed line) of a fixed concentration (5 μM) of unlabelled peptide. Error bars represent +/− the standard deviation over three data point replicates. Data shown is for the binding of a FAM-labeled HIF-1α peptide (FAM-DEALA-Hyp-YIPD, Kd = 400 nM) to the ternary complex between von Hippel Lindau protein (pVHL) Elongin B and Elongin C, and competition with the respective unlabeled peptide (52)
This second titration yields an “apparent” dissociation constant Kdapp for the fluorescent complex that should be larger than that measured in the absence of the unlabelled peptide. Using the following simple competition model Eq. 5 it is possible to calculate the Kd for the unlabelled peptide, allowing one to check that the introduction of the fluorophore has not dramatically affected the native interaction of the peptide:
| (5) |
where KdU (the dissociation constant of the unlabeled peptide) can be calculated using the known values [U]tot (the total concentration of the unlabeled peptide), KdL (the dissociation constant of the labeled peptide), and Kdapp (the apparent dissociation constant of the labeled peptide in the presence of a fixed concentration of unlabeled peptide).
At high protein concentrations, as shown in Fig. 10, addition of an inhibitor that binds to the same site as the fluorescent peptide does not alter the FP signal by much as there is sufficient protein that the fluorescent peptide is still mostly found in complexes. Thus, whereas high protein concentrations ensure a strong FP signal and hence a reliable assay, the percentage inhibition on addition of a relatively low affinity inhibitor is low. Conversely, at low protein concentrations, there is a large percentage change in the FP signal upon addition of a displacer but the absolute FP signals are much lower in intensity leading to a low signal–background ratio. A compromise concentration is needed in which a substantial absolute signal and large percentage change are possible.
In general, assay quality can be quantified using a Z-factor, also called Z′ (47), which in this case is defined as:
| (6) |
where σfree, σbound, mPfree, and mPbound are the standard deviations and the means of the negative (free) and positive (bound) controls, respectively. A value greater than 0.7 is considered to yield a good assay format. Having both relatively small errors and a large signal strength maximizes the value of Z′. At least threefold repetition of the titrations above is necessary to provide error estimates for the values in this formula.
To determine an appropriate range of protein concentrations in which there is substantial absolute signal strength and good percentage inhibition, the parameter (Z′ × % binding inhibition) should be obtained (Table 3). The largest values indicate the optimum protein concentration range. The data shown in Table 3, obtained from the plots in Fig. 10, suggest that protein concentrations between 300 nM and 1.2 μM would be near optimal in this case.
Table 3. Z′ , % Inhibition and Z′ × % Inhibition as calculated from the data shown in Fig. 10.
| Protein conc. (nM) | Z′ | % Inhibition | Z′ × % Inhibition |
|---|---|---|---|
| 5,000 | 0.95 | 19 | 18.27 |
| 2,500 | 0.95 | 44 | 42.02 |
| 1,250 | 0.95 | 63 | 58.06 |
| 625 | 0.88 | 76 | 66.37 |
| 313 | 0.70 | 82 | 57.44 |
| 156 | 0.56 | 82 | 46.33 |
| 78 | 0.54 | 88 | 47.35 |
Z′ × % inhibition provides a good metric to identify the optimal range of protein concentration for use in screening
3.2.2 Determination of Dose–Response Curves
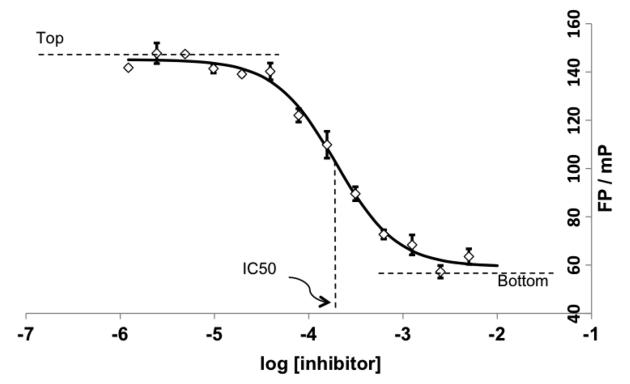
Using the optimal concentration of protein for this assay, determined as previously described, dose response behavior can be recorded for each inhibitor as required by measuring fluorescence of a fixed concentration of fluorescent ligand in the presence of fixed concentration of protein and varying concentrations of the compounds to be tested. The displacement of the fluorescent ligand will give a reduction in the FP signal and a dose response curve can be plotted, see Fig. 11, from which an IC50 can be measured. By definition an IC50 is the inhibitor concentration that displaces 50 % of the fluorescent ligand from the protein–ligand complex.
Fig. 11.
A typical plot of fluorescence polarization (FP), in millipolarization (mP) unit, vs. log [inhibitor]. The IC50 is readily determined to be the midpoint of the sigmoidal dose response curve. Data in the y axis can also be plotted as (% Inhibition) calculated as 100 × (Top − mP)/(Top − Bottom), where and Bottom are the asymptotes Top of the sigmoidal curve. Data shown is for the dose–response inhibition of signal due to binding of a FAM-labeled HIF-1α peptide (FAM-DEALA-Hyp-YIPD) to the ternary complex between von Hippel Lindau protein (pVHL), Elongin B and Elongin C upon competition with a small molecule ligand (52)
The Kd of the competitive inhibitor I can then be back calculated (33) from their IC50 by using
| (7) |
In Eq. 7: KI = Kd of the competitive inhibitor I (to be calculated); KL = Kd of the fluorescent ligand L to be displaced (measured independently); [P]T = total protein concentration used in the assay; [L]T = total concentration of fluorescent ligand L used in the assay; f0 = fractional saturation of fluorescent ligand, i.e., [PL]/[L]T ([PL] is known based on the equilibrium constant KL and the initial conditions of the assay).
Data on 8–10 compounds individually can be obtained in triplicate over a ~104–fold compound concentration range in under 10 min, e.g., in a 384-well plate by performing serial two- or threefold dilutions of an initial concentrated stock of the compounds to be tested. It is important to run appropriate controls during the assay, including: a sample of Fluorophore + Protein − Inhibitor (which will give the maximum signal); a sample of Fluorophore + Protein − Inhibitor (which will give the minimum signal); a sample of Fluorophore − Protein + Inhibitor (to exclude compound interference with the signal of the fluorescent dye).
FP has an upper limit of measuring IC50 that is dependent only on ligand solubility and co-solvent tolerance of the assay (see Note 7). For weak-affinity ligands, the assay starts to become unreliable nearing the IC50 upper limit due to the high concentrations of compound potentially interfering with the polarization signal (see Note 8). In contrast, the lower limit of measuring IC50 is dependent on the Kd of the fluorescent peptide (33). For potent inhibitors, IC50 values acquired in assays using a weak-binding (high Kd) fluorescent ligand are higher than IC50 values acquired in assays using a tight-binding (low Kd) fluorescent ligand. Consequently, the higher the affinity of the fluorescent ligand, the wider the range of inhibitor potency that can be resolved by the assay. This is particular important to establish reliable SAR during hit-to-lead and lead optimization campaigns. In our hands, the IC50 values obtained can fluctuate on a day-to-day basis and dependent on conditions, sometimes as much as tenfold. It is therefore very important to repeat titrations of a test inhibitor when comparing assays run in different days or using different stocks of binding partners. Even with the associated errors and limitations, FP is a useful technique as it enables a quick determination of IC50 with moderate accuracy and back calculation of Kd, if necessary.
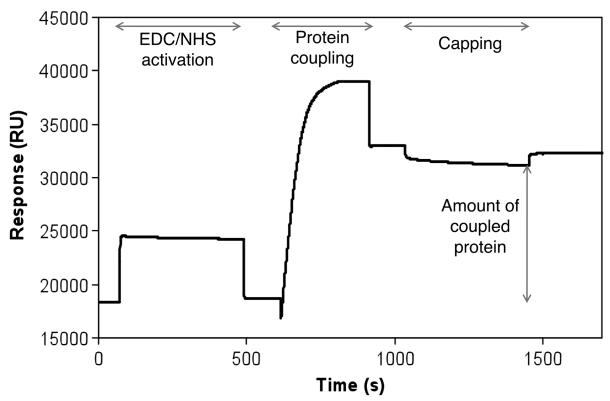
Fig. 12.
Typical protein immobilization sensogram is shown as a plot of Response Unit (RU) against time. The following protein amine coupling procedure was used: 1 min equilibration followed by 7 min EDC/NHS activation; 2 min equilibration followed by 5 min protein injection; 2 min equilibration followed by 5 min ethanolamine capping; 5 min equilibration. A final coupling of 15,000 RU of a protein was achieved. One resonance unit (RU) represents the binding of approximately 1 pg protein/mm2 and thus it is proportional to the mass of protein bound (36)
Acknowledgments
The author wishes to thank several members of the Ciulli and Abell research groups (Department of Chemistry) and the Blundell research group (Department of Biochemistry) for productive collaboration and invaluable discussions over the years. The Ciulli laboratory is funded primarily but not exclusively by the UK Biotechnology and Biological Sciences Research Council (BBSRC). The author thanks the BBSRC for the award of a David Phillips Fellowship (BB/G023123/1).
Footnotes
Measured values of P in biophysical analysis are between 10 and 300 mP. Consequently, instruments capable of very precise measurements are required to monitor changes upon binding in some reactions. Fortunately, many instruments can now measure with a precision close to ±2 mP, which means that almost all reactions can be followed reliably.
Amine coupling is a common approach to immobilizing a protein on an SPR chip. Coupling can be easily achieved by reacting amine groups of the protein with carboxylate groups of the chip dextran matrix upon their activation using 1-ethyl-3-(3-dimethylaminopropyl)-carbodiimide (EDC) and N-hydroxysuccinimide (NHS). An alternative approach to amine coupling is to immobilize the protein via the free thiols of its cysteine residues. This is accomplished upon reacting the activated surface with 2-(2-pyridinyldithio)ethaneamine hydrochloride (PDEA), which contains an amine and a reactive disulfide for thiol-disulfide exchange, prior to protein immobilization.
The progress of the activation and coupling process can be monitored through the SPR response itself, see Fig. 12 for an example.
Relaxation times: T1 the longitudinal relaxation time. It depends upon the overall rate of tumbling of the protein. It can be modulated by local motions due to conformational flexibility. T2 the transverse relaxation time. It is shorter than T1 and is correlated with dynamic processes in the protein. T2 determines the linewidth of the NMR signals and decreases with increasing size of the molecule. Generally, small molecules (<1,000 Da) exhibit slow relaxation, i.e., long longitudinal (T1 = 1 − 2 s) and transverse (T2 = 1 s) relaxation times and small and positive NOEs. In contrast, bound ligands share the NMR properties of the larger protein (>10,000 Da) that are distinctly different: fast relaxation, i.e., short relaxation times (T1 = 20–50 ms and T2 = 5–20 ms for a 30 kDa protein) and large and negative NOEs. These differences give rise to changes in the average NMR parameters of the ligands that can be monitored to assess binding to the protein target.
The exact concentrations of ligands and protein used will vary depending on the particular system being investigated, e.g., components solubility, on the number of ligands being tested per sample, and on the nature of the NMR experiment to be carried out. Typically, in small molecule fragment screens the ligands are tested at concentrations of 250 μM to 1 mM thereby allowing robust detection of fragment signals. To increase the throughput of the screening process, and to reduce the amount of protein and experimental time required, fragments can be mixed together in cocktails. Depending on the solubility of compounds, cocktails of up to 8–10 fragments can be used; however, in my own experience such large mixtures tend to be problematic due to extensive signal overlap from the ligands, which hampers identification of bound ligands, meaning subsequent deconvolution procedures would be required. In addition, such large mixtures tend to increase the possibility of different ligands interfering with each other in solution. For example it is known that organic salts tend to have lower solubilities in DMSO than the corresponding free acids and bases, and are thus more likely to lead to precipitation from DMSO. Mixing acidic and basic fragments can lead to similar problems. These interferences can cause compound aggregation and ultimately affect the screen by increasing the number of false positives. For these reasons a maximum mixture size of 3–4 fragments is recommended.
Most known PX structures and their crystallization conditions are deposited in the Protein Data Bank (PDB) http://www.rcsb.org/ which is an open-access database (48). Structures and other information may also be available as coordinates in patent descriptions or from the primary literature.
Fragments or larger compounds are typically soaked as solutions in dimethylsulfoxide (DMSO), individually or as mixtures, into the target protein crystal by adding them in a solution containing the mother liquor used to crystallize the protein. The concentration of the molecular fragments is usually 20 mM or higher, even up to 200 mM, to allow for the weakness of the interaction (usually in the mM range). However, for stronger binding interactions (affinities in the micromolar range) lower concentrations can be used, albeit this should be in excess of the protein concentration (often in the low millimolar range) to allow saturation of the binding sites in the crystal. Protein crystals may not tolerate the high concentrations of compounds and DMSO (or other organic co-solvents) used and can be easily damaged during the soaking procedure. If a cryoprotectant solution is required prior to freezing crystals, the small molecules used for soaking may be included in such a solution (however, in the author’s experience this has not been a strict requirement). If mixtures are used in the soaking protocol, the individual fragments should be unambiguously distinguishable from their electron density.
A maximum of 10 % v/v DMSO can be usually tolerated in an assay. However, the limit should be determined on a case by case basis, e.g., it has been observed that DMSO interferes with an assay by binding to the targeted binding site on the protein, thereby potentially competing with the ligand being screened (49). So care should be taken to exclude such DMSO interference, for example by performing a dose–response curve as a function of DMSO concentration.
All types of fluorescent-based assays, including FP assays, are prone to interference that can give rise to false positives, false negatives or other artifacts. For example, compound autofluorescence in a given well may be erroneously interpreted as displacement, giving rise to a false positive. This is because the additional fluorescent signal due to the compound is likely to be of low polarization and can exaggerate the apparent level of ligand displacement in that well. In contrast, compound insolubility under the screening condition may result in excessive light scattering, which can increase the overall polarization measurement meaning such a compound may appear as an “activator.” Compound absorbance at the excitation or emission wavelengths should instead have no effect on the observed polarization.
The author did not receive any financial contribution or writing assistance for the production of this chapter and declares no competing financial interests.
References
- 1.Crews CM. Targeting the undruggable proteome: the small molecules of my dreams. Chem Biol. 2010;17:551–555. doi: 10.1016/j.chembiol.2010.05.011. [DOI] [PMC free article] [PubMed] [Google Scholar]
- 2.Schreiber SL. Small molecules: the missing link in the central dogma. Nat Chem Biol. 2005;1:64–66. doi: 10.1038/nchembio0705-64. [DOI] [PubMed] [Google Scholar]
- 3.Frye SV. The art of the chemical probe. Nat Chem Biol. 2010;6:159–161. doi: 10.1038/nchembio.296. [DOI] [PubMed] [Google Scholar]
- 4.Edwards AM, Bountra C, Kerr DJ, Willson TM. Open access chemical and clinical probes to support drug discovery. Nat Chem Biol. 2009;5:436–440. doi: 10.1038/nchembio0709-436. [DOI] [PubMed] [Google Scholar]
- 5.Cole PA. Chemical probes for histone-modifying enzymes. Nat Chem Biol. 2008;4:590–597. doi: 10.1038/nchembio.111. [DOI] [PMC free article] [PubMed] [Google Scholar]
- 6.Hopkins AL, Groom CR. The druggable genome. Nat Rev Drug Discov. 2002;1:727–730. doi: 10.1038/nrd892. [DOI] [PubMed] [Google Scholar]
- 7.Russ AP, Lampel S. The druggable genome: an update. Drug Discov Today. 2005;10:1607–1610. doi: 10.1016/S1359-6446(05)03666-4. [DOI] [PubMed] [Google Scholar]
- 8.Broach JR, Thorner J. High-throughput screening for drug discovery. Nature. 1996;384:14–16. [PubMed] [Google Scholar]
- 9.Spencer RW. High-throughput screening of historic collections: observations on file size, biological targets, and file diversity. Biotechnol Bioeng. 1999;61:61–67. [PubMed] [Google Scholar]
- 10.Macarron R, Banks MN, Bojanic D, et al. Impact of high-throughput screening in biomedical research. Nat Rev Drug Discov. 2011;10:188–195. doi: 10.1038/nrd3368. [DOI] [PubMed] [Google Scholar]
- 11.Bleicher KH, Böhm H-J, Müller K, Alanine AI. Hit and lead generation: beyond high-throughput screening. Nat Rev Drug Discov. 2003;2:369–378. doi: 10.1038/nrd1086. [DOI] [PubMed] [Google Scholar]
- 12.Shoichet BK. Interpreting steep dose-response curves in early inhibitor discovery. J Med Chem. 2006;49:7274–7277. doi: 10.1021/jm061103g. [DOI] [PubMed] [Google Scholar]
- 13.Babaoglu K, Simeonov A, Irwin JJ, et al. Comprehensive mechanistic analysis of hits from high-throughput and docking screens against beta-lactamase. J Med Chem. 2008;51:2502–2511. doi: 10.1021/jm701500e. [DOI] [PMC free article] [PubMed] [Google Scholar]
- 14.McGovern SL, Caselli E, Grigorieff N, et al. A common mechanism underlying promiscuous inhibitors from virtual and high-throughput screening. J Med Chem. 2002;45:1712–1722. doi: 10.1021/jm010533y. [DOI] [PubMed] [Google Scholar]
- 15.Jhoti H, Cleasby A, Verdonk M, Williams G. Fragment-based screening using X-ray crystallography and NMR spectroscopy. Curr Opin Chem Biol. 2007;11:485–493. doi: 10.1016/j.cbpa.2007.07.010. [DOI] [PubMed] [Google Scholar]
- 16.Ciulli A, Blundell TL, Abell C. Discovery and extrapolation of fragment structures towards drug design. In: Stroud RM, Finer-Moore J, editors. Computational and structural approaches to drug discovery: ligand-protein interactions. The Royal Society of Chemistry; Cambridge: 2008. [Google Scholar]
- 17.Shuker SB, Hajduk PJ, Meadows RP, Fesik SW. Discovering high-affinity ligands forproteins: SAR by NMR. Science. 1996;274:1531–1534. doi: 10.1126/science.274.5292.1531. [DOI] [PubMed] [Google Scholar]
- 18.Hann MM, Leach AR, Harper G. Molecular complexity and its impact on the probability of finding leads for drug discovery. J Chem Inf Comput Sci. 2001;41:856–864. doi: 10.1021/ci000403i. [DOI] [PubMed] [Google Scholar]
- 19.Blundell TL, Jhoti H, Abell C. High-throughput crystallography for lead discovery in drug design. Nat Rev Drug Discov. 2002;1:45–54. doi: 10.1038/nrd706. [DOI] [PubMed] [Google Scholar]
- 20.Rees DC, Congreve M, Murray CW, Carr R. Fragment-based lead discovery. Nat Rev Drug Discov. 2004;3:660–672. doi: 10.1038/nrd1467. [DOI] [PubMed] [Google Scholar]
- 21.Hajduk PJ, Greer J. A decade of fragment-based drug design: strategic advances and lessons learned. Nat Rev Drug Discov. 2007;6:211–219. doi: 10.1038/nrd2220. [DOI] [PubMed] [Google Scholar]
- 22.Congreve M, Chessari G, Tisi D, Woodhead AJ. Recent developments in fragment-based drug discovery. J Med Chem. 2008;51:3661–3680. doi: 10.1021/jm8000373. [DOI] [PubMed] [Google Scholar]
- 23.Ciulli A, Abell C. Fragment-based approaches to enzyme inhibition. Curr Opin Biotechnol. 2007;18:489–496. doi: 10.1016/j.copbio.2007.09.003. [DOI] [PMC free article] [PubMed] [Google Scholar]
- 24.Murray CW, Rees DC. The rise of fragment-based drug discovery. Nat Chem. 2009;1:187–192. doi: 10.1038/nchem.217. [DOI] [PubMed] [Google Scholar]
- 25.Erlanson DA. Introduction to fragment-based drug discovery. Top Curr Chem. 2012;317:1–32. doi: 10.1007/128_2011_180. [DOI] [PubMed] [Google Scholar]
- 26.Lundqvist T. The devil is still in the details—driving early drug discovery forward with biophysical experimental methods. Curr Opin Drug Discov Devel. 2005;8:513–519. [PubMed] [Google Scholar]
- 27.Ciulli A, Williams G, Smith AG, Blundell TL, Abell C. Probing hot spots at protein--ligand binding sites: a fragment-based approach using biophysical methods. J Med Chem. 2006;49:4992–5000. doi: 10.1021/jm060490r. [DOI] [PubMed] [Google Scholar]
- 28.Ericsson UB, Hallberg BM, Detitta GT, Dekker N, Nordlund P. Thermofluor-based high-throughput stability optimization of proteins for structural studies. Anal Biochem. 2006;357:289–298. doi: 10.1016/j.ab.2006.07.027. [DOI] [PubMed] [Google Scholar]
- 29.Cummings M, Farnum M, Nelen M. Universal screening methods and applications of ThermoFluor®. J Biomol Screen. 2006;11:854–863. doi: 10.1177/1087057106292746. [DOI] [PubMed] [Google Scholar]
- 30.Lo M-C, Aulabaugh A, Jin G, et al. Evaluation of fluorescence-based thermal shift assays for hit identification in drug discovery. Anal Biochem. 2004;332:153–159. doi: 10.1016/j.ab.2004.04.031. [DOI] [PubMed] [Google Scholar]
- 31.Kranz JK, Schalk-Hihi C. Protein thermal shifts to identify low molecular weight fragments. Methods Enzymol. 2011;493:277–298. doi: 10.1016/B978-0-12-381274-2.00011-X. [DOI] [PubMed] [Google Scholar]
- 32.Reindl W, Strebhardt K, Berg T. A high-throughput assay based on fluorescence polarization for inhibitors of the polo-box domain of polo-like kinase 1. Anal Biochem. 2008;383:205–209. doi: 10.1016/j.ab.2008.08.014. [DOI] [PubMed] [Google Scholar]
- 33.Huang X. Fluorescence polarization competition assay: the range of resolvable inhibitor potency is limited by the affinity of the fluorescent ligand. J Biomol Screen. 2003;8:34–38. doi: 10.1177/1087057102239666. [DOI] [PubMed] [Google Scholar]
- 34.Wiseman T, Williston S, Brandts JF, Lin LN. Rapid measurement of binding constants and heats of binding using a new titration calorimeter. Anal Biochem. 1989;179:131–137. doi: 10.1016/0003-2697(89)90213-3. [DOI] [PubMed] [Google Scholar]
- 35.Turnbull WB, Daranas AH. On the value of c: can low affinity systems be studied by isothermal titration calorimetry? J Am Chem Soc. 2003;125:14859–14866. doi: 10.1021/ja036166s. [DOI] [PubMed] [Google Scholar]
- 36.Van der Merwe PA. Surface plasmon resonance. In: Chowdhry B, Harding S, editors. Protein–ligand interactions: hydrodynamics and calorimetry. Oxford University Press; Oxford: 2001. [Google Scholar]
- 37.Pellecchia M, Bertini I, Cowburn D, et al. Perspectives on NMR in drug discovery: a technique comes of age. Nat Rev Drug Discov. 2008;7(9):738–745. doi: 10.1038/nrd2606. [DOI] [PMC free article] [PubMed] [Google Scholar]
- 38.Lepre CA, Moore JM, Peng JW. Theory and applications of NMR-based screening in pharmaceutical research. Chem Rev. 2004;104:3641–3676. doi: 10.1021/cr030409h. [DOI] [PubMed] [Google Scholar]
- 39.Hajduk PJ, Sheppard G, Nettesheim D, et al. Discovery of potent nonpeptide inhibitors of stromelysin using SAR by NMR. J Am Chem Soc. 1997;119:5818–5827. [Google Scholar]
- 40.Śledź P, Abell C, Ciulli A. Ligand-observed NMR in fragment-based approaches. In: Bertini I, McGreevy K, Parigi G, editors. NMR of biomolecules: towards mechanistic systems biology. Wiley-VCH; Weinheim: 2012. [Google Scholar]
- 41.Hajduk PJ, Olejniczak E, Fesik S. One-dimensional relaxation- and diffusion-edited NMR methods for screening compounds that bind to macromolecules. J Am Chem Soc. 1997;119:12257–12261. [Google Scholar]
- 42.Mayer M, Meyer B. Characterization of ligand binding by saturation transfer difference NMR spectroscopy. Angew Chem Int Ed Engl. 1999;38:1784–1788. doi: 10.1002/(SICI)1521-3773(19990614)38:12<1784::AID-ANIE1784>3.0.CO;2-Q. [DOI] [PubMed] [Google Scholar]
- 43.Dalvit C, Fogliatto G, Stewart A, Veronesi M, Stockman B. WaterLOGSY as a method for primary NMR screening: practical aspects and range of applicability. J Biomol NMR. 2001;21:349–359. doi: 10.1023/a:1013302231549. [DOI] [PubMed] [Google Scholar]
- 44.Nienaber VL, Richardson PL, Klighofer V, et al. Discovering novel ligands for macromolecules using X-ray crystallographic screening. Nat Biotechnol. 2000;18:1105–1108. doi: 10.1038/80319. [DOI] [PubMed] [Google Scholar]
- 45.Blundell TL, Abell C, Cleasby A, et al. High throughput X-ray crystallography for drug discovery. In: Flower DR, editor. Drug design: cutting edge approaches. The Royal Society of Chemistry; Cambridge: 2002. [Google Scholar]
- 46.Niesen FH, Berglund H, Vedadi M. The use of differential scanning fluorimetry to detect ligand interactions that promote protein stability. Nat Protocols. 2007;2:2212–2221. doi: 10.1038/nprot.2007.321. [DOI] [PubMed] [Google Scholar]
- 47.Zhang J, Chung T, Oldenburg K. A simple statistical parameter for use in evaluation and validation of high throughput screening assays. J Biomol Screen. 1999;4:67–73. doi: 10.1177/108705719900400206. [DOI] [PubMed] [Google Scholar]
- 48.Berman HM, Westbrook J, Feng Z, et al. The Protein Data Bank. Nucleic Acids Res. 2000;28:235–242. doi: 10.1093/nar/28.1.235. [DOI] [PMC free article] [PubMed] [Google Scholar]
- 49.Philpott M, Yang J, Tumber T, et al. Bromodomain-peptide displacement assays for interactome mapping and inhibitor discovery. Mol BioSyst. 2011;7:2899–2908. doi: 10.1039/c1mb05099k. [DOI] [PubMed] [Google Scholar]
- 50.Ciulli A, Scott DE, Ando M, et al. Inhibition of Mycobacterium tuberculosis pantothenate synthetase by analogues of the reaction intermediate. ChemBioChem. 2008;9:2606–2611. doi: 10.1002/cbic.200800437. [DOI] [PMC free article] [PubMed] [Google Scholar]
- 51.Hung AW, Silvestre HL, Wen S, et al. Application of fragment growing and fragment linking to the discovery of inhibitors of Mycobacterium tuberculosis pantothenate synthetase. Angew Chem Int Ed Engl. 2009;48:8452–8456. doi: 10.1002/anie.200903821. [DOI] [PubMed] [Google Scholar]
- 52.Buckley DL, Van Molle I, Gareiss PC, et al. Targeting the von Hippel-Lindau E3 ubiquitin ligase using small molecules to disrupt the VHL/HIF-1α interaction. J Am Chem Soc. 2012;134:4465–4468. doi: 10.1021/ja209924v. [DOI] [PMC free article] [PubMed] [Google Scholar]


