

Abstract
The objective of this study was to assess changes in monosynaptic motoneuron responses to stimulation of Ia afferents after locomotor training in individuals with chronic spinal cord injury (SCI). We hypothesized that locomotor training modifies the amplitude of the soleus monosynaptic motoneuron responses in a body position-dependent manner. Fifteen individuals with chronic clinical motor complete or incomplete SCI received an average of 45 locomotor training sessions. The soleus H-reflex and M-wave recruitment curves were assembled using data collected in both the right and left legs, with subjects seated and standing, before and after training. The soleus H-reflexes and M-waves, measured as peak-to-peak amplitudes, were normalized to the maximal M-wave (Mmax). Stimulation intensities were normalized to 50 % Mmax stimulus intensity. A sigmoid function was also fitted to the normalized soleus H-reflexes on the ascending limb of the recruitment curve. After training, soleus H-reflex excitability was increased in both legs in AIS C subjects, and remained unchanged in AIS A-B and AIS D subjects during standing. When subjects were seated, soleus H-reflex excitability was decreased after training in many AIS C and D subjects. Changes in reflex excitability coincided with changes in stimulation intensities at H-threshold, 50 % maximal H-reflex, and at maximal H-reflex, while an interaction between leg side and AIS scale for the H-reflex slope was also found. Adaptations of the intrinsic properties of soleus motoneurons and Ia afferents, the excitability profile of the soleus motoneuron pool, oligosynaptic inputs, and corticospinal inputs may all contribute to these changes. The findings of this study demonstrate that locomotor training impacts the amplitude of the monosynaptic motoneuron responses based on the demands of the motor task in people with chronic SCI.
Keywords: Input, output curve, Neuroplasticity, Neuromodulation, Rehabilitation, Recruitment, Soleus H-reflex, Spinal cord injury, Treadmill training, Plasticity
Introduction
One key change following an injury to the spinal cord is altered excitability of spinal neurons. This has been linked to changes in the electrical, biophysical, physiological, and morphological properties of spinal moto-neurons and interneurons (Cope et al. 1986; Hochman and McCrea 1994a, b; Bennett et al. 2001; Beaumont et al. 2004; Heckmann et al. 2005; Button et al. 2008). Similar changes have been reported in humans after spinal cord injury (SCI) (Hornby et al. 2003; Knikou 2007; Knikou et al. 2009). While these changes may represent spontaneous plasticity underlying recovery (Wolpaw 2007), training-mediated neuronal changes may play a key role. For example, motoneurons of trained rats had lower hyperpolarized resting membrane potentials, decreased spike trigger threshold levels (membrane potential at which an action potential is triggered), increased amplitudes of after-hyperpolarization (reflecting a decrease in membrane excitability that may occur during sustained excitation—Beaumont and Gardiner 2002, 2003), stabilized dendritic tree structure of motoneurons (Gazula et al. 2004), and cellular properties of motoneurons and their synaptic inputs from the spinal white matter were changed (Petruska et al. 2007). Further, locomotor training alters the synaptic efficacy of neuronal excitation and inhibition in animal models of SCI (Rossignol and Frigon 2011).
Improvements in locomotor ability, kinematics of walking, and spasticity, together with neurophysiological changes at spinal and supraspinal levels, are reported after locomotor training with body weight support (BWS) on a motorized treadmill in people with SCI (Wernig et al. 1995; Dietz et al. 1994, 1998; Trimble et al. 2001; Thomas and Gorassini 2005; Wirz et al. 2005; Hornby et al. 2005; Field-Fote and Roach 2011; Manella and Field-Fote 2013; Knikou 2013). Because upright posture requires integrated actions between descending neuronal pathways and the spinal central pattern generator, both modified by a plethora of proprioceptive, mechanoreceptive, and cutaneous inputs (Edgerton et al. 2004; Deliagina et al. 2008), and because walking encompasses dynamic posture, we theorized that locomotor training can also induce neuronal changes promoting upright posture and body weight bearing. This theory is supported by our recent reports on systematic adaptation of spinal neuronal pathways after locomotor training. Specifically, we have shown that locomotor training normalizes the soleus H-reflex phase-dependent modulation during walking, homosynaptic facilitation reverses to homosynaptic depression regardless of the type of SCI, presynaptic inhibition of Ia afferents is improved in people with motor incomplete but not with motor complete SCI, and reorganizes the behavior of flexor reflex afferent pathways (Knikou 2013; Knikou and Mummidisetty 2014; Smith et al. 2014).
Collectively, we hypothesized that locomotor training modifies the amplitude of the soleus monosynaptic moto-neuron responses in a body position-dependent manner. To test this hypothesis, the soleus H-reflex and M-wave recruitment curves were assembled in people with SCI during seated and standing in the right and left legs before and after repetitive locomotor training.
Materials and methods
Subjects
Fifteen individuals with chronic SCI were enrolled in the study. Study participation varied depending on the number of locomotor training sessions attended and ranged from 1.0 to 3.5 months (Table 1). All subjects signed an informed consent form before participating in the study. Neurophysiological tests, clinical evaluation, and locomotor training were approved by the Northwestern University (Chicago, IL, USA) institutional review board. Subjects' consent was obtained according to the Declaration of Helsinki. Subjects also participated in previous studies (Knikou 2013; Knikou and Mummidisetty 2014; Smith et al. 2014) and are identified here with the same code.
Table 1. Characteristics of participants.
| ID | Gender | Age (yrs) | Post Injury (yrs) | Level | Cause of SCI | AIS scale | Clonus | ASIA (light touch) | ASIA (pin prick) | ASIA (motor) | Medication | # of training sessions | |
|---|---|---|---|---|---|---|---|---|---|---|---|---|---|
|
| |||||||||||||
| LL | RL | ||||||||||||
| R04 | F | 35 | 12 | C3-C4 | MVA | C | 1LL, 1RL | 72 | 72 | 4 | 4 | Not known | 57 |
| R06 | F | 46 | 1.5 | C5-C7 | MVA | B | 3LL, 3RL | 77 | 77 | 0 | 0 | Baclofen: 10 mg not frequent | 53 |
| R07 | M | 31 | 8 | C5-C7 | MVA | A | 3LL, 3RL | 76 | 40 | 0 | 0 | None | 53 |
| R08 | F | 49 | 4 | T5-T7 | FaU | D | ILL, 1RL | 75 | 75 | 22 | 14 | None during the study | 60 |
| R09 | M | 44 | 3 | C5-C6 | FaU | D | 0LL, 0RL | 112 | 112 | 19 | 24 | Gabapentin: 3.6 g Diazepam: 15 mg | 30 |
| R10 | F | 52 | 11 | T7 | FaU | D | 1LL, 0RL | 78 | 78 | 16 | 24 | Neurontin: 27 mg Baclofen: 60 mg | 65 |
| R11 | M | 39 | 6 | C4 | GSW | D | 3LL, 3RL | 106 | 106 | 24 | 22 | Coumadin | 64 |
| R12 | M | 41 | 1.5 | C5-C6 | MVA | D | 3LL, 3RL | 54 | 54 | 19 | 16 | None during the study | 55 |
| R13 | F | 39 | 7 | T4 | Transverse Myelitis | C | 3LL, 3RL | 112 | 74 | 9 | 2 | Gabapentin: 0.3 g Baclofen: 20 mg | 53 |
| R14 | M | 25 | 0.5 | C5-C6 | Diving | D | 1LL, 1RL | 112 | 110 | 25 | 13 | None during the study | 44 |
| R15 | M | 37 | 1.0 | C1 | Spinal Tumor | C | 3LL, 2RL | 64 | 64 | 12 | 5 | Not known | 36 |
| R16 | M | 49 | 2.5 | C5 | MVA | C | 0LL, 0RL | 64 | 34 | 17 | 12 | Baclofen: 15 mg | 41 |
| R17 | M | 21 | 3 | T10 | GSW | D | 3LL, 3RL | 105 | 105 | 13 | 15 | Baclofen: 60 mg Gabapentin: 50.9 g | 48 |
| R18 | M | 29 | 2 | C7 | MVA | D | 1LL, 1RL | 86 | 86 | 25 | 21 | None | 26 |
| R19 | M | 26 | 1 | C6 | Diving | C | 3LL, 3RL | 112 | 97 | 21 | 8 | Dexapam: 10 mg | 20 |
Level of SCI corresponds to neurological injury level. For each subject, the American Spinal Injury Association (ASIA) standard neurological classification of SCI for sensation (sensory light touch and pin prick; out of 112 maximal points) is shown and evaluated as 0 = absent, 1 = impaired, 2 = normal. ASIA motor score (out of 50 maximal points for each leg) is indicated for the left leg (LL) and right leg (RL) based on the manual muscle test of key muscles and evaluated as 0 = no contraction, 1 = flicker or trace of contraction, 2 = active movement, with gravity eliminated, 3 = active movement against gravity, 4 = active movement against gravity and resistance, 5 = normal power. The ankle clonus for both legs leg is also indicated. Ankle clonus was clinically assessed as follows: 0 = reaction, 1 = mild, clonus was maintained less than 3 s, 2 = moderate, clonus persisted between 3 and 10 s, 3 = severe, clonus persisted for more than 10 s. Medication for each subject is indicated as total mg taken per day. C = cervical. T = thoracic. MVA = motor vehicle accident. GSW: gunshot wound. M = male. F = female. LL = left leg. RL = right leg
Locomotor training
Each individual with SCI received BWS-assisted locomotor training with a robotic exoskeleton system (Lokomat Pro®, Hocoma, Switzerland) and was trained 5 days/week, 1 h/day (Table 1). The protocol employed to train persons with motor complete and motor incomplete SCI is published in detail (see Fig. 1 in Knikou 2013). In AIS A-B subjects, training on the first session started at 1.58 km/h treadmill speed with 60 % BWS. At each subsequent session, the targeted treadmill speed was set to increase by 0.07 km/h and BWS to decrease by 5 %. Treadmill speed and BWS were adjusted differently for each individual over the course of training based on the presence or absence of knee buckling and/or toe dragging. In AIS C-D subjects, when quadriceps manual muscle test score was ≥3/5, training started at 40 % BWS at 1.98 km/h. The treadmill speed and BWS were targeted to be adjusted by 0.07 km/h and 5 % at each subsequent training session, respectively. When quadriceps and triceps surae strength was increased by a full grade, then the BWS was decreased by 10 %. The position of the ankle strap was determined based on the tibialis anterior (TA) muscle strength. The TA muscle strength was assessed every 5 training sessions. The ultimate training goal in AIS C-D subjects was to reach a treadmill speed of 2.98 km/h at the lowest BWS possible without knee buckling or toe dragging during the stance and swing phases, respectively. During the duration of the study, none of the subjects received conventional physical therapy or participated in other research studies.
Experimental procedures
The soleus H-reflex was evoked according to methods we have previously employed in both healthy subjects and people with SCI (Knikou 2007, 2008; Knikou et al. 2009). With the subject seated, relaxed, and both feet supported by a foot rest, a stainless steel plate of 4 cm2 in diameter (anode electrode) was secured proximal to the patella of the right and/or left leg. A rectangular single pulse stimulus of 1-ms duration was delivered by a custom-built constant current stimulator to the posterior tibial nerve at the popliteal fossa. The most optimal stimulation site was established via a handheld monopolar stainless steel head electrode used as a probe (Knikou 2008). An optimal stimulation site corresponded to the site that the M-wave had a similar shape to that of the H-reflex at low and high stimulation intensities, and at the lowest stimulation intensity, an H-reflex could be evoked without an M-wave. When the optimal site was identified, the monopolar electrode was replaced by a pregelled disposable electrode (SureTrace, Conmed, Utica, NY, USA) that was maintained under constant pressure throughout the experiment with an athletic wrap. The stimulation site was then confirmed for the permanent monopolar cathode electrode, based on the previously described criteria. Next, the posterior tibial nerve at the popliteal fossa was stimulated at 0.2 Hz and at least 120 responses were recorded at varying stimulation intensities. Each subject was then transferred to the treadmill and wore an upper body harness that was connected to an overhead pulley system. During standing, BWS was applied with both arms placed parallel to the trunk and equal distribution of body weight in both lower limbs. The stimulation site, H-reflex, and M-wave thresholds were rechecked, and the soleus H-reflex and M-wave recruitment curves were assembled again, while all subjects were instructed to relax. During the recordings of the recruitment curves, the H-reflex, M-wave, and maximal M-wave (Mmax) thresholds, as well as the stimulation intensity corresponding to each point of the recruitment curve, were saved by the customized LabVIEW software for off-line analysis.
Soleus H-reflex and M-wave recruitment curves were assembled before locomotor training and 2 days after all locomotor training sessions ended, at different days for the left and right legs of the same subject. The soleus H-reflex amplitude and shape largely depends on the recruitment of motor axons (M-wave threshold, shape, and excitability). To ensure that changes in H-reflex recruitment curves after training were not due to changes in M-wave threshold and excitability, at least four (4) recruitment curves before and after training in the right and left legs were constructed for each subject. Data were rejected when the M-wave recruitment curve after locomotor training was significantly different from that recorded before locomotor training. This resulted in a different number of recruitment curves in regard to leg side and/or body position. Soleus H-reflex recruitment curves during standing before and after training are reported from the right leg for 13 subjects, and from the left leg for 12 subjects. Soleus H-reflex recruitment curves during seated before and after training from the right leg are reported for 12 subjects, and from the left leg for 11 subjects. Last, the soleus H-reflex in subject R10 in the right leg was absent, while the soleus H-reflex in the left leg was not recorded in subject R18 due to excessive spasms induced upon stimulation of the posterior tibial nerve.
The ipsilateral soleus and TA EMG signals, recorded via a single differential bipolar surface electrode (Motion Lab Systems Inc., Baton Rouge, LA, USA), were filtered with a cutoff frequency of 30–1,000 Hz and sampled by an online analog-to-digital (A–D) acquisition system (National Instruments, Austin, TX, USA) at 2,000 Hz.
Off-line data analysis
All compound muscle action potentials recorded with subjects seated and during standing were measured as peak-to-peak amplitudes of the non-rectified waveform. The soleus H-reflex and M-wave sizes recorded at varying stimulation intensities were normalized to the associated Mmax to counteract for differences of muscle geometry across subjects (Pierrot-Deseilligny and Burke 2012). Then, a sigmoid fit to the full soleus M-wave recruitment curve was applied (Klimstra and Zehr 2008; Brinkworth et al. 2007). The stimulation intensity value corresponding to 50 % of Mmax, derived from the sigmoid fit, was then used to normalize the stimulation intensities that the H-reflexes were evoked. Averages of normalized H-reflexes and M-waves were calculated in steps of 0.05 (up to 1.0 times the 50 % Mmax threshold) and 0.1 (>1.0 times the 50 % Mmax threshold). The above described off-line analysis was done separately for each H-reflex recruitment curve of each subject assembled during seated and standing, before and after locomotor training. This analysis was conducted separately for the right and left leg because (1) the adaptation of the soleus H-reflex modulation pattern during walking after training for the same patients was different in the right and left legs (see Table 3 in Knikou 2013), (2) interlimb muscle coordination was different in both legs (see Fig. 5C in Knikou and Mummidisetty 2014), and (3) the right leg was typically more impaired compared to the left leg (Table 1). Thus, neuronal reorganization as well as the functionality of spinal cord reflex circuits subserving each limb was anticipated to be different after training.
In order to estimate the background EMG activity, first the mean value of the rectified and band-pass filtered soleus and TA EMG for 60 ms duration, beginning 120 ms before posterior tibial nerve stimulation, was calculated for each subject. Then, this value was normalized to the associated maximal EMG during the 60-ms window. This was done separately for each recording with subjects seated and during standing, before and after locomotor training, for the soleus and TA muscles of both legs. Then, the mean normalized soleus and TA background EMG activity was grouped based on time of testing, leg side, and body position. The average ratio of soleus/TA background activity was also calculated. Further, a modulation index of the overall change in soleus background EMG was determined by subtracting the minimum EMG from the maximum EMG and the resultant value normalized to the maximum soleus EMG background activity (Zehr et al. 2012). This yielded modulation indices ranging from 0 to a maximum of 1 (Knikou et al. 2009; Zehr et al. 2012).
Estimation of ankle clonus
EMG recorded bilaterally from the soleus muscle during walking before and after training was extracted and visually inspected for the presence of spontaneous clonic activity. EMG activity was labeled as clonus when there were three or more EMG bursts separated by silent periods greater than 100 ms (Dimitrijevic et al. 1980; Wallace et al. 2005). EMG onset and offset time stamps were marked manually using custom scripts developed in MATLAB (The Mathworks Inc, Natick, MA) and DaDisp (DSP Development Corporation, Newton, MA). These values were used to measure the duration of EMG bursts (in ms), instantaneous clonus frequency (in Hz; measured as 1/cycle duration; cycle duration being the time from the onset of one EMG burst to the onset of the subsequent EMG burst), area under the curve for the rectified EMG bursts, and the energy associated with each EMG burst (Knikou and Mummidisetty 2011; Mummidisetty et al. 2012). The estimated parameters for the clonic activity of the soleus muscle were grouped based on AIS scale and time of testing, and a paired t test was used to establish statistically significant differences before and after training.
Statistics
The M-waves and H-reflexes expressed as a percentage of the Mmax were grouped separately for subjects with AIS A-B, AIS C, and AIS D, based on the normalized stimulation intensities. One-way analyses of variances (ANOVA) were applied to the normalized M-waves recorded at different stimulation intensities for each subject group before and after training (within subject factors: time, intensity). In order to establish changes of soleus H-reflex excitability before and after training, a two-way ANOVA was applied to the normalized soleus H-reflexes recorded on the ascending portion of the recruitment curve separately for AIS A-B, AIS C, and AIS D (within subject factors: time, intensity). Further, a Boltzmann sigmoid function (Eq. 1) was fitted to the normalized group averages of H-reflexes on the ascending limb of the recruitment curve until the H-reflex reached maximum amplitudes (Devanne et al. 1997; Capaday 1997; Carroll et al. 2001; Klimstra and Zehr 2008). This was performed separately for each subject before and after training.
| (1) |
| (2) |
| (3) |
| (4) |
The estimated parameters in Eq. 1 denote the maximum H-reflex (Hmax), the slope parameter of the function (m), the stimulus required to elicit an H-reflex equivalent to 50 % of Hmax (S50), and the H-reflex amplitude at a given stimulus value H(s). For the Hmax, at least five responses in the sigmoid fit were included. The H-reflex slope was constrained to occur at a stimulus equivalent to S50 and was calculated based on Eq. 2. Stimuli, in multiples of 50 % Mmax, corresponding to H-reflex threshold (Hth) and Hmax were calculated based on Eqs. 3 and 4, respectively. The sigmoid function parameters of Hmax, H-slope, S50, and stimuli corresponding to H-threshold and Hmax were grouped for AIS A-B, AIS C, and AIS D subjects based on body position (seated/standing), leg side (right/left), and time of testing (before/after training). For each parameter from the sigmoid function, grouped based on AIS scale, a paired t test was used to establish statistically significant differences before and after training. Further, in order to establish statistically significant differences and interactions for each sigmoid function parameter as a function of leg side, time of testing, and AIS scale (AIS C and/or D) (AIS A/B were not included in this analysis due to single subjects recordings in the left leg during standing and in the right leg during seated), a multiple ANOVA for repeated measures was applied to the data. A paired t test between the soleus/TA background EMG ratio before and after training in the right/left leg was conducted. Last, a three-way multiple ANOVA was applied to the soleus background EMG activity, modulation indices, and ratios of soleus/TA background EMG activity (within subject factors: time of testing, leg side, body position).
For all statistical tests, the effects were considered significant when P < 0.05. Results are presented as mean values along with the standard error of the mean (SEM).
Results
Recruitment curves before and after locomotor training during standing
Soleus M-waves and H-reflexes recorded at different stimulation intensities from the right leg during BWS standing before and after training and the associated sigmoid fits are shown in Fig. 1. In Fig. 1a–c, the normalized soleus M-wave sizes for AIS A-B, AIS C, and AIS D subjects are indicated in multiples of 50 % Mmax stimulation intensity, respectively. The M-waves before and after training for all cases were not statistically significantly different (AIS A-B: F1 = 0.17, P = 0.67; AIS C: F1 = 0.25, P = 0.1; AIS D: F1 = 0.61, P = 0.43; one-way ANOVA), supporting that changes of the soleus H-reflex size after training could not be due to recruitment of different types of soleus moto-neurons by the Ia afferent volley, and that stimulation and recording procedures were not different.
Fig. 1.
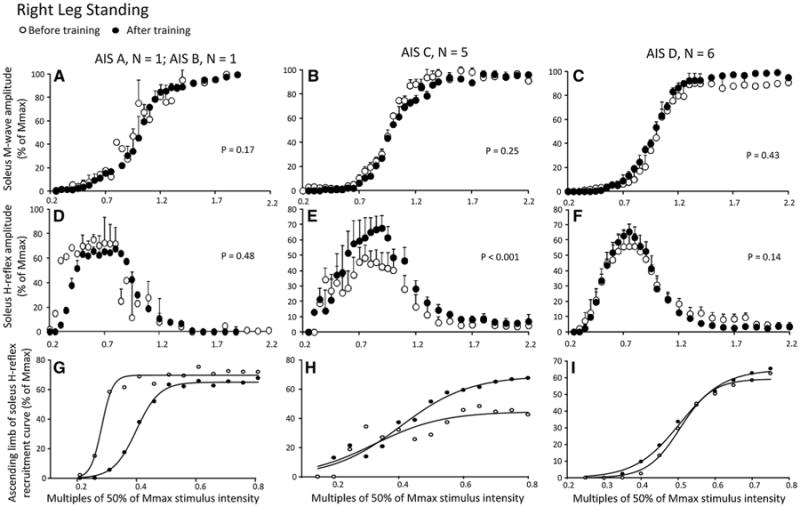
Soleus H-reflex and M-wave recruitment curves before and after locomotor training in the right leg during standing grouped separately for AIS A-B, AIS C, and AIS D subjects. a–c Mean M-wave sizes as a percentage of the maximal M-wave are plotted in multiples of 50 % of Mmax stimulus intensity. d–f Mean soleus H-reflex sizes as a percentage of the maximal M-wave are plotted in multiples of 50 % of Mmax stimulus intensity. g–i Sigmoid input–output relation for soleus H-reflexes elicited on the ascending portion of the recruitment curve. The P values for graphs a–c are the results of the oneway ANOVAs conducted on the normalized M-waves from the start until the end of the recruitment curve before and after training. The P values for graphs d–e are the results of the two-way ANOVAs conducted on the normalized H-reflexes on the ascending portion of the H-reflex recruitment curve as a function of stimulus intensity and time of testing
In Fig. 1d–f, the corresponding normalized soleus H-reflex sizes plotted against the normalized stimulation intensities are shown. A two-way ANOVA showed that the H-reflexes sizes for AIS A-B subjects were statistically significantly different based on the stimulation intensity (F12 = 2.61, P = 0.03) but not based on time of testing (F1 = 0.5, P = 0.48). A similar result was also found for the normalized H-reflexes from AIS D subjects shown in Fig. 1f (stimulation intensity: F12 = 15.87, P < 0.001; time of test: F1 = 2.18, P = 0.14). The normalized H-reflexes from AIS C subjects indicated in Fig. 1e are statistically significantly different based on stimulation intensity (F12 = 2.61, P = 0.006) and time of testing (F1 = 13.76, P < 0.001), suggesting that soleus H-reflex excitability in the left leg in AIS C subjects during standing was increased after training. The corresponding sigmoid fits for H-reflexes recorded on the ascending portion of the recruitment curve before and after training for AIS A-B, AIS C, and AIS D subjects are shown in Fig. 1g–i, respectively. The summarized results of the estimated sigmoid function parameters are given in Table 2. The size of the maximal H-reflex after training was statistically significantly different from that observed before training in the right leg during standing (P < 0.05) in AIS C subjects, while the other sigmoid function parameters remained unaltered (P > 0.05) (Table 2). It should be noted that the soleus H-reflexes on the ascending portion of the recruitment curve in AIS A-B subjects were shifted to the right after training (Fig. 1g).
Table 2. Estimated sigmoid function parameters.
| Hmax | m | S50 | H-slope | Stimulus at H-threshold | Stimulus at Hmax | ||
|---|---|---|---|---|---|---|---|
| Right leg standing | |||||||
| AIS A, B | Before training | 78.8 ± 8.2 | 21.5 ± 6.5 | 0.41 ± 0.04 | 0.10 ± 0.03 | 0.31 ± 0.009 | 0.51 ± 0.07 |
| After training | 62.4 ± 0.3 | 38.9 ± 11.09 | 0.40 ± 0.02 | 0.06 ± 0.01 | 0.34 ± 0.004 | 0.46 ± 0.03 | |
| AIS C | Before training | 55.3 ± 8.01 | 28.5 ± 4.8 | 0.44 ± 0.07 | 0.08 ± 0.01 | 0.37 ± 0.06 | 0.52 ± 0.08 |
| After training | 69.6 ± 9.73 | 24.9 ± 5.72 | 0.45 ± 0.04 | 0.10 ± 0.02 | 0.35 ± 0.06 | 0.54 ± 0.04 | |
| AIS D | Before training | 63.2 ± 6.93 | 23.6 ± 2.96 | 0.56 ± 0.05 | 0.09 ± 0.01 | 0.47 ± 0.05 | 0.65 ± 0.06 |
| After training | 61.6 ± 5.06 | 23.9 ± 4.17 | 0.52 ± 0.03 | 0.10 ± 0.01 | 0.43 ± 0.04 | 0.62 ± 0.02 | |
| Left leg standing | |||||||
| AIS Ba | Before training | 93.65 | 24.24 | 0.50 | 0.08 | 0.41 | 0.58 |
| After training | 76.56 | 44.21 | 0.44 | 0.04 | 0.39 | 0.48 | |
| AIS C | Before training | 66.22 ± 5.31 | 17.54 ± 3.89 | 0.49 ± 0.1 | 0.13 ± 0.02 | 0.35 ± 0.08 | 0.62 ± 0.12 |
| After training | 86.19 ± 9.62 | 15.46 ± 2.08 | 0.45 ± 0.03 | 0.14 ± 0.02 | 0.32 ± 0.02 | 0.59 ± 0.05 | |
| AIS D | Before training | 48.02 ± 8.23 | 21.92 ± 3.41 | 0.59 ± 0.04 | 0.11 ± 0.01 | 0.48 ± 0.03 | 0.71 ± 0.05 |
| After training | 50.84 ± 11.83 | 22.1 ± 3.18 | 0.51 ± 0.04 | 0.10 ± 0.01 | 0.41 ± 0.04 | 0.62 ± 0.04 | |
Sigmoid function parameters estimated from the sigmoid input–output relation of soleus H-reflexes on the ascending portion of the recruitment curve conducted for each subject separately and grouped based on AIS scale. Hmax: maximal H-reflex, m: slope parameter of the function, S50: Stimulus at 50 % of Hmax. Mean ± SEM. Italic values indicate cases of statistically significant differences after training compared to that observed before training based on a paired t test
For AIS B, sigmoid function ft results are from a single subject and thus a paired t test before and after training could not be performed
Figure 2 shows soleus M-waves and H-reflexes at different stimulation intensities, recorded from the left leg during BWS standing before and after training as well as the associated sigmoid fits. In Fig. 2a–c, the normalized soleus M-wave sizes for AIS B, AIS C, and AIS D subjects are shown in multiples of 50 % Mmax stimulation intensity, respectively. One-way ANOVAs showed that the M-waves before and after training for all cases were not significantly different (AIS B: F1 = 1.88, P = 0.17; AIS C: F1 = 0.8, P = 0.36; AIS D: F1 = 0.07, P = 0.78). In Fig. 2d–f, the corresponding normalized soleus H-reflex sizes plotted against the normalized stimulation intensities are presented. A two-way ANOVA showed that the H-reflexes sizes for AIS B subject were significantly different based on stimulation intensity (F13 = 28.03, P = 0.003) but not based on time of testing (F1 = 6.39, P = 0.06). A similar result was also found for the normalized H-reflexes from AIS D subjects shown in Fig. 2f (stimulation intensity: F11 = 4.88, P < 0.001; time of test: F1 = 0.12, P = 0.72). The normalized H-reflexes from AIS C subjects shown in Fig. 2e are statistically significantly different based on stimulation intensity (F13 = 6.85, P < 0.001) and time of testing (F1 = 10.38, P = 0.002), suggesting that soleus H-reflex excitability in the left leg in AIS C subjects during standing was increased after training. The corresponding sigmoid fits for H-reflexes recorded on the ascending portion of the recruitment curve before and after training for AIS B, AIS C, and AIS D subjects are shown in Fig. 2g–i, respectively. The summarized results of the estimated sigmoid function parameters are given in Table 2. In AIS C subjects, the Hmax size increased after training (P < 0.05, paired t test pre-post training, Table 2), while the function m, S50, H-slope, and stimulation thresholds remained unaltered (P > 0.05). In AIS D subjects, the stimulus intensity corresponding to 50 % of Hmax, H-threshold, and Hmax was decreased after training (P < 0.05, paired t test pre-post training, Table 2), while the function m and H-slope remained unaltered (P > 0.05).
Fig. 2.
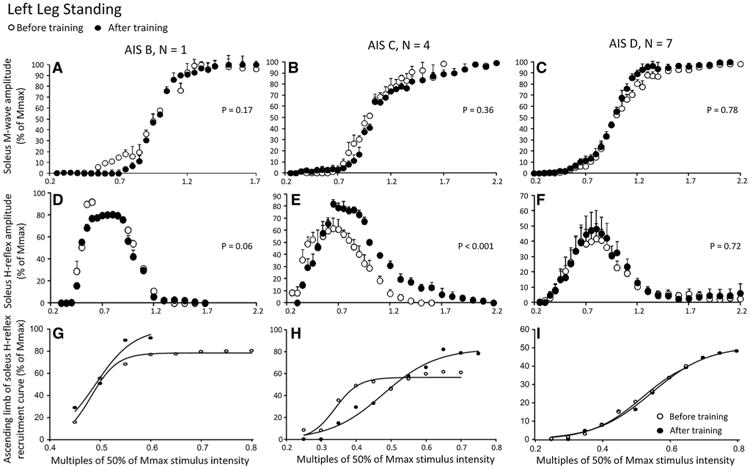
Soleus H-reflex and M-wave recruitment curves before and after locomotor training in the left leg during standing grouped separately for AIS B, AIS C, and AIS D subjects. a–c Mean M-wave sizes as a percentage of the maximal M-wave are plotted in multiples of 50 % of Mmax stimulus intensity. d–f Mean soleus H-reflex sizes as a percentage of the maximal M-wave are plotted in multiples of 50 % of Mmax stimulus intensity. g–i Sigmoid input–output relation for soleus H-reflexes elicited on the ascending part of the recruitment curve. The P values for graphs a–c are the results of the one-way ANOVAs conducted on the normalized M-waves from the start until the end of the recruitment curve before and after training. The P values for graphs d–e are the results of the two-way ANOVAs conducted on the normalized H-reflexes on the ascending portion of the H-reflex recruitment curve as a function of stimulus intensity and time of testing
Recruitment curves before and after locomotor training while seated
Soleus M-wave and H-reflex sizes at different stimulation intensities recorded from the right leg during the seated position, before and after training, and the associated sigmoid fits are shown in Fig. 3. In Fig. 3a–c, the normalized soleus M-wave sizes for AIS B, AIS C, and AIS D subjects are shown in multiples of 50 % Mmax stimulation intensity, respectively. One-way ANOVAs showed that the M-waves before and after training for all subject groups were not statistically significantly different (AIS B: F1 = 0.46, P = 0.49; AIS C: F1 = 0.68, P = 0.4; AIS D: F1 = 0.0066, P = 0.93). In Fig. 3d–f, the corresponding soleus H-reflexes as a percentage of the maximal M-wave are plotted against the normalized stimulation intensities. A two-way ANOVA showed that the H-reflexes sizes for AIS B subject shown in Fig. 3d are statistically significantly different based on stimulation intensity (F11 = 61.19, P < 0.001) but not based on time of testing (F1 = 0.4, P = 0.53). A similar result was found for H-reflexes from AIS C subjects (Fig. 3e; time of test: F1 = 0.0052, P = 0.94). A twoway ANOVA showed that the H-reflexes sizes from AIS D subjects shown in Fig. 3f are statistically significantly different at different stimulation intensities (F12 = 6.6, P < 0.001) and time of testing (F1 = 5.21, P = 0.02), suggesting that soleus H-reflex excitability in the right leg during seated was decreased after training in AIS D subjects. For each subject group, the corresponding sigmoid fits for H-reflexes recorded on the ascending portion of the recruitment curve before and after training are shown in Fig. 3g–i. The summarized results of the estimated sigmoid function parameters are given in Table 3. The decreased H-reflex excitability after training in AIS D subjects coincided with increased stimuli at 50 % Hmax, H-threshold and Hmax (P < 0.05; Table 3). In AIS C subjects, no statistically significant differences on the estimated sigmoid function parameters before and after training were found (P > 0.05; Table 3). In AIS B subject, although a statistical test was not possible, the soleus H-reflexes on the ascending portion of the recruitment curve were shifted to the left after training (Fig. 3g), the Hmax size was decreased, while the function m, the H-reflex slope, and stimulus at 50 % and 100 % Hmax were decreased.
Fig. 3.
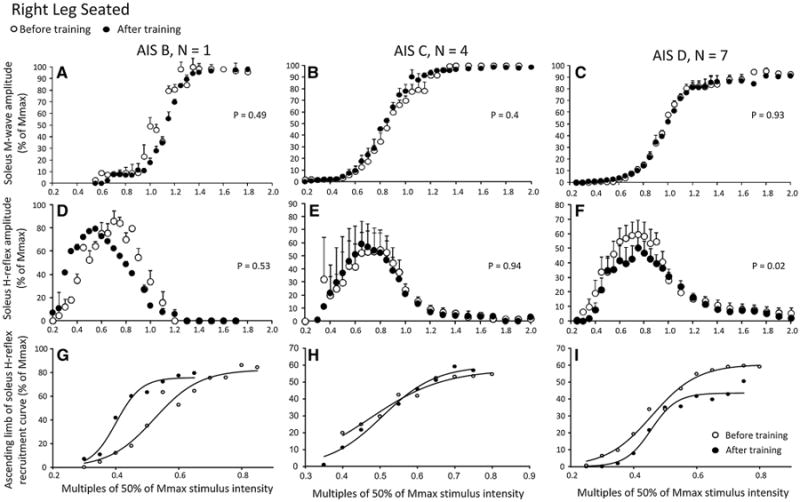
Soleus H-reflex and M-wave recruitment curves before and after locomotor training in the right leg during seated grouped separately for AIS B, AIS C, and AIS D subjects. a–c Mean M-wave sizes as a percentage of the maximal M-wave are plotted in multiples of 50 % of Mmax stimulus intensity. d–f Mean soleus H-reflex sizes as a percentage of the maximal M-wave are plotted in multiples of 50 % of Mmax stimulus intensity. g–i Sigmoid input–output relation for soleus H-reflexes elicited on the ascending part of the recruitment curve. The P values for graphs a–c are the results of the one-way ANOVAs conducted on the normalized M-waves from the start until the end of the recruitment curve before and after training. The P values for graphs d–e are the results of the two-way ANOVAs conducted on the normalized H-reflexes on the ascending portion of the H-reflex recruitment curve as a function of stimulus intensity and time of testing
Table 3. Estimated sigmoid function parameters.
| Hmax | m | S50 | H-slope | Stimulus at H-threshold | Stimulus at Hmax | ||
|---|---|---|---|---|---|---|---|
| Right leg seated | |||||||
| AIS Ba | Before training | 71.02 | 12.95 | 0.47 | 0.15 | 0.31 | 0.62 |
| After training | 57.26 | 55.23 | 0.37 | 0.03 | 0.33 | 0.41 | |
| AIS C | Before training | 54.57 ± 12.43 | 66.5 ± 36.4 | 0.48 ± 0.08 | 0.06 ± 0.02 | 0.41 ± 0.05 | 0.55 ± 0.10 |
| After training | 62.71 ± 13.64 | 39.78 ± 5.49 | 0.47 ± 0.06 | 0.05 ± 0.008 | 0.41 ± 0.05 | 0.52 ± 0.07 | |
| AIS D | Before training | 60.97 ± 9.94 | 27.37 ± 4.56 | 0.5 ± 0.03 | 0.09 ± 0.02 | 0.40 ± 0.03 | 0.59 ± 0.05 |
| After training | 51.87 ± 8.46 | 49.41 ± 31.1 | 0.6 ± 0.05 | 0.10 ± 0.02 | 0.50 ± 0.05 | 0.70 ± 0.07 | |
| Left leg seated | |||||||
| AIS A, B | Before training | 71.87 ± 13.48 | 23.84 ± 8.16 | 0.47 ± 0.02 | 0.10 ± 0.03 | 0.37 ± 0.05 | 0.56 ± 0.007 |
| After training | 56.85 ± 10.46 | 36.42 ± 11.41 | 0.45 ± 0.06 | 0.06 ± 0.01 | 0.39 ± 0.04 | 0.51 ± 0.08 | |
| AIS C | Before training | 70.61 ± 14.05 | 15.51 ± 6.34 | 0.53 ± 0.01 | 0.15 ± 0.06 | 0.38 ± 0.08 | 0.69 ± 0.04 |
| After training | 45.38 ± 11.73 | 14.99 ± 5.29 | 0.65 ± 0.07 | 0.15 ± 0.05 | 0.49 ± 0.02 | 0.80 ± 0.12 | |
| AIS D | Before training | 51.13 ± 11.33 | 34.35 ± 8.17 | 0.50 ± 0.03 | 0.07 ± 0.01 | 0.43 ± 0.03 | 0.58 ± 0.04 |
| After training | 64.17 ± 13.19 | 25.64 ± 3.4 | 0.52 ± 0.03 | 0.09 ± 0.02 | 0.43 ± 0.02 | 0.61 ± 0.05 | |
Sigmoid function parameters estimated from the sigmoid input–output relation of soleus H-reflexes on the ascending portion of the recruitment curve conducted for each subject separately and grouped based on AIS scale. Hmax: maximal H-reflex, m: slope parameter of the function, S50: Stimulus at 50 % of Hmax. Mean ± SEM. Italic values indicate cases of statistically significant differences after training compared to that observed before training based on a paired t test
For AIS A, sigmoid function ft results are from a single subject and thus a paired t test before and after training could not be performed
Soleus M-wave and H-reflex sizes at different stimulation intensities recorded from the left leg during seated before and after training and the associated sigmoid fits are shown in Fig. 4. In Fig. 4a–c, the normalized soleus M-wave sizes for AIS A-B, AIS C, and AIS D subjects are shown in multiples of 50 % Mmax stimulation intensity, respectively. The one-way ANOVA showed that the M-waves before and after training for all subject groups were not statistically significantly different (AIS A-B: F1 = 0.03, P = 0.86; AIS C: F1 = 0.04, P = 0.83; AIS D: F1 = 0.65, P = 0.41). In Fig. 4d–f, the corresponding normalized soleus H-reflex sizes are plotted against the normalized stimulation intensities. A two-way ANOVA showed that the H-reflexes sizes from the ascending limb of the recruitment curve for AIS A-B subjects were not statistically significantly different before and after training (F1 = 1.76, P = 0.19). A similar result was not found for H-reflexes from AIS C subjects indicated in Fig. 4e (stimulation intensity: F12 = 8.5, P < 0.001; time of test: F1 = 27.59, P < 0.001), suggesting that during seated the H-reflex excitability in the left leg was decreased in AIS C after training. In AIS D subjects (Fig. 4f), the H-reflexes sizes from the ascending limb of the recruitment curve were not statistically significantly different before and after training (F1 = 0.74, P = 0.39; 2-way ANOVA), but it should be noted that the derecruitment curve of the soleus H-reflex changed after training. The corresponding sigmoid fits for H-reflexes recorded on the ascending portion of the recruitment curve before and after training are shown in Fig. 4g–i. The summarized results of the estimated sigmoid function parameters are given in Table 3. Changes in Hmax size after training in AIS C subjects did not coincide with significant changes in any of the other estimated sigmoid function parameters (Table 3).
Fig. 4.
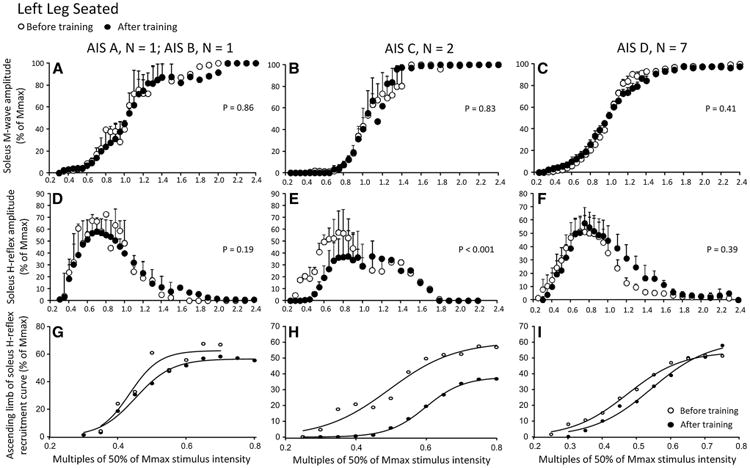
Soleus H-reflex and M-wave recruitment curves before and after locomotor training in the left leg during seated grouped separately for AIS A-B, AIS C, and AIS D subjects. a–c Mean M-wave sizes as a percentage of the maximal M-wave are plotted in multiples of 50 % of Mmax stimulus intensity. d–f Mean soleus H-reflex sizes as a percentage of the maximal M-wave are plotted in multiples of 50 % of Mmax stimulus intensity. g–i Sigmoid input–output relation for soleus H-reflexes elicited on the ascending part of the recruitment curve. The P values for graphs a–c are the results of the one-way ANOVAs conducted on the normalized M-waves from the start until the end of the recruitment curve before and after training. The P values for graphs d–e are the results of the two-way ANOVAs conducted on the normalized H-reflexes on the ascending portion of the H-reflex recruitment curve as a function of stimulus intensity and time of testing
Changes of estimated sigmoid function parameters in both limbs and body positions
To further elucidate changes in each sigmoid function parameter as a function of leg side, time of testing, body position, and AIS scale (AIS C and/or D), a multiple ANOVA for repeated measures was performed. For the estimated Hmax, an interaction within these levels was not found (P > 0.05). This negative result was also found for function m, and stimuli corresponding to 50 % Hmax and Hmax. The H-reflex slope was statistically significantly different as a function of leg side (F1 = 8.71, P = 0.004), while an interaction between leg side and AIS scale was found (F1 = 9.16, P = 0.003). Further, the stimulus corresponding to H-threshold varied significantly as a function of AIS scale (F1 = 6.31, P = 0.014), while an interaction was found between time of testing and body position (F1 = 4.03, P = 0.04).
Background EMG during seated and standing before and after locomotor training
The soleus EMG background activity, soleus modulation indices, and soleus/TA background EMG ratio from all SCI subjects during seated and standing for both legs are shown in Fig. 5. Significant differences and interactions for the soleus background EMG activity (F1 = 0.45, P = 0.5; 3-way ANOVA) and soleus modulation indices (F1 = 0.09, P = 0.75; 3-way ANOVA) were not found before and after training, leg side, or body position (Fig. 5a, b). The soleus/TA background EMG ratio was increased after training during seated and standing in the right leg (t12 = −3.05, P = 0.01; t13 = −2.3, P = 0.02; paired t test), but remained unchanged in the left leg (Fig. 5c). Significant interactions for the soleus/TA background EMG ratio among body positions, leg side, and time of testing were not found (F1 = 0.00008, P = 0.99; 3-way ANOVA).
Fig. 5.
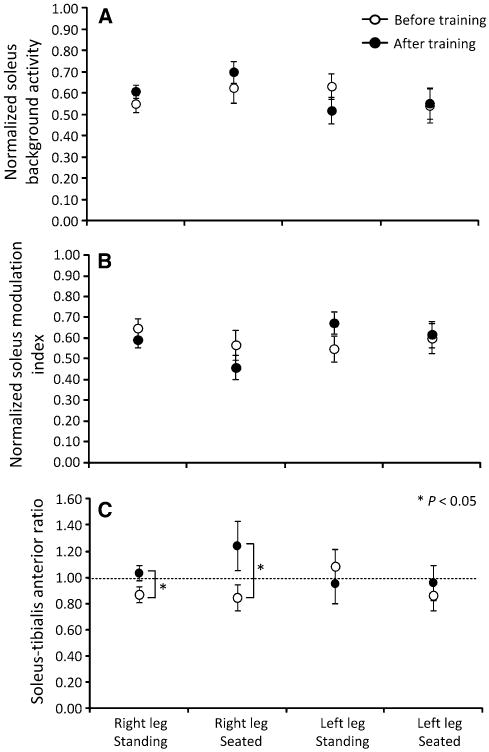
Background EMG activity. a Normalized soleus background EMG activity. b Modulation indices of soleus background EMG activity. c Background soleus/tibialis anterior ratio. Overall mean ± SEM from all SCI subjects before and after training for the right and left leg during seated and standing
Ankle clonus during walking before and after locomotor training
The mean right soleus number of bursts decreased significantly after training in AIS C subjects compared to that observed before training (P < 0.05, paired test) (Table 4). The reduced number of bursts coincided with decreased levels of energy and area after training (P < 0.05; Table 4). In the left leg, statistically significant changes in the clonus parameters after training were not observed (P > 0.05 for all parameters).
Table 4. Soleus clonic EMG bursts characteristics (ankle clonus) during assisted walking.
| Burst duration (ms) | Frequency (Hz) | Number of bursts | Energy | Area | ||
|---|---|---|---|---|---|---|
| Right leg | ||||||
| AIS A, B | Before training | 56.9 ± 7.8 | 5.1 ± 0.7 | 5.2 ± 1.2 | 224 ± 33 | 1,700 ± 109 |
| After training | 57.2 ± 0.8 | 6.2 ± 0.3 | 5.8 ± 1.1 | 197 ± 29 | 1,623 ± 240 | |
| AIS C | Before training | 62.3 ± 3.8 | 5.7 ± 0.7 | 7.3 ± 1.9 | 351 ± 45 | 2,863 ± 387 |
| After training | 64.4 ± 5.3 | 7.1 ± 1.2 | 4.0 ± 0.6 | 212 ± 21 | 1,823 ± 212 | |
| AIS D | Before training | 57.6 ± 4.5 | 6.3 ± 0.6 | 6.3 ± 1.8 | 300 ± 36 | 2,393 ± 252 |
| After training | 56.3 ± 3 | 5.6 ± 0.4 | 6.4 ± 1.3 | 223 ± 58 | 1,706 ± 439 | |
| Left leg | ||||||
| AIS A, B | Before training | 51.7 ± 2.9 | 6.1 ± 0.6 | 3.2 ± 0.04 | 150 ± 18 | 1,195 ± 165 |
| After training | 46 ± 2.3 | 6.2 ± 0.4 | 5.0 ± 0.4 | 133 ± 7.7 | 989 ± 88 | |
| AIS C | Before training | 51.4 ± 5.2 | 6.8 ± 1 | 5.1 ± 0.3 | 162 ± 41 | 1,258 ± 352 |
| After training | 66.8 ± 7.3 | 7.6 ± 0.8 | 4.6 ± 1.1 | 295 ± 97 | 2,690 ± 995 | |
| AIS D | Before training | 53.7 ± 4.1 | 5.7 ± 0.4 | 4.1 ± 0.2 | 207 ± 42 | 1,594 ± 330 |
| After training | 58.5 ± 4.9 | 6.3 ± 0.1 | 3.6 ± 0.2 | 249 ± 79 | 2,084 ± 693 |
Italic values indicate cases of statistically significant differences after training compared to that observed before training based on a paired t test
Discussion
This study demonstrated that locomotor training modifies the amplitude of the soleus monosynaptic motoneuron responses in a body position-dependent manner. The soleus H-reflex excitability was increased during standing in the right and left leg in AIS C subjects, and was decreased during seated in AIS C and D subjects. These findings demonstrate that the injured human spinal cord can adjust the reflex excitability level after locomotor training, presumably based on the demands of the motor task.
Soleus M-wave recruitments curves before and after locomotor training
The soleus M-wave recruitment curves remained unaltered (Figs. 1, 2, 3, 4a–c), verifying that recruitment order of motor axons did not change before and after training (Pierrot-Deseilligny and Mazevet 2000). For all cases, a clear threshold separation between Ia afferents and motor axons was possible, in that a maximum Ia afferent volley could be evoked with a very small or completely absent M-wave. This suggests that the soleus H-reflex reached its maximum amplitude before the antidromic motor volley collided with the orthodromic afferent volley. When collision between orthodromic and antidromic volleys does occur, the decrease in H-reflex size is not solely due to the collision per se, but can be partly due to non-reciprocal Ib inhibition and recurrent inhibition (Burke et al. 1984). In contrast, the H-reflex size on the ascending portion of the recruitment curve and at its maximum amplitude depends on the excitability of Ia afferents and on the excitability of the soleus motoneuron pool. Thus, our findings provide support for selective changes in the efficacy of Ia afferents to depolarize the soleus motoneurons and for the capability of soleus motoneurons to induce monosynaptic responses following stimulation of Ia afferents at varying intensities.
Soleus H-reflex excitability changes during standing and seated after locomotor training
The soleus H-reflex excitability on the ascending portion of the recruitment curves differed significantly after training, when compared to that observed before training, depending on the body position. With subjects seated, the H-reflex size from the onset of the recruitment curve until its maximum amplitude was decreased in the right leg in AIS D subjects (Fig. 3f) and in the left leg in AIS C subjects (Fig. 4e). In contrast, the H-reflex size from the onset of the recruitment curve until its maximum amplitude during standing was increased in the right (Fig. 1e) and left (Fig. 2e) legs of AIS C subjects but not in AIS A-B or AIS D subjects. Further, in AIS A-B subjects, the Hmax size was decreased after training during seated and standing. These findings suggest that people with motor incomplete SCI gained the ability to adapt the reflex excitability level at a given input based on the demands of the body position. Locomotor training decreased reflex excitability level in both body positions in people with motor complete SCI, but given the small number of participants in this study further research is required to define changes in the reflex excitability level in motor complete spinal lesions.
The increased reflex excitability in both legs in AIS C subjects during standing is consistent with the reported increased soleus H-reflex excitability following varying types of training in healthy control subjects (Aagaard et al. 2002; Lagerquist et al. 2006; Holtermann et al. 2007), past literature in human SCI (Yang et al. 1991), and the positive relationship between increased spinal excitability and better functional outcomes in spinal mice (Lee et al. 2009). The increased reflex excitability may be responsible for enhanced ankle stability and thus contributing to an improved leg function during standing.
The soleus/TA EMG background ratio was increased after training in the right leg during seated and standing (Fig. 5c), and was equal to 1 (equal background EMG between soleus and TA muscles) in the left leg, consistent with the reported coactivation of antagonistic ankle muscles during standing in non-injured subjects (Nielsen and Kagamihara 1992). During standing, Ib inhibition exerted from gastrocnemius medialis to soleus motoneurons is decreased, presynaptic inhibition of soleus Ia afferents is increased, and upon ankle coactivation, reciprocal inhibition is decreased in healthy subjects (Katz et al. 1988; Nielsen and Kagamihara 1992; Faist et al. 2006). Further, during the stance phase of walking, presynaptic inhibition of soleus Ia afferents increased in the same subjects tested here after locomotor training (Knikou and Mummidisetty 2014), while non-reciprocal Ib inhibition reversed to facilitation in non-trained individuals with SCI (Knikou 2012). These findings are consistent with observations of the function of these inhibitory mechanisms in healthy subjects (Mummidisetty et al. 2013). Thus, both presynaptic inhibition and Ib facilitation after training may promote weight bearing by reinforcing H-reflex excitability during standing, in motor incomplete SCI. A logical question that arises is whether the same mechanisms mediated the depression of soleus H-reflex excitability during the seated position tests. This adaptation may be the result of true spinal inhibition but may also represent disfacilitation of motoneurons due to suppression of spinal excitation by other systems such as the propriospinal system, which constitutes a disfacilitatory feedback for spinal motoneurons (Nicolas et al. 2001).
Further, the slope of the input–output relationship and the soleus background EMG activity remained unaltered after training during standing and seated positions (Tables 2, 3; Fig. 5a), implying that the recruitment gain of the soleus motoneuron pool remained unaltered. The decreased H-reflex size on the ascending limb of the recruitment curve in the seated position was expected to have been accompanied by a decreased recruitment gain. The lack of changes in the reflex recruitment gain may be related to the relationship between the inhibitory/facilita-tory background effects on the soleus motoneurons (Kernell and Hultborn 1990), the physiological properties of soleus motoneurons at the subliminal fringe (Pierrot-Deseilligny and Mazevet 2000), and their influence by more synaptic inputs compared to other motoneurons that are influenced by less synaptic inputs (Heckman et al. 2009).
While the slope remained unaltered, the stimulus corresponding to 50 % Hmax, H-threshold, and Hmax was increased in AIS D subjects, in whom the reflex excitability was decreased in the right leg during seated after training (Fig. 3f; Table 3). This finding indicates that after training, more stimulation intensity is required to activate the most excitable Ia afferent fibers that subsequently depolarize the lower threshold (most excitable) soleus motoneurons. The stimulus corresponding to H-reflex threshold expresses the number of active motoneurons or the spinal excitability level, which reflects the balance of excitatory and inhibitory inputs acting on the motoneuron pool (Capaday and Stein 1987). Therefore, the decreased spinal reflex excitability with the concomitant increased soleus H-reflex threshold indicates that spinal reflex excitability is altered along with the excitability level of Ia afferents. These changes of excitability may be related to the decreased ankle clonus and altered levels of cocontraction of ankle and knee antagonistic muscles during walking (Knikou and Mummidisetty 2014) after locomotor training in people with SCI.
At this point, the reflex excitability changes observed in both legs need to be considered. In AIS C subjects, spinal reflex excitability increased during standing after training in both legs (Figs. 1e,2e), but decreased during seated in the left leg (Fig. 4e), and remained unaltered in the right leg (Fig. 3e). In contrast, during standing spinal reflex excitability remained unaltered in AIS D subjects, but was reduced during seated in the right leg (Fig. 3f), and remained unaltered in the left leg (Fig. 4f). While a comprehensive evaluation of neuronal changes after locomotor training in both legs is not reported in the literature, the asymmetrical changes of spinal reflex excitability may be related to differences of neuronal reorganization within each limb. For example, in this group of individuals with SCI, the soleus H-reflex from the right leg was modulated in an opposite manner to that observed in the left leg, for the same phase of the step cycle after training in 4 subjects (Knikou 2013), and the long-latency TA flexor reflex was decreased in the right leg but increased in the left leg during BWS-assisted stepping after training in all subjects (Smith et al. 2014). Further, in 4 out of 5 AIS C subjects, the left leg was stronger from the right leg with the 5th subject having equal muscle strength in both legs (Table 1). Thus, in AIS C subjects, the stronger limb corresponded with decreased H-reflex excitability in the seated position after training. Last, the asymmetrical changes of spinal reflex excitability in both legs may be related to the type of SCI (cervical vs. thoracic), to the number, localization, and amount of damaged and spared spinal and supraspinal pathways (Lee et al. 2005; Rossignol et al. 2009), and to the hand/foot dominance (Tan 1990).
Sources for the changes in H-reflex excitability observed in this study may include modifications in the intrinsic properties of soleus motoneurons, excitability profile of the motoneuron pool, properties of group Ia afferents, function of spinal interneurons, and modifications on the descending control of spinal reflex networks. Animal studies have demonstrated that locomotor training changes the cellular and electrical properties of spinal motoneurons, synaptic inputs, activity of synaptic proteins, ion conductances, and the motoneuronal soma size in the absence of supraspinal descending control (Beaumont et al. 2004; Petruska et al. 2007; Dunlop 2008; Ilha et al. 2011). Further, in people with SCI, motor cortex activation and corticospinal excitability are increased (Dobkin 2000; Winchester et al. 2005; Thomas and Gorassini 2005), and cortical facilitation of late flexor reflexes reverses to cortical inhibition (Hajela et al. 2013) after locomotor training. Based on these findings, soleus spinal reflex excitability adaptation after training involved both supraspinal and spinal neuronal pathways in individuals with motor incomplete SCI.
Conclusion
In this study, we postulated that there was a systematic modification in monosynaptic motoneuron responses to stimulation of Ia afferents in people with chronic SCI after locomotor training. This adaptation of spinal reflex excitability occurred in a body position-dependent manner. Spinal reflex excitability was increased during standing in both legs in AIS C subjects, likely to reinforce the tonic activation of soleus motoneurons. The decreased spinal reflex excitability in AIS D subjects during seated could reflect decreased pathological changes associated with spasticity. Further research is needed to comprehensively investigate the source of this neuronal reorganization. A deeper understanding of changes in neuronal architecture and synaptic connectivity as well as their relation to recovery of motor function may lead to optimal use of currently available interventions, and the development of new therapeutic innovations, and thus further the functional improvements for individuals with SCI.
Acknowledgments
Authors thank all volunteers for participating in many experimental and locomotor training sessions, and Chaithanya K. Mummidisetty for his help during data acquisition. This work was supported by grants from The Craig Neilsen Foundation (Grant No. 83607), and from the New York State Department of Health, Wadsworth Center, Spinal Cord Injury Research Board (Grant No. C023690) awarded to Maria Knikou. Andrew C. Smith is supported by NIH T32 HD057845 and by the Foundation for Physical Therapy Promotion of Doctoral Studies. The funding sources had no involvement in study design, data collection, data analysis, data interpretation, and decision to publish.
Footnotes
All work was completed at the Rehabilitation Institute of Chicago (Chicago, IL 60611, USA).
Conflict of interest The authors have no conflicts of interest to report.
Contributor Information
Andrew C. Smith, Northwestern University Interdepartmental Neuroscience Program, Chicago, IL 60611, USA
William Zev Rymer, Northwestern University Interdepartmental Neuroscience Program, Chicago, IL 60611, USA; Sensory Motor Performance Program, Rehabilitation Institute of Chicago, Chicago, IL 60611, USA; Physical Medicine and Rehabilitation, Northwestern University Feinberg Medical School, Chicago, IL 60611, USA.
Maria Knikou, Email: Maria.Knikou@csi.cuny.edu, Sensory Motor Performance Program, Rehabilitation Institute of Chicago, Chicago, IL 60611, USA; Physical Medicine and Rehabilitation, Northwestern University Feinberg Medical School, Chicago, IL 60611, USA; Graduate Center, The City University of New York, New York, NY 10016, USA; Department of Physical Therapy, College of Staten Island, 2800 Victory Blvd, Bldg 5N-207, Staten Island, NY 10314, USA.
References
- Aagaard P, Simonsen EB, Anderson JL, Magnusson P, DyhrePoulsen P. Neural adaptation to resistance training: changes in evoked V-wave and H-reflex responses. J Appl Physiol. 2002;92:2309–2318. doi: 10.1152/japplphysiol.01185.2001. [DOI] [PubMed] [Google Scholar]
- Beaumont E, Gardiner P. Effects of daily spontaneous running on the electrophysiological properties of hindlimb motoneurons in rats. J Physiol Lond. 2002;540:129–138. doi: 10.1113/jphysiol.2001.013084. [DOI] [PMC free article] [PubMed] [Google Scholar]
- Beaumont E, Gardiner PF. Endurance training alters the biophysical properties of hindlimb motoneurons in rats. Muscle Nerve. 2003;27:228–236. doi: 10.1002/mus.10308. [DOI] [PubMed] [Google Scholar]
- Beaumont E, Houle JD, Peterson CA, Gardiner PF. Passive exercise and fetal spinal cord transplant both help to restore motoneuronal properties after spinal cord transection in rats. Muscle Nerve. 2004;29:234–242. doi: 10.1002/mus.10539. [DOI] [PubMed] [Google Scholar]
- Bennett D, Li Y, Harvey PJ, Gorassini M. Evidence for plateau potentials in tail motoneurons of awake chronic spinal rats with spasticity. J Neurophysiol. 2001;86:1972–1982. doi: 10.1152/jn.2001.86.4.1972. [DOI] [PubMed] [Google Scholar]
- Brinkworth RS, Tuncer M, Tucker KJ, Jaberzadeh S, Türker KS. Standardization of H-reflex analyses. J Neurosci Methods. 2007;162:1–7. doi: 10.1016/j.jneumeth.2006.11.020. [DOI] [PubMed] [Google Scholar]
- Burke D, Gandevia SC, McKeon B. Monosynaptic and oligo-synaptic contributions to human ankle jerk and H-reflex. J Neurophysiol. 1984;52:435–448. doi: 10.1152/jn.1984.52.3.435. [DOI] [PubMed] [Google Scholar]
- Button DC, Kalmar JM, Gardiner K, Marqueste T, Zhong H, Roy RR, Edgerton VR, Gardiner PF. Does elimination of afferent input modify the changes in rat motoneurone properties that occur following chronic spinal cord transection? J Physiol Lond. 2008;586:529–544. doi: 10.1113/jphysiol.2007.141499. [DOI] [PMC free article] [PubMed] [Google Scholar]
- Capaday C. Neurophysiological methods for studies of the motor system in freely moving human subjects. J Neurosci Methods. 1997;74:201–218. doi: 10.1016/s0165-0270(97)02250-4. [DOI] [PubMed] [Google Scholar]
- Capaday C, Stein RB. Difference in the amplitude of the human soleus H-reflex during walking and running. J Physiol Lond. 1987;392:513–522. doi: 10.1113/jphysiol.1987.sp016794. [DOI] [PMC free article] [PubMed] [Google Scholar]
- Carroll TJ, Riek S, Carson RG. Reliability of the input–output properties of the cortico-spinal pathway obtained from transcranial magnetic and electrical stimulation. J Neurosci Methods. 2001;112:193–202. doi: 10.1016/s0165-0270(01)00468-x. [DOI] [PubMed] [Google Scholar]
- Cope TC, Bodine SC, Fournier M, Edgerton VR. Soleus motor units in chronic spinal transected cats: physiological and morphological alterations. J Neurophysiol. 1986;55:1202–1220. doi: 10.1152/jn.1986.55.6.1202. [DOI] [PubMed] [Google Scholar]
- Deliagina TG, Beloozerova IN, Zelenin PV, Orlovsky GN. Spinal and supraspinal postural networks. Brain Res Rev. 2008;57:212–221. doi: 10.1016/j.brainresrev.2007.06.017. [DOI] [PMC free article] [PubMed] [Google Scholar]
- Devanne H, Lavoie BA, Capaday C. Input–output properties and gain changes in the human corticospinal pathway. Exp Brain Res. 1997;114:329–338. doi: 10.1007/pl00005641. [DOI] [PubMed] [Google Scholar]
- Dietz V, Colombo G, Jensen L. Locomotor activity in spinal man. Lancet. 1994;344:1260–1263. doi: 10.1016/s0140-6736(94)90751-x. [DOI] [PubMed] [Google Scholar]
- Dietz V, Wirtz M, Curt A, Colombo G. Locomotor pattern in paraplegic patients: training effects and recovery of spinal cord function. Spinal Cord. 1998;36:380–390. doi: 10.1038/sj.sc.3100590. [DOI] [PubMed] [Google Scholar]
- Dimitrijevic MR, Nathan PW, Sherwood AM. Clonus: the role of central mechanisms. J Neurol Neurosurg Psychiatry. 1980;43:321–332. doi: 10.1136/jnnp.43.4.321. [DOI] [PMC free article] [PubMed] [Google Scholar]
- Dobkin BH. Spinal and supraspinal plasticity after incomplete spinal cord injury: correlations between functional magnetic resonance imaging and engaged locomotor networks. Prog Brain Res. 2000;128:99–111. doi: 10.1016/S0079-6123(00)28010-2. [DOI] [PubMed] [Google Scholar]
- Dunlop SA. Activity-dependent plasticity: implications for recovery after spinal cord injury. Trends Neurosci. 2008;31:410–418. doi: 10.1016/j.tins.2008.05.004. [DOI] [PubMed] [Google Scholar]
- Edgerton VR, Tillakaratne NJ, Bigbee AJ, de Leon RD, Roy RR. Plasticity of the spinal neural circuitry after injury. Annu Rev Neurosci. 2004;27:145–167. doi: 10.1146/annurev.neuro.27.070203.144308. [DOI] [PubMed] [Google Scholar]
- Faist M, Hoefer C, Hodapp M, Dietz V, Berger W, Duysens J. In humans Ib facilitation depends on locomotion while suppression of Ib inhibition requires loading. Brain Res. 2006;1076:87–92. doi: 10.1016/j.brainres.2005.12.069. [DOI] [PubMed] [Google Scholar]
- Field-Fote EC, Roach KE. Influence of a locomotor training approach on walking speed and distance in people with chronic spinal cord injury: a randomized clinical trial. Phys Ther. 2011;91:48–60. doi: 10.2522/ptj.20090359. [DOI] [PMC free article] [PubMed] [Google Scholar]
- Gazula VR, Roberts M, Luzzio C, Jawad AF, Kalb RG. Effects of limb exercise after spinal cord injury on motor neuron dendrite structure. J Comp Neurol. 2004;476:130–145. doi: 10.1002/cne.20204. [DOI] [PubMed] [Google Scholar]
- Hajela N, Mummidisetty CK, Smith AC, Knikou M. Corticospinal reorganization after locomotor training in a person with motor incomplete paraplegia. Biomed Res Int. 2013;2013:516427. doi: 10.1155/2013/516427. [DOI] [PMC free article] [PubMed] [Google Scholar]
- Heckman CJ, Mottram C, Quinlan K, Theiss R, Schuster J. Motoneuron excitability: the importance of neuromodulatory inputs. Clin Neurophysiol. 2009;120:2040–2054. doi: 10.1016/j.clinph.2009.08.009. [DOI] [PMC free article] [PubMed] [Google Scholar]
- Heckmann CJ, Gorassini MA, Bennett DJ. Persistent inward currents in motoneuron dendrites: implications for motor output. Muscle Nerve. 2005;31:135–156. doi: 10.1002/mus.20261. [DOI] [PubMed] [Google Scholar]
- Hochman S, McCrea DA. Effects of chronic spinalization on ankle extensor motoneurons. I. Composite monosynaptic Ia EPSPs in four motoneuron pools. J Neurophysiol. 1994a;71:1452–1467. doi: 10.1152/jn.1994.71.4.1452. [DOI] [PubMed] [Google Scholar]
- Hochman S, McCrea DA. Effects of chronic spinalization on ankle extensor motoneurons II. Motoneuron electrical properties. J Neurophysiol. 1994b;71:1468–1479. doi: 10.1152/jn.1994.71.4.1468. [DOI] [PubMed] [Google Scholar]
- Holtermann A, Roeleveld K, Engstrom M, Sand T. Enhanced H-reflex with resistance training is related to increased rate of force development. Eur J Appl Physiol. 2007;101:301–312. doi: 10.1007/s00421-007-0503-y. [DOI] [PubMed] [Google Scholar]
- Hornby TG, Rymer WZ, Benz EN, Schmit BD. Windup of flexion reflexes in chronic human spinal cord injury: a marker for neuronal plateau potentials? J Neurophysiol. 2003;89:416–426. doi: 10.1152/jn.00979.2001. [DOI] [PubMed] [Google Scholar]
- Hornby TG, Zemon DH, Campbell D. Robotic-assisted, bodyweight-supported treadmill training in individuals following motor incomplete spinal cord injury. Phys Ther. 2005;85:52–66. [PubMed] [Google Scholar]
- Ilha J, Centenaro LA, Broetto Cunha N, de Souza DF, Jaeger M, do Nascimento PS, Kolling J, Ben J, Marcuzzo S, Wyse AT, Gottfried C, Achaval M. The beneficial effects of treadmill step training on activity-dependent synaptic and cellular plasticity markers after complete spinal cord injury. Neurochem Res. 2011;36:1046–1055. doi: 10.1007/s11064-011-0446-x. [DOI] [PubMed] [Google Scholar]
- Katz R, Meunier S, Pierrot-Deseilligny E. Changes in pre-synaptic inhibition of Ia fibres in man while standing. Brain. 1988;111:417–437. doi: 10.1093/brain/111.2.417. [DOI] [PubMed] [Google Scholar]
- Kernell D, Hultborn H. Synaptic effects on recruitment gain: a mechanism of importance for the input–output relations of motoneurone pools? Brain Res. 1990;507:176–179. doi: 10.1016/0006-8993(90)90542-j. [DOI] [PubMed] [Google Scholar]
- Klimstra M, Zehr EP. A sigmoid function is the best fit for the ascending limb of the Hoffmann reflex recruitment curve. Exp Brain Res. 2008;186:93–105. doi: 10.1007/s00221-007-1207-6. [DOI] [PubMed] [Google Scholar]
- Knikou M. Hip-phase-dependent flexion reflex modulation and expression of spasms in patients with spinal cord injury. Exp Neurol. 2007;204:171–181. doi: 10.1016/j.expneurol.2006.10.006. [DOI] [PMC free article] [PubMed] [Google Scholar]
- Knikou M. The H-reflex as a probe: pathways and pitfalls. J Neurosci Methods. 2008;171:1–12. doi: 10.1016/j.jneumeth.2008.02.012. [DOI] [PubMed] [Google Scholar]
- Knikou M. Function of group Ib inhibition during assisted stepping in human spinal cord injury. J Clin Neurophysiol. 2012;29:271–277. doi: 10.1097/WNP.0b013e318257c2b7. [DOI] [PubMed] [Google Scholar]
- Knikou M. Functional reorganization of soleus H-reflex modulation during stepping after robotic-assisted step training in people with complete and incomplete spinal cord injury. Exp Brain Res. 2013;228:279–296. doi: 10.1007/s00221-013-3560-y. [DOI] [PubMed] [Google Scholar]
- Knikou M, Mummidisetty CK. Reduced reciprocal inhibition during assisted stepping in human spinal cord injury. Exp Neurol. 2011;231:104–112. doi: 10.1016/j.expneurol.2011.05.021. [DOI] [PubMed] [Google Scholar]
- Knikou M, Mummidisetty CK. Locomotor training improves premotoneuronal control after spinal cord injury. J Neurophysiol. 2014;111:2264–2275. doi: 10.1152/jn.00871.2013. [DOI] [PubMed] [Google Scholar]
- Knikou M, Angeli CA, Ferreira CK, Harkema SJ. Soleus H-reflex gain, threshold, and amplitude as function of body posture and load in spinal cord intact and injured subjects. Int J Neurosci. 2009;119:2056–2073. doi: 10.1080/00207450903139747. [DOI] [PubMed] [Google Scholar]
- Lagerquist O, Zehr EP, Docherty D. Increased spinal reflex excitability is not associated with neural plasticity underlying the cross-education effect. J Appl Physiol. 2006;100:83–90. doi: 10.1152/japplphysiol.00533.2005. [DOI] [PubMed] [Google Scholar]
- Lee JK, Emch GS, Johnson CS, Wrathall JR. Effect of spinal cord injury severity on alterations of the H-reflex. Exp Neurol. 2005;196:430–440. doi: 10.1016/j.expneurol.2005.08.018. [DOI] [PubMed] [Google Scholar]
- Lee HJ, Jakovcevski I, Radonjic N, Hoelters L, Schachner M, Irintchev A. Better functional outcome of compression spinal cord injury in mice is associated with enhanced H-reflex responses. Exp Neurol. 2009;216:365–374. doi: 10.1016/j.expneurol.2008.12.009. [DOI] [PubMed] [Google Scholar]
- Manella KJ, Field-Fote EC. Modulatory effects of locomotor training on extensor spasticity in individuals with motor-incomplete spinal cord injury. Restor Neurol Neurosci. 2013;31:633–646. doi: 10.3233/RNN-120255. [DOI] [PubMed] [Google Scholar]
- Mummidisetty CK, Bohórquez J, Thomas CK. Automatic analysis of EMG during clonus. J Neurosci Methods. 2012;204:35–43. doi: 10.1016/j.jneumeth.2011.10.017. [DOI] [PMC free article] [PubMed] [Google Scholar]
- Mummidisetty CK, Smith AC, Knikou M. Modulation of reciprocal and presynaptic inhibition during robotic-assisted stepping in humans. Clin Neurophysiol. 2013;124:557–564. doi: 10.1016/j.clinph.2012.09.007. [DOI] [PubMed] [Google Scholar]
- Nicolas G, Marchand-Pauvert V, Burke D, Pierrot-Deseilligny E. Corticospinal excitation of presumed cervical propriospinal neurones and its reversal to inhibition in humans. J Physiol Lond. 2001;533:903–919. doi: 10.1111/j.1469-7793.2001.t01-1-00903.x. [DOI] [PMC free article] [PubMed] [Google Scholar]
- Nielsen J, Kagamihara Y. The regulation of disynaptic reciprocal Ia inhibition during co-contraction of antagonistic muscles in man. J Physiol Lond. 1992;456:373–391. doi: 10.1113/jphysiol.1992.sp019341. [DOI] [PMC free article] [PubMed] [Google Scholar]
- Petruska JC, Ichiyama RM, Jindrich DL, Crown ED, Tansey KE, Roy RR, Edgerton VR, Mendell LM. Changes in motoneuron properties and synaptic inputs related to step training after spinal cord transection in rats. J Neurosci. 2007;27:4460–4471. doi: 10.1523/JNEUROSCI.2302-06.2007. [DOI] [PMC free article] [PubMed] [Google Scholar]
- Pierrot-Deseilligny E, Burke D. Spinal and corticospinal mechanisms of movement. Cambridge University Press; New York: 2012. [Google Scholar]
- Pierrot-Deseilligny E, Mazevet D. The monosynaptic reflex: a tool to investigate motor control in humans. Interests and limits. Neurophysiol Clin. 2000;30:67–80. doi: 10.1016/s0987-7053(00)00062-9. [DOI] [PubMed] [Google Scholar]
- Rossignol S, Frigon A. Recovery of locomotion after spinal cord injury: some facts and mechanisms. Annu Rev Neurosci. 2011;34:413–440. doi: 10.1146/annurev-neuro-061010-113746. [DOI] [PubMed] [Google Scholar]
- Rossignol S, Barriere G, Alluin O, Frigon A. Re-expression of locomotor function after partial spinal cord injury. Physiol. 2009;24:127–139. doi: 10.1152/physiol.00042.2008. [DOI] [PubMed] [Google Scholar]
- Smith AC, Mummidisetty CK, Rymer WZ, Knikou M. Loco-motor training alters the behavior of flexor reflexes during walking in human spinal cord injury. J Neurophysiol. 2014 doi: 10.1152/jn.00308.2014. [DOI] [PubMed] [Google Scholar]
- Tan U. There is a close relationship between hand skill and the excitability of motor neurons innervating the postural soleus muscle in left-handed subjects. Int J Neurosci. 1990;51:25–34. doi: 10.3109/00207459009000505. [DOI] [PubMed] [Google Scholar]
- Thomas SL, Gorassini MA. Increases in corticospinal tract function by treadmill training after incomplete spinal cord injury. J Neurophysiol. 2005;94:2844–2855. doi: 10.1152/jn.00532.2005. [DOI] [PubMed] [Google Scholar]
- Trimble MH, Behrman AL, Flynn SM, Thigpen MT, Thompson FJ. Acute effects of locomotor training on overground walking speed and H-reflex modulation in individuals with incomplete spinal cord injury. J Spinal Cord Med. 2001;24:74–80. doi: 10.1080/10790268.2001.11753558. [DOI] [PubMed] [Google Scholar]
- Wallace DM, Ross BH, Thomas CK. Motor unit behavior during clonus. J Appl Physiol. 2005;99:2166–2172. doi: 10.1152/japplphysiol.00649.2005. [DOI] [PubMed] [Google Scholar]
- Wernig A, Müller S, Nanassy A, Cagol E. Laufband therapy based on rules of spinal locomotion is effective in spinal cord injured persons. Eur J Neurosci. 1995;7:823–829. doi: 10.1111/j.1460-9568.1995.tb00686.x. [DOI] [PubMed] [Google Scholar]
- Winchester P, McColl R, Querry R, Foreman N, Mosby J, Tansey K, Williamson J. Changes in supraspinal activation patterns following robotic locomotor therapy in motor-incomplete spinal cord injury. Neurorehabil Neural Repair. 2005;19:313–324. doi: 10.1177/1545968305281515. [DOI] [PubMed] [Google Scholar]
- Wirz M, Zemon DH, Rupp R, Scheel A, Colombo G, Dietz V, Hornby TG. Effectiveness of automated locomotor training in patients with chronic incomplete spinal cord injury: a multicenter trial. Arch Phys Med Rehab. 2005;86:672–680. doi: 10.1016/j.apmr.2004.08.004. [DOI] [PubMed] [Google Scholar]
- Wolpaw JR. Spinal cord plasticity in acquisition and maintenance of motor skills. Acta Physiol. 2007;189:155–169. doi: 10.1111/j.1748-1716.2006.01656.x. [DOI] [PubMed] [Google Scholar]
- Yang JF, Fung J, Edamura M, Blunt R, Stein RB, Barbeau H. H-reflex modulation during walking in spastic paretic subjects. Can J Neurol Sci. 1991;18:443–452. doi: 10.1017/s0317167100032133. [DOI] [PubMed] [Google Scholar]
- Zehr EP, Loadman PM, Hundza SR. Neural control of rhythmic arm cycling after stroke. J Neurophysiol. 2012;108:891–905. doi: 10.1152/jn.01152.2011. [DOI] [PMC free article] [PubMed] [Google Scholar]