

Abstract
Background
The purpose of this study was to analyse the prevalence of postmenopausal osteoporosis risk factors and to analyse the T-score variability in spine and hip according to the associated risk factors.
Methods
This is a retrospective study (2003-2007) including 177 female patients with postmenopausal osteoporosis. The patients were separated in seven groups according to the number of risk factors per case. The T-score was compared between this groups using unpaired t-Student test.
Results
The most frequent risk factor was early menopause (44.63%), followed by low consumption of dairy products (37.29%), coffee consumption (25.99%), sedentary lifestyle (20.9%), smoking (19.21%), delayed menarche (15.25%), low body mass index (10.71%), nulliparity (7.91%), alcohol consumption (0.56%). The maximum number of risk factors per case was six. The T-score decreased with increasing number of risk factors. T-score differences are statistically significant when comparing cases with 6 risk factors to cases with 5 risk factors (P=0.0315 in spine; P=0.0088 in hip), 4 risk factors (P=0.0076 in spine; P=0.043 in hip), 3 risk factors (P<0.0001 in spine; P=0.0205 in hip), 2 risk factors (P=0.0012 in spine; P<0.0001 in hip), a single risk factor (P<0.001 in spine and hip) and no risk factor (P=0.0075 in spine; P=0.0006 in hip).
Conclusion
Association of several risk factors leads to decrease of T-score so being able to avoid any such factors may contribute to a better bone mineral density. This could be achieved by the education of female population regarding postmenopausal osteoporosis risk factors, followed by adopting an appropriate lifestyle and diet.
Keywords: Postmenopausal osteoporosis, Risk factors, T-score
Introduction
Osteoporosis is the most common metabolic bone disorder (1) and is characterized by decreased bone strength that leads to an increased risk of fracture (2). Postmenopausal osteoporosis, a subtype of involutional osteoporosis (3) occurs in women within a 20 year time frame after meno-pause (4), the bone mass recording a rapid decrease in the first 10 years and a slower decrease in the following years (5). According to the World Health Organization, more than 30% of post-menopausal women suffer of osteoporosis; with a T-score of more than 2.5 standard deviations below the young adult mean (6).
The predisposing factors of postmenopausal osteoporosis include factors inducing the accumulation of reduced peak bone mass and an excessive bone loss during postmenopause. These factors have genetic, endocrine and lifestyle components (7). The risk factors in osteoporosis have been subject to multiple researches. The results of a study on body mass index, sedentary lifestyle, dairy products in the diet, smoking, family history of osteoporosis and the number of pregnancies as risk factors for osteoporosis show that reduced bone mineral density is not accurately predictable by these factors (8). According to the results of another research, a number of postmenopause years greater than 7, as well as early menopause (under the age of 40), are the most important individual risk factors for osteoporosis, while obesity has a protective effect against the occurrence of osteoporosis (9). Another study shows that the average dietary calcium intake in postmenopausal women aged 45 and over is insufficient, especially for those diagnosed with osteoporosis or older women (10). Further analysis of risk factors suggests that in addition to the known risk factors such as menopause, Caucasian and Asian descent, frail constitution, physical inactivity, smoking, alcohol usage, poor calcium and vitamin D intake, use of corticosteroids, another risk factor for osteoporosis would be depression (11). A recent study shows that some of the risk factors are common and other are different for spinal and, respectively, femoral osteoporosis (12).
The assessment of risk factors involved in osteoporosis etiopathogeny is important for the case detection strategy. Identifying individuals with increased risk of developing this disease allows the diagnosis of a low bone mineral density prior to the occurrence of osteoporosis, which can be prevented by implementing a prophylactic treatment. Osteoporosis can also be diagnosed before a fracture occurs, which is all the more important since most cases of osteoporosis are asymptomatic, and a diagnosis is often carried out when the first osteoporotic-based fracture occurs. More than 75% of women which are likely to develop this disease are not identified (13). It is not mandatory, however, that patients with risk factors develop osteopenia or osteoporosis. The analysis of a single risk factor does not suffice for efficiently identifying the patients with risk of developing osteoporosis, and the analysis of risk factors cannot replace the bone densitometry investigation which is the basis of an accurate diagnosis of osteoporosis (14).
The aim of this study was to analyse the prevalence of different risk factors in postmenopausal osteoporosis as well as the changes in T-score measured at spine and hip level, according to the presence and association of multiple risk factors.
Materials and Methods
This is a retrospective 5 year study (2003-2007) based on the analysis of osteoporosis risk factors and T-score in patients with postmenopausal osteoporosis admitted in the Clinical County Hospital no. 1 from Timisoara. The data were collected from medical records.
We selected 177 female patients with postmenopausal osteoporosis from 417 patients diagnosed with osteoporosis. This study focuses strictly on postmenopausal osteoporosis so patients with other types of osteoporosis such as senile osteoporosis, idiopathic juvenile osteoporosis, secondary osteoporosis as well as cases with complex etiopathogeny and male patients with osteoporosis were excluded. We also excluded patients undergoing treatments that affect bone metabolism (corticosteroid therapy for more than 3 months).
The investigated risk factors are: family history of osteoporosis, delayed menarche, early menopause, sedentary lifestyle, low body mass index, low consumption of milk and dairy products, nulliparity, coffee consumption, smoking and alcoholism. A positive family history of osteoporosis was considered if the mother or sister developed osteoporosis, taking into account also the cases where osteoporosis was not diagnosed for these first degree relatives, but they suffered a hip fracture at old age. Delayed menarche was considered the menarche occurring after the age of 16, and early menopause was considered the menopause occurring before the age of 45. Consumption of milk and dairy products was recorded as a risk factor in cases where patients had no intake or a low intake of such products. Coffee consumption was taken into account as a risk factor if it exceeded 2 cups per day, smoking if the number of cigarettes smoked per day exceeded ten, and alcohol if the patients were consistently drinking high quantities. The body mass index (BMI) was considered as a risk factor if it was lower than 19 kg/m2. It was calculated using the formula: BMI = W/H2, where W is the body weight and H is the height.
Bone densitometry was performed at the same hospital with a Hologic QDR Delphi W bone densitometer. The investigation focused on the hip and spine. Osteoporosis is diagnosed when the bone mineral density is 2,5 or more standard deviations below the young adult mean (6). T-score is determined based on the difference between the patient’s bone mineral density (BMD) and the mean BMD of a healthy adult population (relevant in terms of gender and race), reported to the standard deviation of the respective population (15).
In order to analyse the T-score variations in relation to clustering of risk factors, the patients were separated in seven groups, based on the absence or presence of these risk factors, from cases with no risk factors to cases with six associated risk factors. We tested the Gaussian distribution of the T-score values for each group using the Kolmogorov-Smirnov test. The results showed that for each group the data were normally distributed (normality test P value >0.10). The unpaired t-Student test was used to compare the values of T-score between the groups of patients with a different number of risk factors in order to evaluate statistically significant differences. For statistical tests, the following interpretation of two-tail P values was used: P < 0.05 = significant, P < 0.01 = highly significant, P < 0.001 = extremely significant, P > 0.05 = not significant (16). Statistical analysis and graphical representation were performed using GraphPad Prism 5 and Excel software.
Results
Out of the 177 patients with postmenopausal osteoporosis, the vast majority (84.75%) originated from urban area. The remaining 15.25% were from rural area. The average age of the group was 58 years ± 7.65. The minimum age was 39 years (one case, where menopause was surgically induced) and the maximum age was 69 years. The most frequent risk factor, from the ten risk factors under analysis, was early menopause, present in almost half the cases (44.63%). Low consumption of milk and dairy products was recorded in 37.29% of the cases. The following risk factors in descending order were coffee consumption (25.99%), sedentary lifestyle (20.9%), smoking (19.21%), positive family history of osteoporosis (17.51%), delayed menarche (15.25%), low body mass index (10.71%), nulliparity (7.91%) and alcohol consumption (0.56%). Alcoholism was the risk factor with the lowest prevalence.
Not all patients presented risk factors. There were 4.52% cases with no risk factors in the lot under analysis. The cases with a single risk factor were higher, in proportion of 26.55%. The most frequent cases were the cases with two risk factors, accounting to a percentage of 31.64% of the total number of cases. The cases with two risk factors were in proportion of 22.03%. The other cases, with four, five and six risk factors were less frequent (9.04%, 2.83% and 3.39% respectively). There were no cases with more than six associated risk factors (Fig. 1). The most frequent were the cases with one, two and three risk factors, totalling together 80.22% from the total number of cases.
Fig. 1:
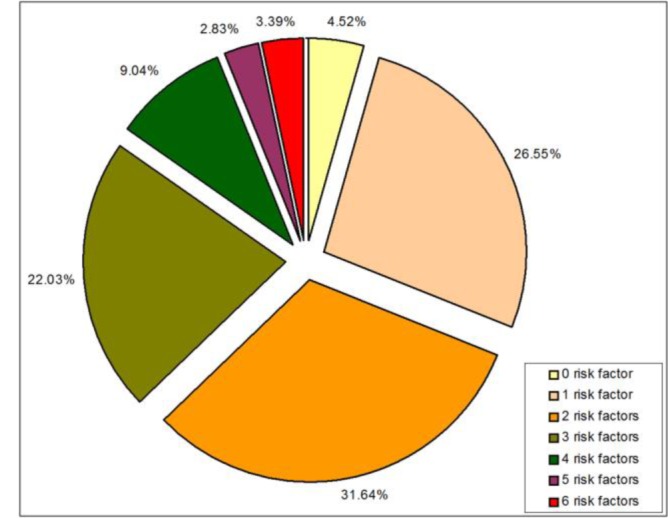
Share of cases with different number of associated risk factors.
The average of the T score, both for spine and hip, was calculated for each of the group of patients (with no risk factor, with one, two, three, four, five and six risk factors) and is represented in Table 1. The results show the decrease trend of the T score when comparing cases with a greater number of risk factors with cases with a smaller number of risk factors. The amount of the decrease is reflected by the decrement of the T score. The decrement represents the difference of the average of T score between cases with more risk factors and cases with fewer risk factors and is represented in table 2 for the spine and in table 3 for the hip.
Table 1:
Mean value of T-score in groups of cases with different number of associated risk factors
| Number of risk factors | Spine | Hip |
|---|---|---|
| Per case | Mean T score ± SD |
Mean T score ± SD |
| 0 | -2.94 ±0.33 | -2.73 ±0.21 |
| 1 | -3.26 ±0.73 | -2.82 ±0.31 |
| 2 | -3.37 ±0.76 | -2.81 ±0.25 |
| 3 | -3.14 ±0.45 | -3.33 ±0.59 |
| 4 | -3.26 ±0.65 | -3.17 ±0.31 |
| 5 | -3.58 ±0.90 | -3.30 ±0.44 |
| 6 | -5.40 ±2.69 | -4.40 ±0.20 |
Table 2:
Comparison of the mean T -score in spine between groups of cases with different number of associated risk factors
| Comparison | Mean T-score decrement |
P value (unpaired t-test) |
|
|---|---|---|---|
| 0 risk factor vs. 1 risk factor | -0.31 | 0.2721 | ns |
| 0 risk factor vs. 2 risk factors | -0.42 | 0.1509 | ns |
| 0 risk factor vs. 3 risk factors | -0.20 | 0.2741 | ns |
| 0 risk factor vs. 4 risk factors | -0.32 | 0.2342 | ns |
| 0 risk factor vs. 5 risk factors | -0.64 | 0.0421 | * |
| 0 risk factor vs. 6 risk factors | -2.46 | 0.0075 | ** |
| 1 risk factor vs. 2 risk factors | -0.11 | 0.4576 | ns |
| 1 risk factor vs. 3 risk factors | 0.12 | 0.4005 | ns |
| 1 risk factor vs. 4 risk factors | -0.01 | 0.9717 | ns |
| 1 risk factor vs. 5 risk factors | -0.32 | 0.3617 | ns |
| 1 risk factor vs. 6 risk factors | -2.14 | 0.0008 | *** |
| 2 risk factors vs. 3 risk factors | 0.23 | 0.1049 | ns |
| 2 risk factors vs. 4 risk factors | 0.10 | 0.6429 | ns |
| 2 risk factors vs. 5 risk factors | -0.21 | 0.5541 | ns |
| 2 risk factors vs. 6 risk factors | -2.03 | 0.0012 | ** |
| 3 risk factors vs. 4 risk factors | -0.12 | 0.4409 | ns |
| 3 risk factors vs. 5 risk factors | -0.44 | 0.0782 | ns |
| 3 risk factors vs. 6 risk factors | -2.26 | <0.0001 | *** |
| 4 risk factors vs. 5 risk factors | -0.32 | 0.4066 | ns |
| 4 risk factors vs. 6 risk factors | -2.14 | 0.0076 | ** |
| 5 risk factors vs. 6 risk factors | -1.82 | 0.0315 | * |
*P < 0.05 = significant, **P < 0.01 = highly significant, ***P < 0.001 = extremely significant, ns (P > 0.05) = not significant
Table 3:
Comparison of the mean T -score in hip between groups of cases with different number of associated risk factors
| Comparison | Mean T-score decrement | P value (unpaired t-test) | |
|---|---|---|---|
| 0 risk factor vs. 1 risk factor | -0.08 | 0.6932 | ns |
| 0 risk factor vs. 2 risk factors | -0.07 | 0.6885 | ns |
| 0 risk factor vs. 3 risk factors | -0.60 | 0.0220 | * |
| 0 risk factor vs. 4 risk factors | -0.43 | 0.0312 | * |
| 0 risk factor vs. 5 risk factors | -0.57 | 0.0427 | * |
| 0 risk factor vs. 6 risk factors | -1.67 | 0.0006 | *** |
| 1 risk factor vs. 2 risk factors | 0.01 | 0.9523 | ns |
| 1 risk factor vs. 3 risk factors | -0.52 | 0.0856 | ns |
| 1 risk factor vs. 4 risk factors | -0.35 | 0.1550 | ns |
| 1 risk factor vs. 5 risk factors | -0.48 | 0.0934 | ns |
| 1 risk factor vs. 6 risk factors | -1.58 | 0.0001 | *** |
| 2 risk factors vs. 3 risk factors | -0.53 | 0.0950 | ns |
| 2 risk factors vs. 4 risk factors | -0.36 | 0.1164 | ns |
| 2 risk factors vs. 5 risk factors | -0.49 | 0.0816 | ns |
| 2 risk factors vs. 6 risk factors | -1.59 | 0.0001 | *** |
| 3 risk factors vs. 4 risk factors | 0.17 | 0.6647 | ns |
| 3 risk factors vs. 5 risk factors | 0.03 | 0.9337 | ns |
| 3 risk factors vs. 6 risk factors | -1.07 | 0.0205 | * |
| 4 risk factors vs. 5 risk factors | -0.13 | 0.6868 | ns |
| 4 risk factors vs. 6 risk factors | -1.23 | 0.0043 | ** |
| 5 risk factors vs. 6 risk factors | -1.10 | 0.0088 | ** |
*P < 0.05 = significant, **P < 0.01 = highly significant, ***P < 0.001 = extremely significant, ns (P > 0.05) = not significant
The analysis conducted on the T-score measured in spine, according to the number of risk factors present for each case shows that a slight decrease of the mean value of T-score occurred between cases with no risk factors and cases with a single risk factor, but the connection is not significant (P>0.05).
An even smaller decrease of the mean T-score was observed between the cases with a single risk factor and the cases with two risk factors, the connection being also not significant. Between cases with two and three risk factors respectively, T-score recorded an insignificant increase. This is the only situation where the mean T-score showed an increase when comparing consecutively cases with more risk factors with cases with fewer risk factors. Starting with the cases with three up to six risk factors, the mean value of T-score decreased, the most significant consecutive decrease being recorded between cases with five and six risk factors.
P values were significant, highly significant or extremely significant when comparing the cases with six risk factors to any of the other cases. Thus, when comparing cases with six risk factors to cases with no risk factors, two risk factors and four risk factors, P value was highly significant (with values of 0.0075, 0.0012 and 0.0076 respectively). When comparing cases with six risk factors to cases with a single risk factor and with three risk factors, P values were extremely significant (0.0008 and 0.0001 respectively), and when comparing cases with six risk factors to cases with five risk factors, P value was significant (Table 2).
Analysing the mean values of T-score at hip level according to the number of risk factors, the results determined were similar to those obtained at spine level. Thus we observed a decrease trend of the mean T-score, as more risk factors were associated to a case. The most evident consecutive decrease was also recorded between cases with five and six risk factors. However there occurred two situations where the mean T-score showed an increase when comparing consecutively cases with more risk factors with cases with fewer risk factors, but the increase was not significant. The results evaluated as highly significant were observed when comparing cases with six risk factors to cases with five risk factors (P=0.0088) and with four risk factors (P=0.043). Extremely significant results were obtained when comparing cases with six risk factors to cases with a single risk factor (P=0.0001), two risk factors (P<0.0001) and no risk factors respectively (P=0.0006). The other variations of the mean T-score in cases with multiple risk factors compared to cases with fewer risk factors were not significant (Table 3).
Discussion
The first issue analyzed in this study is the prevalence of various risk factors. The results showed that the most frequent risk factor was early meno-pause. For most women, the average age of meno-pause is 50-52 years, and the average age of perimenopause is around 47 years (17), but a risk factor in osteoporosis is considered the menopause occurring before 45 years (18). Rapid decrease of estrogens levels following menopause is the most important risk factor of developing osteoporosis in women. Estrogens decline is followed by the increase of osteoclasts life time, with repercussions on the balance of bone remodelling by enhancing bone resorption (19).
The next risk factor, in descending order of prevalence, was low consumption of milk and dairy products. Other studies show also a high prevalence of this risk factor (20, 21). Low dietary calcium has consequences on the calcium reserves in bones by mobilizing specific quantities in order to maintain constant blood calcium levels. In case of an average calcium intake of 700-800 mg/day, the generation of bone material shall be limited by this insufficient supply (22). Important are not only an appropriate intake of dietary calcium, but also its efficient absorption and retention, and a series of interactions inside the body, which influence the availability and use of dietary calcium (23).
Sedentary lifestyle, identified among the most important risk factors for osteoporosis related fractures (24), was encountered in this study in almost a quarter of the cases, as the third prevalent risk factor. Comparatively, in another research regarding osteoporosis risk factors, the absence of physical activity was revealed as the second prevalent risk factor after menopause (25).
Regarding the coffee consumption as osteoporosis risk factor, studies show that a quantity of caffeine exceeding 300 mg/day accelerates bone loss at spine level in older women with postmenopausal osteoporosis (26) and that caffeine leads to an increased urinary excretion of calcium, an effect which can be compensated in younger persons by increasing calcium absorption, while older are less adaptable (27). The results of another study also show that a daily coffee consumption of 600 ml or more can be associated with a slight risk increase of osteoporotic fracture incidence, especially in women with a reduced calcium intake (28).
Smoking has a negative effect on bones, at more than 10 cigarettes per day (29). Smoking has a negative influence on bone mass, its effects being more evident in older persons. They vary depending on the dose and can be partially irreversible. In smoking women menopause occurs with up to two years earlier than in non-smoking women (30). The results of a study on osteoporosis risk factors in Jordanian women showed that smoking is not associated in a significant manner with osteoporosis, but this fact might be due to its under-reporting (31).
The genetic factor appears to be much more important in osteoporosis pathogenesis than the combination of dietary, hormonal, environmental and lifestyle factors (32). 60-80% of bone mass variation in adults can be explained by heredity, especially at lumbar spine level, than at femoral neck level (33). Following the research conducted on a lot of women diagnosed with postmenopausal osteoporosis and their daughters in premenopausal period, it has been determined that the daughters of those women had a reduced bone mass at lumbar spine level (34). We found positive family history of osteoporosis less prevalent than smoking or coffee consumption. An explanation may be the fact that first degree relatives (mother or sister) of some patients might have suffered from osteoporosis without being diagnosed, or that those relatives had not suffered a hip fracture. It is also possible that the patients do not remember accurately that fact.
According to the scientific literature, menarche was deemed as a risk factor if it occurred after the age of 16 (35), after the age of 15 (36) or after the age of 14 (29). Increased risk of fracture in cases of delayed menarche can be explained by the alterations developed in bone mineral mass, as well as in the microstructural components of the bone. The negative influence of delayed menarche on the bones detected at the end of the skeletal growth period is also maintained before the occur rence of menopause, being independent of the bone loss during premenopausal period, as shown by a study conducted on tibia and femoral neck (37).
Another risk factor is the low body mass index, encountered in 10.71% of the cases. There is a positive link between body weight and BMD in women after menopause. Small weight is associated with increased fracture rates in older women (38). A recent study regarding osteoporosis risk factors in Caucasian patients revealed that the body mass index was significantly lower in patients with osteoporosis compared to patients without osteoporosis (39). There are several possible mechanisms by which fat mass influences BMD. Larger body mass enhances the mechanical load, representing an osteogenetic stimulus. Fat reserves also represent the place of aromatization of androgen hormones into estrogens (30). After menopause, most circulating estrogens are the result of this conversion from androgens at the level of fat tissue. The rate of bone loss during post-menopausal period is inversely correlated with the body mass index, women with a moderate degree of obesity being protected against osteoporosis from this point of view (40). A body mass index of less than 19 kg/m2 is a risk factor in osteoporosis (35). A low body mass increases the risk for hip fracture with effects at the cervical and trochanteric level (41).
With respect to parity, there is a positive connection to bone mass, as it was determined that middle aged women experienced a mean increase of 1% in BMD per number of births (42). Nulliparous women present an increased risk of hip fractures during postmenopausal period, independent of BMD, and hip fracture risk decreases with the number of children (43).
Alcohol consumption was the least frequent encountered risk factor. Chronic alcohol consumption in large quantities compromises bone quality and increases the risk of fracture. The effect is irreversible even if alcohol consumption is interrupted (19).
Overall, it was determined that 95.48% of the patients from this study had one or several risk factors. The maximum number of risk factors identified in a case was six. In comparison, a U.S. study on the prevalence of risk factors in women with postmenopausal osteoporosis showed a maximum number of five risk factors associated per case (44). Many of the risk factors are fairly weak, but their association may have a significant influence on bone health (45). The greater the number of risk factors, the biggest the probability that the patient suffers from osteoporosis (46).
Identification of the risk factors is important in order to prevent postmenopausal osteoporosis and may be helpful in case finding and prevention strategies. The preventing effects against the occurrence of osteoporosis, or blocking the condition development, can be achieved by interfering on the modifiable risk factors, such as low consumption of milk and diary products, sedentary lifestyle, excessive coffee consumption, smoking, low body mass index, excessive alcohol consumption, estrogen deficiency. In this regard, it is essential that these risk factors are known by the female population. Several researches highlight a different level of awareness of osteoporosis risk factors. Thus, a research conducted in Greece showed that an important role in the knowledge of risk factors lies with the level of education, as well as the fact that there is decreased knowledge thereof over the age of 61 (25). A synthetic study carried out in Malaysia also highlighted the fact that the education level is associated with the knowledge of risk factors (47). It was also found that patients with fragility fractures did not associate such fractures with the presence of osteoporosis (48). Following a research conducted in Romania, it has been determined that there is a lack of fracture risk perception in women aged 55 and older (49). It would be necessary to improve the level of knowledge with respect to osteoporosis risk factors and the awareness of female population regarding subsequent fracture risk, fact which may be achieved by implementing of educational programs.
The second issue investigated in this paper is the variation of T score in spine and hip, according to the presence of risk factors and their numerical associations (from one to six) per case. Our results showed a decreasing trend of T score, both in spine and hip, with the increasing number of risk factors associated with a case. Within this decrease of T score, it can be observed, both in spine and hip, a level beyond which the decrease becomes statistically significant. This threshold consists of cases with six risk factors and is reflected by the P values obtained when comparing the T score of the cases with six risk factors with the T score of cases with a smaller number of risk factors. The P values are P<0.05, P<0.01, P<0.001, according to the case analyzed (table 2, table 3). The threshold may also be expanded to a certain extent to cases with 5 risk factors, where the results are also significant, both in spine and hip, when comparing the average values of T score related to such cases and the cases with no risk factor (P<0.05).
Our results are in accordance with previous studies. In this respect, the results of a study also show that with increasing number of osteoporosis risk factors the mean T-score became more negative (50). The same research shows that approximately a third of postmenopausal women with osteoporosis risk factors were diagnosed with this disease, compared to only 12%, which, without presenting any risk factors, were diagnosed with osteoporosis. In the present study there were 4.52% cases with no risk factors, the rest of the cases had at least one risk factor. Another study carried out on osteoporosis risk factors such as low body mass index, low calcium intake, smoking and sedentary lifestyle shows that the presence of one or several of these risk factors has been associated with a reduced bone mineral density. The association was more relevant when two or more risk factors were associated, but variations were recorded according to race, age and sex (51). The results of a recent research revealed a strong association between the trabecular bone score, a parameter that can be extracted from dual-energy x-ray absorptiometry (DXA) images, and the risk factors that are predictive for osteoporotic fractures (52).
The decrease of the T-score observed in this study in cases with multiple risk factors may be explained by the cumulative effect of these factors’ influence on the bone mineral density. It has been proven that a bone mineral density and a low T-score are important predictors of fracture risk (53). It was also reported that for patients with post-menopausal osteoporosis who had at least five risk factors, the hip fracture rate was increased (54).
This paper provides significant findings regarding the connection between the analyzed risk factors and T score. It demonstrates a level of numerical association of risk factors, beyond which the decrease of T score becomes statistically significant, which implies a greater risk of fractures.
Conclusions
The risk factors act as predisposing agents of osteoporosis. Being aware and avoiding these factors, to the extent possible, is important in order to prevent postmenopausal osteoporosis and consecutive fractures. This fact could be achieved by the education of female population, with respect to becoming aware of postmenopausal osteoporosis risk factors, followed by adopting an appropriate lifestyle and diet. Considering the decrease trend of the mean of T-score with the increase of the number of risk factors in a case, the avoidance itself of any such factors may contribute to a better bone mineral density.
Ethical consideration
Ethical issues (Including plagiarism, Informed Consent, misconduct, data fabrication and/or falsification, double publication and/or submission, redundancy, etc.) have been completely observed by the author.
Acknowledgements
I would like to thank Prof. Dr. Med. Virgiliu Niculescu for his valuable advices and to Dr. Balaș Melania for help in data collection. The author declares that there is no conflict of interests. For the preparation of the current study no funding was required.
References
- Lin JT, Lane JM (2004). Osteoporosis: a review. Clin Orthop Relat Res, 425: 126–134. [PubMed] [Google Scholar]
- Sipos W, Pietschmann P, Rauner M, Kerschan-Schindl K., Patsch J (2009). Pathophysiology of osteoporosis. Wien Med Wochenschr, 159/9–10: 230–234. [DOI] [PubMed] [Google Scholar]
- Riggs L, Melton LJ (1983). Evidence for two distinct syndromes of involutional osteoporosis. Am J Med, 75: 899–901. [DOI] [PubMed] [Google Scholar]
- Riggs L, Khosla S, Atkinson J, Dunstan C, Melton J (2003). Evidence that type I osteoporosis results from enhanced responsiveness of bone to estrogen deficiency. Osteoporos Int, 14: 728–733. [DOI] [PubMed] [Google Scholar]
- De Melo Ocarino N, Serakides R (2006). Effect of the physical activity on normal bone and on the osteoporosis prevention and treatment. Rev Bras Med Esporte, 12(3): 149e – 152e. [Google Scholar]
- WHO Technical Report Series (1994) Assessment of fracture risk and its application to screening for postmenopausal osteoporosis, 843. [PubMed] [Google Scholar]
- Nik Mohd NI (1997). Postmenopausal osteoporosis: epidemiology, pathophysiology and treatment. Malaysian J Pathol, 19(1): 21–25. [PubMed] [Google Scholar]
- McKnight A, Steele K, Mills K, Gilchrist C, Taggart H (1995). Bone mineral density in relation to medical and lifestyle risk factors for osteoporosis in premenopausal, menopausal and postmenopausal women in general practice. BJGP, 45: 317–320. [PMC free article] [PubMed] [Google Scholar]
- Demir B, Haberal A, Geyik P, Baskan B, Ozturkoglu E, Karacay O, Deveci S (2008). Identification of the risk factors for osteoporosis among postmenopausal women. Maturitas, 60: 253–256. [DOI] [PubMed] [Google Scholar]
- Fardellone P, Cotté FE, Roux C, Lespessailles E, Mercier F, Gaudin AF (2010). Calcium intake and the risk of osteoporosis and fractures in French women. Joint Bone Spine, 77: 154–158. [DOI] [PubMed] [Google Scholar]
- Cizza G, Primma S, Csako G (2009). Depression as a risk factor for osteoporosis. Trends in Endocrinology and Metabolism, 20(8): 367–373. [DOI] [PMC free article] [PubMed] [Google Scholar]
- Keramat A, Larigani B, Adibi H (2012). Risk factors for spinal osteoporosis as compared with femoral osteoporosis in urban Iranian women. Iranian J Publ Health, 41(10): 52–59 [PMC free article] [PubMed] [Google Scholar]
- Nguyen TV, Center JR, Eisman JA (2004). Osteoporosis: underrated, underdiagnosed and undertreated. Med J Aust, 180 (5 Suppl): 18–22. [DOI] [PubMed] [Google Scholar]
- De Gabriele P (2006). Risk factor identification and prevention of osteoporosis in the primary care setting. Malta Medical Journal, 18(01): 40–45. [Google Scholar]
- Fogelman I, Blake G (2000). Different approaches to bone densitometry. J Nucl Med, 41: 2015–2025. [PubMed] [Google Scholar]
- Marzillier L (1990). Elementary statistics. Wm. C. Brown Publishers, USA. [Google Scholar]
- Cârstoiu C (2007). Osteoporoza în menopauză. Editura Universitară „Carol Davila”, Bucuresti. [Google Scholar]
- Kanis J, Delmas P, Burckhardt P, Cooper C, Torgerson D (1997). Guidelines for diagnosis and management of osteoporosis. Osteoporos Int, 7: 390–406. [DOI] [PubMed] [Google Scholar]
- Sampson HW (2002). Alcohol and other factors affecting osteoporosis risk in women. Alcohol Research & Health, 26(4): 292–298. [PMC free article] [PubMed] [Google Scholar]
- Rentero ML, Carbonell C, Casillas M, Béjar MG, Berenguer R (2008). Risk Factors for Osteoporosis and Fractures in Postmenopausal Women Between 50 and 65 Years of Age in a Primary Care Setting in Spain: A Questionnaire. The Open Rheumatology Journal, 2: 58–63. [DOI] [PMC free article] [PubMed] [Google Scholar]
- Saravi FD (2013). Osteoporosis Self-Assessment Tool Performance in a Large Sample of Post-menopausal Women of Mendoza, Argentina. Journal of Osteoporosis, 2013, doi. org/10.1155/2013/150154 [DOI] [PMC free article] [PubMed] [Google Scholar]
- Meunier P (1999). Calcium, vitamin D and vitamin K in the prevention of fractures due to osteoporosis. Osteoporos Int, Suppl.2: S48-S52. [DOI] [PubMed] [Google Scholar]
- Heaney RP, Gallagher JC, Johnston CC, Neer R, Parfitt MA, Chir B, Whedon DG (1982). Calcium nutrition and bone health in the elderly. Am J Clin Nutr, 36: 986–1013. [DOI] [PubMed] [Google Scholar]
- Rouzi AA, Al-Sibiani SA, Al-Senani NS, Radaddi RM, Ardawi MS (2012). Independent predictors of all osteoporosis-related fractures among healthy Saudi postmenopausal women: The CEOR Study. Bone, 50: 713–722. [DOI] [PubMed] [Google Scholar]
- Alexandraki KI, Syriou V, Ziakas PD, Apostolopoulos NV, Alexandrakis AI, Piperi, C, Kavoulaki E, Myriokefalitakis I, Korres G, Diamanti-Kandarakis E (2008). The knowledge of osteoporosis risk factors in a Greek female population. Maturitas, 59: 38–45. [DOI] [PubMed] [Google Scholar]
- Rapuri PB, Gallagher JC, Kinyamu HK, Ryschon KL (2001). Caffeine intake increases the rate of bone loss in elderly women and interacts with vitamin D receptor genotypes. Am J Clin Nutr, 74(5): 694–700. [DOI] [PubMed] [Google Scholar]
- Massey LK (2001). Is caffeine a risk factor for bone loss in the elderly? Am J Clin Nutr, 74: 569–570. [DOI] [PubMed] [Google Scholar]
- Hallström H, Wolk A, Glynn A, Michaëlsson K (2006). Coffee, tea and caffeine consumption in relation to osteoporotic fracture risk in a cohort of Swedish women. Osteoporos Int, 17: 1055–1064. [DOI] [PubMed] [Google Scholar]
- Keramat A, Patwardhan B, Larijani B, Chopra A, Mithal A, Chakravarty D, Adibi H, Khosravi A (2008). The assessment of osteoporosis risk factors in Iranian women compared with Indian women. BMC Musculoskeletal Disorders, 9: 28. [DOI] [PMC free article] [PubMed] [Google Scholar]
- Wong P, Christie J, Wark J (2007). The effects of smoking on bone health. Clinical Science, 113: 233–241. [DOI] [PubMed] [Google Scholar]
- El-Heis MA, Al-Kamil EA, Kheirallah KA, Al-Shatnawi TN, Gharaibia M, Al-Mnayyis A (2013). Factors associated with osteoporosis among a sample of Jordanian women referred for investigation for osteoporosis. EMHJ, 19(5): 459–464. [PubMed] [Google Scholar]
- Cohen A, Roe F (2000). Review of risk factors for osteoporosis with particular reference to a possible aetiological role of dietary salt. Food and Chemical Toxicology, 38: 237–253. [DOI] [PubMed] [Google Scholar]
- Bonjour JP, Chevalley T, Ferrari S, Rizzoli R (2009). The importance and relevance of peak bone mass in the prevalence of osteoporosis. Salud Publica Mex, 51 (supl 1): 5–17. [DOI] [PubMed] [Google Scholar]
- Seeman E, Hopper J, Bach L, Cooper M, Parkinson E, Mc Kay J, Jerums G (1989). Reduced bone mass in daughters of women with osteoporosis. N Eng J Med, 320(9): 554–558. [DOI] [PubMed] [Google Scholar]
- Georgescu C (2005). Osteoporoza:fiziopatologie, diagnostic, tratament. Edit. Risoprint, Cluj-Napoca. [Google Scholar]
- Paoletti R (1999). Women’s health and menopause. Kluwer Academic Publishers and Fondazione Giovanni Lorenzini, Netherland. [Google Scholar]
- Chevalley T, Bonjour JP, Ferrari S, Rizzoli R (2009). Deleterious effect of late menarche on distal tibia microstructure in healthy 20-year-old and premenopausal middle-aged women. Journal of Bone And Mineral Research, 24(1): 144–152. [DOI] [PubMed] [Google Scholar]
- Harris S, Dawson-Hughes B (1996). Weight, body composition and bone density in post-menopausal women. Calcif Tissue Int, 59: 428–432. [DOI] [PubMed] [Google Scholar]
- Graat-Verboom L, Smeenk FWJM, van den Borne BEEM, Spruit MA, Donkers-van Rossum AB, Aarts RPM, Wouters EFM (2012). Risk factors for osteoporosis in Caucasian patients with moderate chronic obstructive pulmonary disease: A case control study. Bone, 50: 1234–1239. [DOI] [PubMed] [Google Scholar]
- Tremollieres F, Pouilles J, Ribo C (1993). Vertebral postmenopausal bone loss is reduced in overweight women: a longitudinal study in 155 early postmenopausal women. J Clin Endocrinol Metab, 77(3): 683–686. [DOI] [PubMed] [Google Scholar]
- Määttä M, Terho E, Jokinen H, Pulkkinen P, Korpelainen J, Heikkinen J, Keinänen-Kiukaanniemi S, Jämsä T, Korpelainen R (2012). Lifestyle factors and site-specific risk of hip fracture in community dwelling older women – a 13-year prospective population-based cohort study. BMC Musculoskeletal Disorders, 13: 173. [DOI] [PMC free article] [PubMed] [Google Scholar]
- Murphy S, Khaw KT, May H, Compston JE (1994). Parity and bone mineral density in middle-aged women. Osteoporos Int, 4(3): 162–166. [DOI] [PubMed] [Google Scholar]
- Hillier TA, Rizzo JH, Pedula KL, Stone KL, Cauley JA, Bauer DC, Cummings SR (2003). Nulliparity and fracture risk in older women: the study of osteoporotic fractures. Journal of Bone and Mineral Research, 18(5): 893–899. [DOI] [PubMed] [Google Scholar]
- Yurgin NY, Wade S, Satram-Hoang S, Macarios D, Hochberg M (2013). Prevalence of Fracture Risk Factors in Postmenopausal Women Enrolled in the POSSIBLE US Treatment Cohort. Int J Endocrinol, 2013, doi: 10.1155/2013/715025. [DOI] [PMC free article] [PubMed] [Google Scholar]
- Cohen AJ, Roe FJ (2004). Review of risk factors for osteoporosis with particular reference to a possible aetiological role of dietary salt. Food Chem Toxicol, 38(2–3): 237–253. [DOI] [PubMed] [Google Scholar]
- Pervaiz K, Cabezas A, Downes K, Santoni BG, Frankle MA (2013). Osteoporosis and shoulder osteoarthritis: incidence, risk factors, and surgical implications. J Shoulder Elbow Surg, 22: e1-e8. [DOI] [PubMed] [Google Scholar]
- Khan YH, Sarriff A, Khan AH (2012). A review of knowledge, attitude and practices (KAP) of community population towards osteoporosis. J App Pharm, 03(04): 628–638. [Google Scholar]
- Sujic R, Monique A. Gignac MA, Cockerill R, Beaton DE (2013). Factors predictive of the perceived osteoporosis–fracture link in fragility fracture patients. Maturitas, 76: 179–184. [DOI] [PubMed] [Google Scholar]
- Ceausu I (2010). Education and information: important tools in assessing the risks and prevention of osteoporosis fractures. Climacteric, 13(6): 530–533. [DOI] [PubMed] [Google Scholar]
- Frost ML, Blake GM, Fogelman I (2001). Quantitative ultrasound and bone mineral density are equally strongly associated with risk factors for osteoporosis. Journal of Bone and Mineral Research, 16(2): 406–416. [DOI] [PubMed] [Google Scholar]
- Broussard DL, Magnus JH (2004). Risk assessment and screening for low bone mineral density in a multi-ethnic population of women and men: does one approach fit all? Osteoporos Int, 15: 349–360. [DOI] [PubMed] [Google Scholar]
- Leslie WD, Krieg MA, Hans D (2013). Clinical Factors Associated With Trabecular Bone Score. J Clin Densitom, 16(3): 374–379. [DOI] [PubMed] [Google Scholar]
- Suman VB, Perwez K Jeganathan PS, Subbalakshmi NK, Pai SR, Shaila MD (2013). Risk factors associated with osteoporosis- a population based study using p-Dexa technique. International Journal of Scientific and Research Publications, 3(2). www.ijsrp.org. [Google Scholar]
- Nelson HD, Helfand M, Woolf SH, Allan JD (2002). Screening for Postmenopausal Osteoporosis: A Summary of the Evidence. Ann Intern Med, 137(6): 529–541. [DOI] [PubMed] [Google Scholar]