

Abstract
Mitochondrial redox states provide important information about energy-linked biological processes and signaling events in tissues for various disease phenotypes including cancer. The redox scanning method developed at the Chance laboratory about 30 years ago has allowed 3D high-resolution (~ 50 × 50 × 10 μm3) imaging of mitochondrial redox state in tissue on the basis of the fluorescence of NADH (reduced nicotinamide adenine dinucleotide) and Fp (oxidized flavoproteins including flavin adenine dinucleotide, i.e., FAD). In this review, we illustrate its basic principles, recent technical developments, and biomedical applications to cancer diagnostic and therapeutic studies in small animal models. Recently developed calibration procedures for the redox imaging using reference standards allow quantification of nominal NADH and Fp concentrations, and the concentration-based redox ratios, e.g., Fp/(Fp+NADH) and NADH/(Fp+NADH) in tissues. This calibration facilitates the comparison of redox imaging results acquired for different metabolic states at different times and/or with different instrumental settings. A redox imager using a CCD detector has been developed to acquire 3D images faster and with a higher in-plane resolution down to 10 μm. Ex vivo imaging and in vivo imaging of tissue mitochondrial redox status have been demonstrated with the CCD imager. Applications of tissue redox imaging in small animal cancer models include metabolic imaging of glioma and myc-induced mouse mammary tumors, predicting the metastatic potentials of human melanoma and breast cancer mouse xenografts, differentiating precancerous and normal tissues, and monitoring the tumor treatment response to photodynamic therapy. Possible future directions for the development of redox imaging are also discussed.
Keywords: Redox ratio, reduced nicotinamide adenine dinucleotide, NADH, flavoprotein, flavin adenine dinucleotide, FAD, calibration
1. Introduction
Mitochondria are key organelles for cellular metabolism and apoptosis.1,2 Mitochondrial functional and genetic abnormalities have been linked to various physiological conditions and disease phenotypes including cancer, diabetes, cardiovascular and neurodegenerative diseases, etc.3-11 Two coenzymes NADH (reduced nicotinamide adenine dinucleotide) and FADH2 (reduced flavin adenine dinucleotide) provide free energy and electrons to the mitochondrial respiratory chain reaction, building up the proton gradient across the mitochondrial inner membrane to drive the ATP synthesis by ATP synthase. Apart from being regarded as a universal currency of energy metabolism and electron transfer, nicotinamide adenine dinucleotide (NAD) has been increasingly demonstrated to play key roles in signaling events as well for cell growth, apoptosis, calcium signaling and so on.12
Mitochondrial NAD-coupled redox state has been found to be an important factor in mitochondrial functions. The NAD-coupled redox potential (NAD+/NADH) mediates central biochemical pathways such as in the Krebs cycle and can also affect signal transduction pathways that are key for cellular growth and survival directly or indirectly by coupling to other oxidation–reduction couples such as glutathione and thioreducxin.13 Since 1950s, Chance et al. have developed fluorometry-based methods to probe the mitochondrial redox states utilizing the intrinsic fluorescence of NADH initially and oxidized flavoproteins (Fp) such as FAD later on.14-24 Different metabolic states (States 1–5) corresponding to various cellular physiological conditions were linked to different fluorescence intensities of NADH and Fp and their redox ratios, i.e., Fp/(Fp+NADH) and NADH/(Fp+NADH).
As the only method that can image the in vivo mitochondrial redox state in tissue with a submillimeter spatial resolution, mitochondrial redox imaging was first developed by Chance laboratory in late 1970s, and a 3D redox scanner has been applied to the study of tissues such as brain, muscle, and tumor. The early development and application of cryogenic redox scanning have been reviewed by Quistorff et al.25 and Gu et al.26 The review here will focus on its recent developments and applications in the field of cancer imaging in small animal models. The following topics will be included:
Basic principles of mitochondrial redox imaging
-
Recent technical developments of redox imaging
Calibration of the redox scanner to obtain nominal concentrations of NADH and Fp in tissues
CCD-based redox imaging
Redox imaging in vivo
-
Biomedical applications in small animal cancer imaging
Metabolic imaging of tumors
Imaging of tumor aggressiveness
Imaging of tumor response to therapy
Summary and future directions
2. Basic Principles and Advantages of Mitochondrial Redox Imaging
Mitochondrial redox imaging utilizes intrinsic fluorescence of NADH and oxidized flavoproteins (Fp) and their ratios to indicate various redox states of mitochondria. It has been shown that these signals in cells/tissues mainly have origins in mitochondria,63,64 and the measurement of NADH, Fp and redox ratios, i.e., Fp/(Fp+NADH) or NADH/(Fp+NADH) provides an index of mitochondrial metabolic states.15,16,27,28 The fluorescence spectra of NADH and oxidized flavoproteins (Fp) in suspensions of isolated mitochondria are shown in Fig. 1. When mitochondria are metabolically inactive or at rest (low ADP) (State 4), they are mainly in a reduced state with high fluorescence from NADH and low fluorescence from Fp, and a low Fp redox ratio Fp/(Fp+NADH). When mitochondria are metabolically active (State 3), e.g., when muscle cells are in exercise, mitochondria become oxidized. NADH signal is low and Fp signal is high and Fp redox ratio is high. When mitochondria are starved of substrate (nutrition supply limited) (State 2), NADH becomes even lower and Fp signal and Fp ratio higher than that in State 3. State 1 corresponds to mitochondria having adequate oxygen but low levels of both substrate and ADP. The NADH is relatively high, and Fp as well as the Fp redox ratio are relatively low. State 5 corresponds to an anaerobic condition, e.g., when the cells have no oxygen supply, with NADH being 100% reduced exhibiting the strongest fluorescence signal, and Fp signal reaching the minimum. The hydroxybutyrate/acetoacetate ratio is a direct measurement of mitochondrial NAD+- coupled redox state.29 It has been shown that the mitochondrial Fp/PN ratio in isolated mitochondria and liver tissue significantly correlates with the hydroxybutyrate/acetoacetate ratio.22,30
Fig. 1.
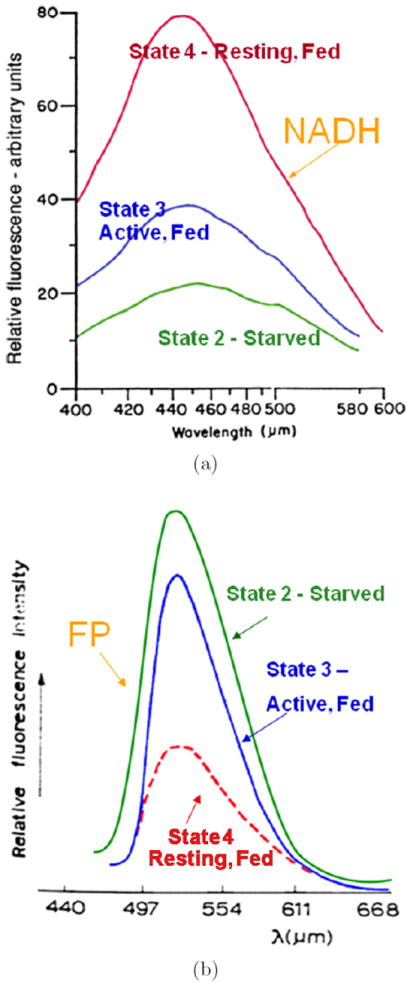
The relative fluorescence intensity of (a) NADH and (b) oxidized flavoprotein (Fp) in a suspension of isolated mitochondria under different metabolic states: State 4 — resting state achieved by feeding with succinate or succinate plus ATP; State 3 — active and fed with succinate and ADP; State 2 — starvation of substrate, treated with ADP only or no treatment. Excitation wavelength 330 μm for NADH and 436 μm for Fp. Figures redrawn with copyright permission from Chance and Baltscheffsky (1958)16 and Chance and Schoener (1966)27 with some modifications.
Redox scanner is an instrument that can perform point-by-point surface scanning of a flat tissue surface plane at different depths to obtain 3D images of Fp, NADH, and redox ratio with a spatial resolution of 50 × 50 × 10 μm3 (see a picture of the instrument in Fig. 2).25 Proper excitation and emission filters with narrow bandwidth were used for NADH and Fp channels, with NADH excitation filter set at about 365 nm and emission at about 425 nm, Fp excitation at about 430 nm and emission at about 525 nm. Biological tissues were snap-frozen in liquid nitrogen (or isopentane first then liquid nitrogen to ensure faster freezing) so that the in vivo tissue metabolic states at the moment of freezing can be measured by redox scanning later. In addition, fluorescence of NADH under the low temperature of liquid nitrogen is about 10-fold stronger than that under room temperature, and the Fp signal enhancement may be even higher.22,65
Fig. 2.
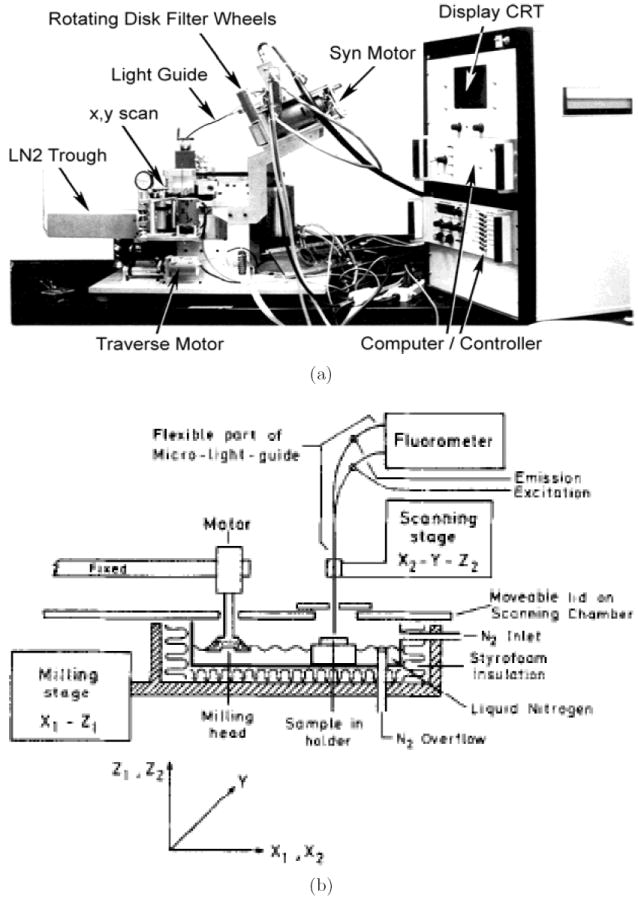
(a) A photo and (b) a simplified schematic diagram of redox scanner. Diagram (b) reproduced from Quistorff et al.25 with permission.
Despite its invasiveness, redox scanning can be applied to cryogenic biopsy tissue samples and translated into clinical studies. The mitochondrial redox state of tissue may change within a few seconds once the tissue was removed from the body. However, commercially available cryogenic biopsy needle can be used to snap-freeze tissue in situ at ~ −20°C with carbon dioxide, and the snapfrozen tissue can then be removed and stored in liquid nitrogen. The in situ freezing technique should help to reduce greatly the disturbance of redox state by tissue biopsy and handling procedure. Redox scanning also has the following major advantages:
It can image the in vivo tissue mitochondrial redox state by simultaneous measurement of NADH and Fp in snap-frozen tissue. Many studies have employed fluorescence measurement of NADH or FAD for studying tissue or cellular metabolic state. However, not many studies performed simultaneous measurement of both fluorophores and obtained the redox ratio, and even fewer studies performed snapfreeze procedure for tissue sample preparation. Both NADH and Fp signals may change within seconds once an animal is dead under room temperature. Snap-freezing live biological tissues in liquid nitrogen for redox scanning and storage ensures that the in vivo metabolic state is preserved at the moment of snap-freeze with no further changes.
It can image the in vivo tissue mitochondrial redox state at sub-millimeter resolution. Multi-section redox scanning has an in-plane high resolution of ~50 μm, and can provide details of tissue heterogeneity that may be important for understanding disease pathology and developing diagnostic and therapeutic methods. For example, intratumor heterogeneity31-33 has been shown to be an important factor in tumor metastasis, and high image resolution is essential for characterizing tumor heterogeneity. Our studies on human melanoma and breast cancer mouse xenografts using redox scanning have demonstrated a significant degree of tumor heterogeneity, particularly the distinct difference between tumor core and rim for more aggressive tumors.28,34,35,41,42 As revealed by our studies on human melanoma mouse xenografts, it was the mitochondrial redox states in the more oxidized tumor core region that differentiated tumors with different metastatic potentials (see figures in following sections). The size of the more oxidized core area could be as small as 2–3mm for a 6–9mm tumor. In comparison, positron emission tomography (PET) being very valuable in clinical research in staging/grading tumors, its spatial resolution is limited to about 4–5mm on clinical scanners and 1.5–2mm on animal scanners. The structural MRI can reach a high spatial resolution of 100–200 μm, however, the spatial resolution achievable for function-related MRI such as perfusion imaging is still on the order of a few millimeters. The best resolution of the visible light fluorescence imaging of deep tissues in mouse models is also above two millimeters. Thus, although these imaging methods have various advantages and are good for different biomedical applications, they may not be effective in differentiating the tumor core from the tumor rim for a 1-cm tumor just from the aspect of spatial resolution. Near-infrared fluorescence tomography has been recently developed with a sub-millimeter resolution (see http://www.visenmedical.com/). However, this method is currently unable to provide the tissue mitochondrial metabolic information needed for predicting tumor metastatic potential. The high spatial resolution of redox scanning down to 50 μm for in-plane resolution allows us to fully address tumor heterogeneity — the distinct tumor core and rim difference — that is essential for the differentiation of cancer metastatic potential in human melanoma mouse xenografts.
It is a ratiometric imaging approach. Many other studies have evaluated the fluorescence of either NADH or flavoproteins (such as FAD) separately for gaining information on metabolic state or activities.36-40 Redox scanning evaluates both NADH and Fp and the ratios of Fp and NADH, i.e., Fp/PN, PN/Fp, Fp/(Fp+NADH), or NADH/(Fp+NADH). The measurement of redox ratio is independent of mitochondrial density, avoids or minimizes hemodynamic artifacts and the interference from other fluorophores, and demands less stringent instrumentation.
3. Recent Technical Developments
3.1. Calibration of redox scanner
Previously redox scanning provided relative fluorescence intensities of NADH and Fp, and the redox ratio is obtained by taking the ratio of the intensities of the fluorescence signals of NADH and Fp. However, the relative fluorescence intensity usually relies on instrumental settings such as filters and lamp conditions and may vary with instrument as well. To facilitate the comparison of redox images acquired at different times with different instrument settings or by different instruments, we have developed a calibration procedure41,42,66 for the redox scanner and the newly developed CCD imager (see Sec. 3.2) to obtain images of NADH and Fp nominal concentrations and the concentration-based redox ratios.
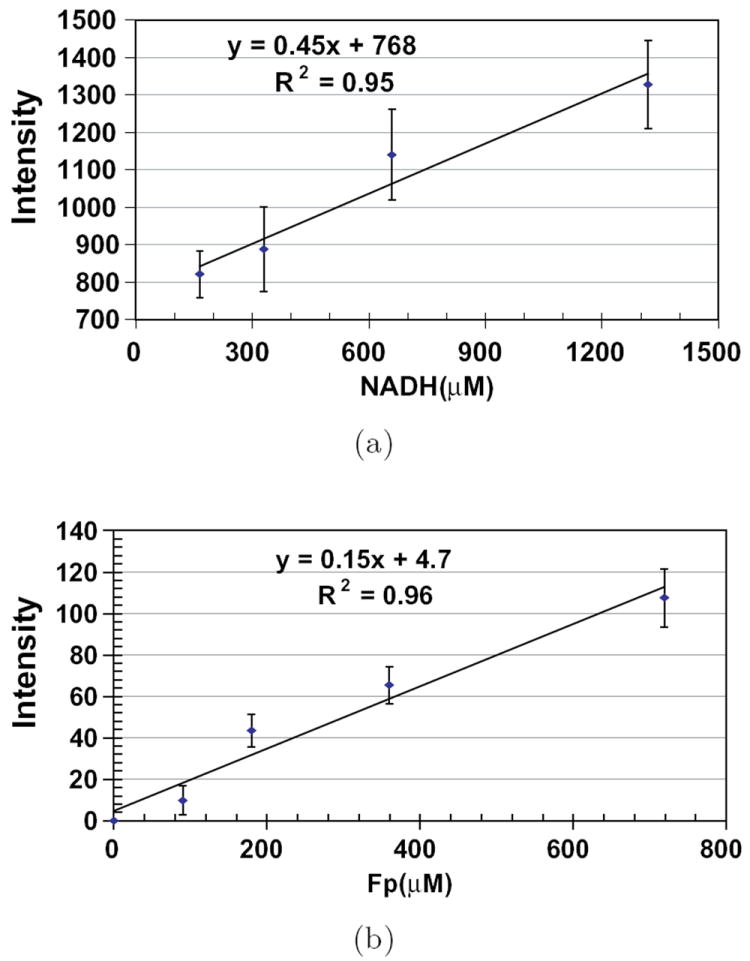
The calibration of the redox imager is accomplished by using two sets of snap-frozen NADH and FAD solution standards with various known concentrations. Figure 3 shows the calibration curves of fluorescence intensities versus the concentrations of these standards. The slope yields the relative sensitivity of NADH or Fp channels. The ratio of the slopes indicated the sensitivity ratio of the NADH and Fp channels, which can be used to correct signal-based redox ratio images.42
Fig. 3.

Calibrations curves of the redox scanner. Plots of fluorescence intensities (arbitrary unit) versus the concentrations of fluorophores in snap-frozen solution standards. Graphs show the linear fit of data and the results of linear regression with correlation coefficients. Reproduced from Xu et al.41 with permission from SPIE.
Quantification of the nominal fluorophore concentrations in the biological samples was made possible by imaging the tissue sample together with the adjacent NADH and Fp reference standards for redox scanner and CCD-imager (Fig. 4). Figure 4 also shows the NADH redox ratio image of human breast cancer mouse xenografts obtained on the basis of concentrations of Fp and NADH, which are independent of instrument settings.
Fig. 4.

Typical redox scanning images of a snap-frozen tumor from a mouse xenograft of human breast cancer cell line MCF-7. Matrix size: 128×128, resolution 100 × 100 μm2. NADH and Fp are displayed in concentrations (μM). The grinding depth of the tumor section was 1.4mm from the tumor surface. The lower three graphs are the histograms of NADH, Fp, and NADH redox ratio in the tumor section, respectively. The round spots outside the tumor are the reference standards for the nominal calibration of the fluorophore concentration in the tissue. Reproduced from Xu et al.41 with permission from SPIE.
The reference standards were made from plain buffer solutions of NADH or FAD with pH close to 7. They may be different from tissues in terms of the optical properties such as absorption and scattering constant. Thus the quantification yields only nominal concentrations of NADH and Fp, which may deviate significantly from the true values in tissue. However, the merit of this calibration procedure is to quantify the fluorescence signal so that imaging scans taken under different instrumental settings and/or at different times can be compared. Moreover, the nominal NADH and Fp concentrations determined in reference to these standards seem to fall within the normal range of physiology.29,43 Nevertheless, an accurate calibration of NADH and Fp concentrations in tissues may be obtained by comparing with the direct biochemical assay or mass spectrometry measurement.
3.2. CCD-based redox imaging
The point-by-point redox scanning is comparatively time consuming, and it usually takes redox scanner about 40 minutes or so to obtain a 128 × 128 image with a decent signal-to-noise ratio. To reduce the imaging acquisition time, a charge coupled device (CCD)-based redox imager has been developed recently to acquire higher-resolution images within seconds.42 This new redox imager can acquire both 3D high resolution images of snap-frozen tissues using a grinder for tissue sectioning and surface images of tissues in vivo with minimum invasive procedures. A schematic drawing of the instrument is shown in Fig. 5. The major difference between the CCD imager and the redox scanner is using a high performance monochrome CCD camera instead of a PMT and a fiberoptic light guide for acquiring snap-shot images of samples. A diffusive quartz is placed between the sample and the excitation for a uniform illumination of the sample imaging plane at an angle of about 45°–75°
Fig. 5.

Schematic diagram of the ex vivo/in vivo CCD-based redox imager. CCD model: COHU 4912-5010. Excitation filters: 365BP20 for NADH and 436DF10 for Fp; Emission filters: 450DF10 for NADH and 546DF10 for Fp. The cold chamber of liquid nitrogen is only necessary for ex vivo imaging to hold snap-frozen samples. It is replaced with a supporting frame on which a small animal lies for in vivo imaging. Grinder is not shown. Reproduced from Xu et al.42 with permission from SPIE.
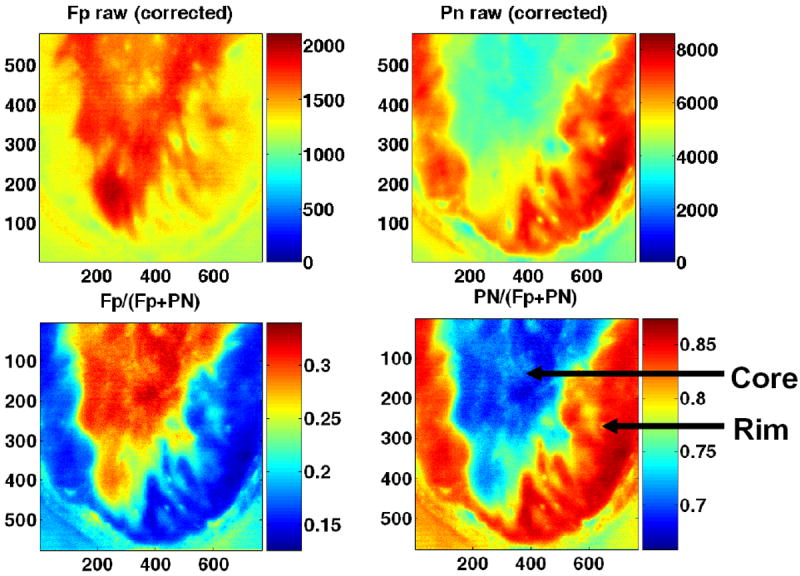
This newly developed CCD-based redox imager has a good linear dynamic range (Fig. 6) and can acquire redox images of a tissue section submerged in liquid nitrogen within half a minute with a comparable quality as redox scanner (Figs. 7 and 8). The typical difference between tumor core and rim is clearly seen, which is one of the characteristics of a more aggressive human melanoma that has been observed by redox scanner (see section below).34 Compared to redox scanning, the speed of image acquisition has been improved by about 80 times. The image resolution is also improved down to about 9 μm with a CCD matrix size of 768 × 576. It is possible to achieve a resolution of less than 5 μm with a higher magnification lens.
Fig. 6.
Calibrations of a CCD imager. Plots of fluorescence intensities (arbitrary unit) versus the concentrations of fluorophores in snap-frozen solution standards. Graphs show the linear fit of data and the results of linear regression with correlation coefficients. Reproduced from Xu et al.42 with permission from SPIE.
Fig. 7.
CCD images of a human melanoma (A375P5) subcutaneously xenografted in a mouse under the temperature of liquid nitrogen. From left to right are images of Fp, NADH (top row); Fp/(Fp+NADH) and NADH/(Fp+NADH) (bottom row). The field of view of the CCD camera is about 0.5×0.7 cm2, allowing half of the tumor section to be imaged for each acquisition. Reproduced from Xu et al.42 with permission from SPIE.
Fig. 8.
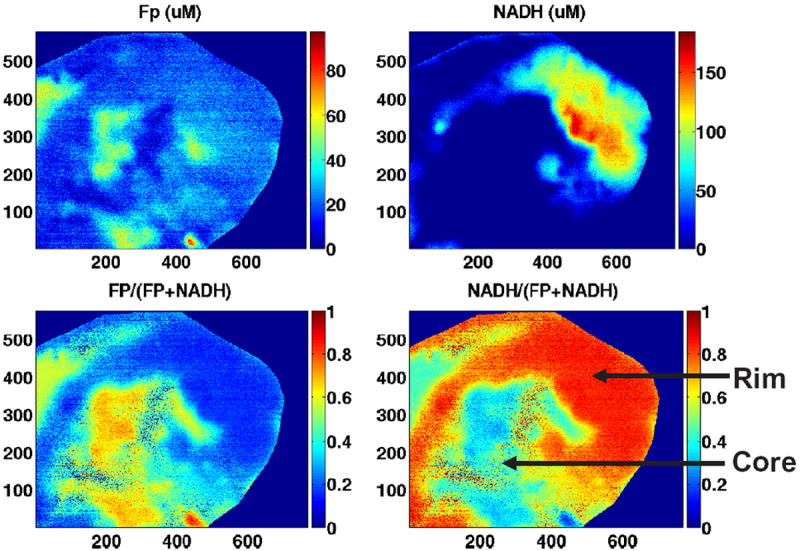
CCD redox images of an aggressive human breast cancer (MDA-MB-231) xenografted in mouse. From left to right are images of Fp, NADH (top row); Fp/(Fp+NADH) and NADH/(Fp+NADH) (bottom row). The field of view of the CCD camera is about 0.5 × 0.7 cm2. The images were taken with 64 acquisitions. Images of the adjacent reference standards were taken separately (not shown) due to the limitation of field of view. The color bars of both Fp and NADH images indicate the fluorophore nominal concentration in μM. The redox ratio images were obtained with the correction of sensitivity ratio of the two channels. Reproduced from Xu et al.42 with permission from SPIE.
3.3. Redox imaging in vivo
The feasibility of performing in vivo mitochondrial redox imaging in an ischemic mouse colon tissue model at room temperature has been demonstrated recently with the CCD-based redox imager.44 Openabdomen surgeries were performed on anesthetized adult mice to expose colons in the abdominal cavity. The mouse was placed on the optical stage beneath the CCD redox camera to capture live redox images of colons. The mouse was then sacrificed by the i.p. injection of pentobarbital sodium (50 μg/g of body weight), and redox images of NADH and Fp were taken to detect the hypoxic ischemic effects during the suppression of breathing. The possible signal contamination due to hemoglobin absorption, blood volume change and motion artifacts was corrected or reduced by taking the ratio of the NADH/Fp channel fluorescence signals to the reflected signals in each channel. It was observed that NADH fluorescence intensity increased as the Fp signal decreased versus the time after the animal was dead. Actually significant fluorescence changes were observed within one minute [Fig. 9(a)]. This result demonstrates significant change in tissue redox state after the death of the animal, and the tissue snap-freezing procedure is necessary to preserve the in vivo mitochondrial metabolic state. Figure 9(b) displays Fp, NADH and the NADH redox ratio in live (top row) and dead (bottom row) mouse colons. The NADH redox ratio at death is much higher (mean value 0.92 ± 0.03) than normal tissue (mean value 0.51 ± 0.10) due to ischemia and reduction of the fluorophores. The high NADH redox ratio of the dead tissue is indicative of State 5 (death with zero oxygen supply) in the tissue. In vivo redox images of an animal tumor were also acquired by utilizing this CCD-redox imager as shown in Fig. 9(c).
Fig. 9.
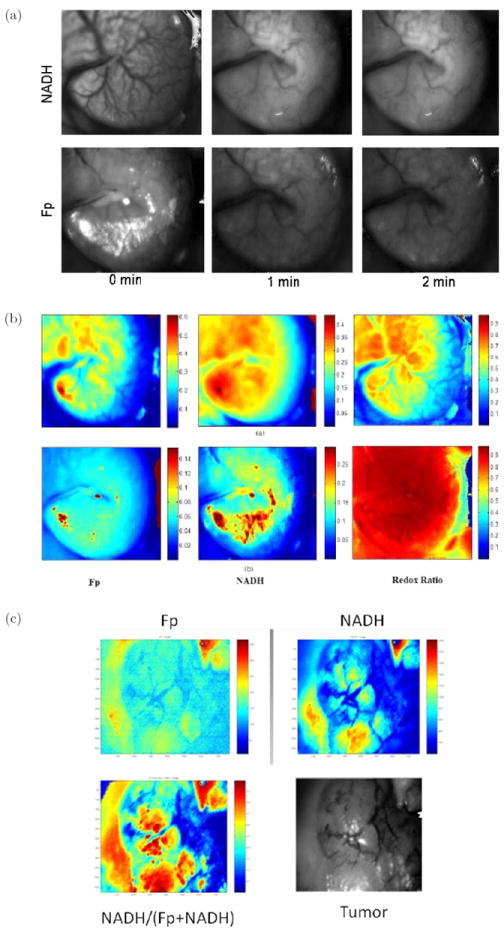
In vivo redox images (Fp, NADH, and NADH redox ratio), field of view ~0.5 × 0.7 cm2 under room temperature with the animal’s skin flapped. (a) Unprocessed fluorescence images of NADH and Fp of a colon before death, as well as at one and two minutes after death. (b) A mouse colon (top row: live; bottom row: dead and ischemic) with artifacts corrected with tissue absorptions. (c) A tumor in vivo. Also shown in (c) is a black-and-white picture of the skin-flapped tumor being imaged. Figures (a) and (b) reproduced with permission from Ranji et al.44
Although a number of studies have demonstrated the in vivo imaging of NADH and/or flavoproteins using single photon excitation methods,38,39,45-47 these studies did not generate or report redox ratio images. Ratiometric method has the advantages of independence of mitochondrial density, as well as less sensitivity to hemodynamic artifacts and the influence of different instrumental settings.
One of the major obstacles for the biomedical applications of redox imaging in vivo is the shallow tissue penetration depth of UV/blue excitation light. Two-photon confocal imaging can improve the tissue penetration depth to about 0.5 mm and has been utilized to image NADH and Fp (or FAD) in tissue ex vivo and in vivo.48-52 However, the snapfreezing method, which is important to preserve the in vivo metabolic status, was often not used for tissue sample preparation in ex vivo studies.48,49,51,52 Without the snap-freezing procedure, redox states ex vivo may deviate significantly from the true redox states in vivo after sample preparation. Therefore, we choose only to review the ex vivo studies with the proper snap-freezing procedure and in vivo imaging studies in the following section.
4. Biomedical Applications of Redox Imaging in Small Animal Cancer Imaging
Since the fluorescence properties of the intrinsic fluorophores, NADH and Fp, are sensitive indicators of mitochondrial redox state, mitochondrial redox imaging has been applied to studying the energy-linked processes in biological tissues. Abnormal metabolism is a hallmark of many cancers that can be detected by redox imaging. Here we will summarize some of the recent advancements in the field of cancer detection, diagnosis, and treatment using small animal tumor models.
4.1. Tumor metabolic imaging
One key diagnostic question in the initial stage of clinical cancer management is to detect a lesion and decide whether the lesion is cancer or normal/benign tissue. Enhanced glycolysis is considered as one of the biochemical hallmarks in malignant tumors. It is primarily caused by the over-expressed glucose transporters (GLUTs) and the exceptionally high level of hexokinase bound to mitochondria of highly glycolytic tumor cells.
Zhang et al.53 synthesized an NIR fluorescent GLUT-targeted photosensitizer, pyropheophorbide conjugate of 2-deoxyglucose (Pyro-2DG), and utilized mitochondrial redox ratio imaging to evaluate the in vivo uptake of Pyro-2DG by cancer tissues to establish a correlation of mitochondrial redox status with glucose metabolism. Two animal models were tested in their study, one being 9L glioma rat xenografts model and the other being a transgenic mouse model: c-MYC-induced mammary tumor in mouse. The mice were snap-frozen in pre-cooled isopentane (−160°C) and then transferred to liquid nitrogen to preserve the tissue metabolic state in vivo. The redox scanner was utilized to acquire the fluorescence images of Pyro-2DG and Fp as well as NADH and to obtain the fluorescence intensity–based Fp and NADH redox ratios. Histopathological analysis (H&E) was performed for co-registration of tissue zones. Figure 10 shows the results from the transgenic mouse model. They observed that the in vivo uptake of Pyro-2DG selectively accumulated in the tumor tissues compared with the surrounding normal muscle tissues at a ratio of about 10:1. They also observed that NADH redox ratio NADH/(Fp+NADH) highly correlated with the Pyro-2DG uptake and poorly correlated with the Pyro-acid uptake, suggesting that Pyro-2DG could be an index of the mitochondrial status of a tumor. If we regard the uptake of Pyroacid as an indicator of blood transfer rate, these results appear to indicate that cancer cell’s mitochondrial metabolic state is insensitive to blood perfusion and/or vessel permeability that determine the blood transfer rate, and low respiration rate (high NADH redox ratio) may correlate with the high rate of glucose metabolim, which is in agreement with Warburg effect in these two tumor models, but not necessarily true in all cancer models.
Fig. 10.
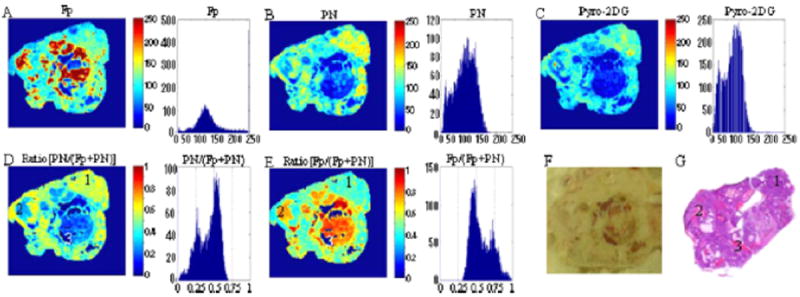
Images of c-MYC-induced mammary tumor at the depth of 900 μm below the surface. (A), (B) and (C) are the fluorescent images of Fp, PN (i.e., NADH), and Pryo-2DG, respectively. (D) and (E) are redox ratio images of the tumor region. (F) is the usual picture with the digital camera. (G) is the histopathological image. The histograms of tumor region are shown on the right side of each redox image. The size of each image is 1.024 cm × 1.024 cm. Reproduced with permission from Zhang et al.53
4.2. Imaging tumor aggressiveness
Clinical knowledge on tumor malignancy or metastatic potential using reliable biomarkers can help physicians to select proper treatment strategy against cancer while avoiding unnecessary side effects. In addition to facilitating the treatment strategy, biomarkers of tumor aggressiveness can also contribute useful information to the development of new therapeutic approaches. Imaging biomarkers with spatial distribution information can be particularly useful because of intrinsic tumor heterogeneity.
Mitochondrial redox imaging ex vivo has been employed by Glickson and Chance groups to characterize mouse xenografts of five human melanoma cell lines with different levels of aggressiveness.28,34 Two of these melanoma cell lines originated from patients54,55 that were either most metastatic (C8161) or least metastatic/most indolent (A375P) among all five lines. A375P5 and A375P10 were lines selected after passing A375P cells through a Matrigel-coated membrane five or ten times, respectively. A375M was derived from the lung metastases of A375P in mouse xenografts. Their invasive potentials have been evaluated by using an in vitro Boyden chamber method, and are found to be in the following order: A375P(3%) < A375M(7%) < A375P10(9.5%) < A375P5(11%) < C8161(13.5%). The metastatic potentials of these five lines have been ranked as A375P < A375P5 < A375P10 < A375M < C8161 on the basis of counting lung metastases after intravenous injection into mice. The amount of metastases in distant organs ranks as A375P < A375M < C8161 for these three lines in subcutaneous mouse xenograft models. These cell lines were subcutaneously implanted into athymic nude mice, and tumors grew to 0.1–1 cm3 (6–13 mm in diameter) before the mice were sacrificed for redox scanning.
Tumor heterogeneity in mitochondrial redox images has been observed in all five melanomas. Apart from the indolent A375P melanoma, a distinct difference between tumor core and rim was observed in all other metastatic melanomas, with the core having higher Fp redox ratios (more oxidized) than the rim (Fig. 11). This tumor core–rim difference corresponds to a bimodal distribution or a double-peak in the histograms of Fp redox ratios. The peak with a higher Fp redox ratio corresponds to the more oxidized tumor core, whereas the peak with a lower Fp redox ratio corresponds to the relatively more reduced tumor rim. The mean Fp redox ratio in the oxidized region distinguished between these five melanoma lines with high significance (ANOVA, p = 7 × 10⁻⁸), but there was no significant difference in average tumor size among these lines (p = 0.7). Figure 12 shows an excellent correlation between the mean Fp redox ratios of the oxidized regions and the invasive potentials of all the melanoma lines (R2 = 0.97; p = 0.002). Less correlation (R2 = 0.63) was found between the global averages of Fp redox ratios across the whole tumor sections and the invasive potentials across the five lines. This result again supports the importance of having sub-millimeter high-resolution imaging to differentiate signals from tumor core and rim or different regions.
Fig. 11.
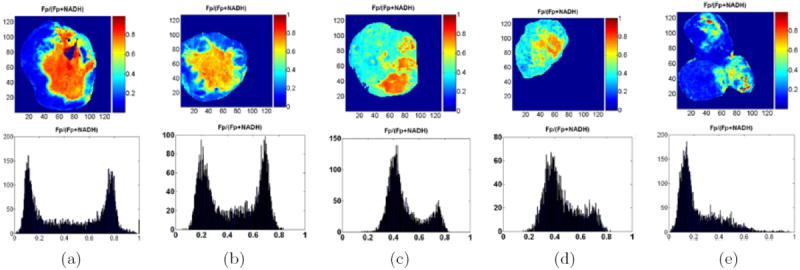
Typical melanoma Fp redox ratio images and corresponding histograms: (a) C8161, (b) A375P5, (c) A375P10, (d) A375M, (e) A375P, following the decreasing rank of invasive potential in vitro. Distinct differences were detected between the tumor cores and rims for all aggressive melanomas (a)–(d). The tumor cores were more oxidized with higher redox ratios than the rims. This is also evident in the bimodal distribution of the histograms showing the number of image pixels (y-axis) for specific redox ratios (x-axis). The least metastatic A375P melanoma is largely reduced with a single histogram peak of a relatively low redox ratio. Duplicated from Refs. 28 and 34 with permission from the publisher.
Fig. 12.
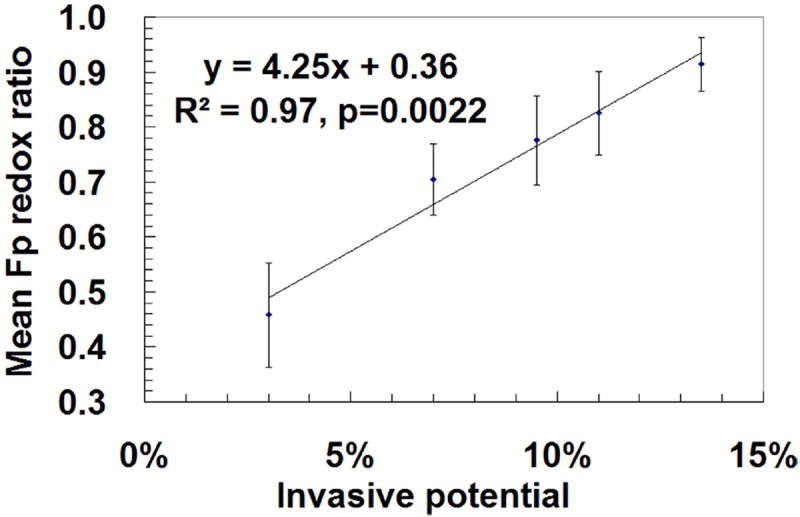
Correlation of the mean Fp redox ratios in oxidized tumor regions with the invasive potentials of five melanoma lines measured by the Boyden chamber method. For more aggressive melanomas with bimodal distributions in the histograms of redox ratios, the Fp redox ratios of the right peaks were taken as the mean value for corresponding tumor sections. The mean value of Fp redox ratio of the most indolent melanoma (A375P) was estimated from the redox ratios corresponding to the shoulder on the right side of the peak in the histograms (Fig. 11). The mean Fp redox ratios were averaged in the oxidized tumor areas across all tumor sections (total number of sections 12–29) pooled together from 3–5 tumors for each xenograft line. Linear regression, R2 = 0.97, p = 0.002. Reproduced with permission from Ref. 28.
The investigators also performed dynamic contrast-enhancement magnetic resonance imaging (DCE-MRI) on the most metastatic C8161 and least metastatic A375P. C8161 tumor had less blood transfer constant (Ktrans) than A375P in the tumor core, and also C8161 tumor core had less Ktrans than the C8161 tumor rim. Since Ktrans is dependent on blood perfusion and blood vessel permeability, the authors suggested that the more aggressive C8161 tumor core might have insufficient blood/nutrition supply and the cells were presumably under starvation (mitochondrial State 2). Limited nutrition supply was further supported by histology measurement of the microvasculature density using anti-CD31 marker and the microvasculature patency using the perfusion of Hoechst dye 33342. Although the more aggressive tumor had higher mean blood vessel density (probably due to angiogenesis), the patency seemed to be lower so that the tumors were more poorly perfused with an overall decrease in functional blood exchange. The mitochondria under starvation should exhibit strong Fp signals and low NADH as well as high Fp redox ratios, in consistence with the results of redox scanning. Therefore DCE-MRI and redox scanning suggested that harsh environment such as limited nutrition supply may correlate with the high metastatic potential of a tumor, i.e., the stressful environment favors the survival of cancer cells with a strong ability to migrate to a more favorable environment.
Similar observation has been obtained on breast cancer mouse xenografts (Fig. 8).42 CCD-based redox imaging showed that tumors from a more metastatic line MDA-MB-231 exhibited a more oxidized core and a relatively reduced rim. Tumors of a less metastatic line MCF-7 were more reduced in the central region without significant core–rim difference (Fig. 4). More details on redox scanning of these two breast cancer xenografts will be reported separately. Although mitochondrial functional abnormalities have been linked to tumorigenesis and malignancy, more studies are needed to understand the underlying mechanisms for the connection between mitochondrial redox states and tumor metastatic potential.
Mitochondrial redox imaging has also been applied to precancerous tissues ex vivo and in vivo by Ramanujam et al.50,56 The redox states of freeze-trapped human biopsy cervical tissue samples (including normal, inflammatory, and dysplastic tissues) were studied utilizing low-temperature NADH/Fp fluorescence imaging.56 These biopsy samples were first transferred to an OCT medium on ice and oriented properly in the medium within the first 30 seconds, and then transferred to liquid nitrogen for snap-freezing within another 30 seconds and maintained in liquid nitrogen until the fluorescence imaging measurement. This study showed significant heterogeneity in redox states within the tissue samples. The samples typically consisted of two tissue regions, i.e., epithelium and stroma, with significant NADH and Fp signal variations between the two regions. The Fp fluorescence in the stromal region of severely dysplastic tissue had more variation as a function of the tissue depth compared to the normal or inflammatory tissues. A significant decrease in the average Fp redox ratio in the epithelia of dysplastic tissues was also observed compared with normal, inflammatory and mildly dysplastic tissues [Fig. 13(a)]. The redox ratios in stroma were not reported because the authors were concerned about possible collagen contamination of the NADH fluorescence signal. The excitation filter for NADH channel in that study was centered at 365 nm with a width of 40 nm, whereas the collagen fibers had excitation and emission maxima at 325 nm and 390 nm, respectively. Nevertheless, their published data [Fig. 13(b)] appeared to indicate a higher, possibly with statistical significance, mean Fp redox ratio in the stroma of tissues with severe dysplasia compared to the normal tissue and the tissue with inflammation or mild dysplasia. Regarding the question of whether the one-minute time delay in the sample preparation procedure before snapfreezing could cause any changes in tissue redox state, the authors demonstrated that there was no difference in the average redox ratios in a liver biopsy sample undergoing a similar procedure compared with another liver sample obtained with an in situ snap-freezing procedure. However, it is not certain if the cervical tissue would respond to the time delay in a similar way as the liver tissue did. In fact significant redox ratio change was observed in mouse colons within one minute of tissue death induced by pentobarbital injection.44
Fig. 13.
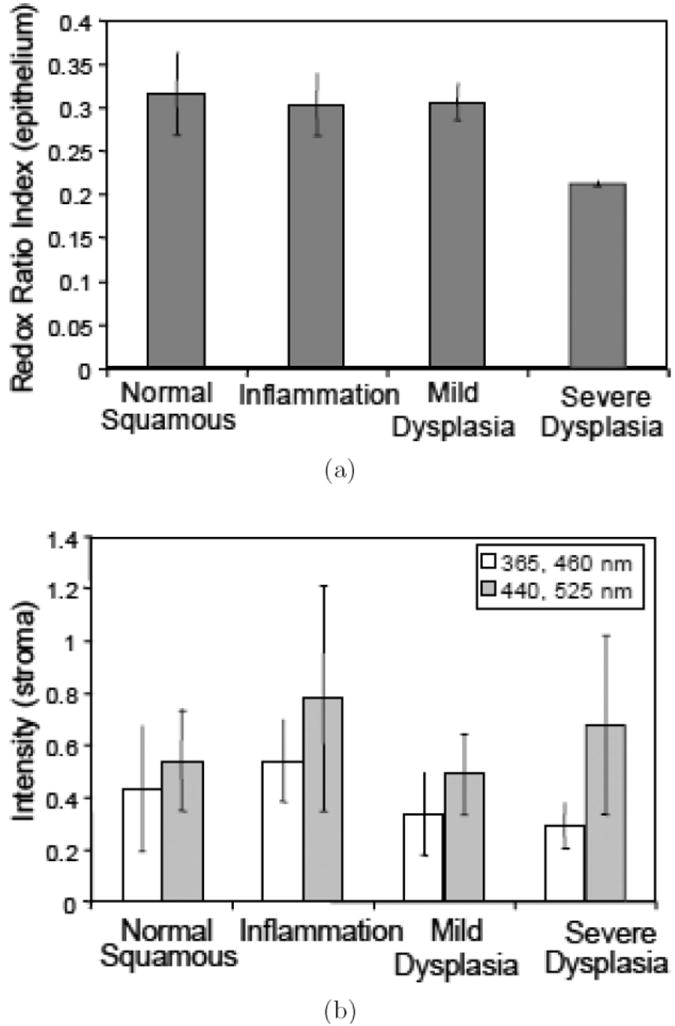
Low temperature redox imaging of human cervical tissues (normal, inflammatory, mildly dysplastic, and severely dysplastic). (a) Average redox ratio indices [Fp/(Fp+NADH)] in epithelia. (b) Average NADH (blank) and Fp (grey) signal intensities in stroma. Reproduced from Figs. 4 and 5 in Ref. 56 with permission.
In vivo redox imaging of the mucosa of cheek pouch was achieved by two-photon excitation (800 nm for NADH and 890 nm for Fp or FAD) at a sub-micron resolution on a hamster model of oral cancer.50 One advantage of this study is the combination of redox imaging with fluorescence lifetime imaging, which provided additional information about the lifetimes of free and bound states of NADH and Fp. Increased intracellular variability in the redox ratio index (Fp/NADH) and the bound NADH and Fp fluorescence lifetimes were observed in precancerous than in normal epithelial tissues. Redox ratios within the normal epithelium were shown to decrease significantly in basal epithelial cells compared with the cells in more superficial layers of epithelium. No significant difference in redox ratios was found between the basal and the superficial cells in precancerous tissues. Although it was reported the average redox ratio was not significantly different in precancerous tissue than in normal tissue, the increased heterogeneity in cellular redox state in precancerous tissue compared with normal tissue is consistent with aforementioned higher intratumor heterogeneity observed in metastatic melanoma and breast cancer mouse models compared with indolent ones.
In summary, significant tissue heterogeneities in mitochondrial redox state have been demonstrated in cancerous and precancerous tissues by aforementioned studies, and should be taken into serious consideration for the diagnosis of (pre)malignancy. The high Fp redox ratios in some local regions may be more effective in predicting levels of (pre)malignancy than the average redox ratio. More work is needed to better characterize the tissue heterogeneity to achieve this objective.
4.3. Tumor response to therapy
Mitochondrial redox imaging has also been applied to study tumor response to therapies. For example, Zhang et al.57 studied the effect of photodynamic therapy (PDT) on the metabolic state of tumor via monitoring the fluorescence signals of tumor mitochondrial redox states and the synthesized photosensitizer pyropheophorbide-2-deoxyglucosamide (Pyro-2DG), which was imported into cytoplasm by the glucose transporters.57 Pyro-2DG is a photosensitizer for PDT with an excitation peak at 664 nm, and an emission peak at 672 nm. Since the far-red or near infrared light in the 600–900 nm wavelength range can penetrate into tissue deeper than visible light with shorter wavelength, using Pyro-2DG as a photosensitizer is advantageous for deep tissue penetration. PDT was conducted by a point treatment procedure clamping a cut end fiber with a 1-mm core touching the skin top of the tumor. The intrinsic and extrinsic fluorescent signals were acquired with the 3D cryo-scanner from the snap-frozen 9L glioma rat xenografts post PDT treatment. Their results (Fig. 14) showed that the Pyro-2DG– induced PDT corresponded to a highly oxidized state of mitochondria in tumor cells. Increased Fp and decreased NADH signals indicated that flavoproteins and NADH were oxidized by singlet oxygen generated in the photosensitization process. They also observed high Fp/(Fp+PN) ratio in the surrounding area about 0.5 cm from the center of the irradiated zone, possibly due to the diffusive nature of light propagation. The correlation between the high Fp redox ratio and PDT response was confirmed by performing three sets of control experiments, i.e., tumors receiving pyro-2DG only, PDT treatment only, and neither PDT nor Pyro- 2DG. Their study indicated that the redox ratio was a sensitive indicator of PDT-induced tissue damage.
Fig. 14.
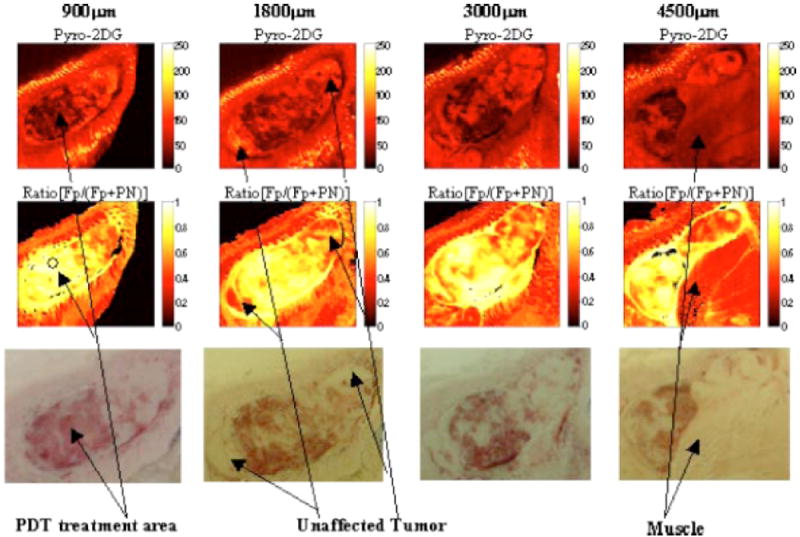
Redox images at a series of depths of 9L glioma treated with Pyro-2DG-based PDT. Top row: the images of Pyro- 2DG; middle row: the images of Fp redox ratio; bottom row: the photographic images taken by a digital camera. The x- and y- axes of the images represent the number of the pixels scanned (128 × 128 pixels for each image corresponding to 1.024 × 1.024 cm) and the color indicates the fluorescence intensity or redox ratio of the tissues. Reproduced with permission from Ref. 57.
5. Summary and Future Directions
We have reviewed the basic principles and advantages of mitochondrial redox imaging for biomedical applications including high-resolution NADH/Fp fluorescence imaging of in vivo mitochondrial metabolic state and the ratiometric approach that is independent of mitochondrial density and insensitive to hemodynamic artifacts. We have also included some recent developments and applications of redox imaging since 2001. A calibration procedure has been implemented to facilitate the comparison of NADH, Fp and redox ratios obtained at different times points and/or with different instrument settings. A newly developed CCD-based redox imager can achieve imaging much faster with higher resolution down to about 10 μm and has been applied to biological tissues snapfrozen or in vivo in real time at ambient temperature. Redox imaging of tissues at different times after the animal death indicates that NADH and Fp signals change significantly within a minute, and snap-freezing method for tissues that are either alive or within seconds after the animal death or detachment from the body is recommended to preserve the true in vivo tissue metabolic state.
Redox imaging has been applied to investigate mitochondrial metabolic states in cancer animal models, and redox ratios have been shown to correlate with tumor glucose metabolism, metastatic potential, and responses to photodynamic therapy. Redox imaging has also revealed significant heterogeneity in tissue redox state, which should be taken into account for more accurate characterization of cancer tissues to develop better diagnostic and therapeutic approaches for clinical applications. It is possible to translate redox imaging into clinical use with cryogenic biopsy specimens. Redox imaging can also be combined with two-photon optical imaging and/or endoscopy techniques50,52,58-61 to achieve redox imaging ex vivo/in vivo with potentially more clinical applications. It may be of research interest to compare or correlate mitochondrial redox imaging techniques with the NADH/FAD fluorescence lifetime imaging of tissue. It may also be useful to compare redox imaging with the measurement of GSSH/GSSG-coupled redox potential using redox-sensitive GFP probes developed by Tsien and co-workers.62
Acknowledgments
This work was partially supported by the Susan G. Komen Foundation Grant KG081069 (PI: L. Z. Li), The Center for Magnietic Resonance and Optical Imaging, and an NIH supported research resource (P41-RR02305, PI: R. Reddy).
References
- 1.Lehninger AL, Nelson DL, Cox MM. Principles of Biochemistry. Worth Publishers; New York: 1993. [Google Scholar]
- 2.Alberts B, Johnson A, Lewis J, Raff M, Roberts K, Walter P. Molecular Biology of the Cell. Garland Science; New York: 2002. [Google Scholar]
- 3.Berdanier CD. Mitochondria in Health and Disease. Taylor & Francis; New York: 2005. [Google Scholar]
- 4.Modica-Napolitano JS, Kulawiec M, Singh KK. Mitochondria and human cancer. Curr Mol Med. 2007;7:121–131. doi: 10.2174/156652407779940495. [DOI] [PubMed] [Google Scholar]
- 5.Lee HK. Mitochondria in diabetes mellitus. In: Berdanier CD, editor. Mitochondria in Health and Disease. Taylor & Francis; New York: 2005. pp. 377–454. [Google Scholar]
- 6.Balaban RS, Nemoto S, Finkel T. Mitochondria, oxidants, and aging. Cell. 2005;120:483–495. doi: 10.1016/j.cell.2005.02.001. [DOI] [PubMed] [Google Scholar]
- 7.Wallace DC. Mitochondrial diseases in man and mouse. Science. 1999;283:1482–1488. doi: 10.1126/science.283.5407.1482. [DOI] [PubMed] [Google Scholar]
- 8.Grandemange S, Herzig S, Martinou JC. Mitochondrial dynamics and cancer. Semin Cancer Biol. 2009;19:50–56. doi: 10.1016/j.semcancer.2008.12.001. [DOI] [PubMed] [Google Scholar]
- 9.Frezza C, Gottlieb E. Mitochondria in cancer: Not just innocent bystanders. Semin Cancer Biol. 2009;19:4–11. doi: 10.1016/j.semcancer.2008.11.008. [DOI] [PubMed] [Google Scholar]
- 10.Holley AK, St Clair DK. Watching the watcher: Regulation of p53 by mitochondria. Future Oncol. 2009;5:117–130. doi: 10.2217/14796694.5.1.117. [DOI] [PMC free article] [PubMed] [Google Scholar]
- 11.Tennant DA, Duran RV, Boulahbel H, Gottlieb E. Metabolic transformation in cancer. Carcinogenesis. 2009;30:1269–1280. doi: 10.1093/carcin/bgp070. [DOI] [PubMed] [Google Scholar]
- 12.Koch-Nolte F, Haag F, Guse AH, Lund F, Ziegler M. Emerging roles of NAD+ and its metabolites in cell signaling. Sci Signal. 2009;2:mr1. doi: 10.1126/scisignal.257mr1. [DOI] [PubMed] [Google Scholar]
- 13.Banerjee R. Redox Biochemistry. John Wiley & Sons; Hoboken, New Jersey: 2008. [Google Scholar]
- 14.Chance B, Williams GR. Respiratory enzymes in oxidative phosphorylation. 4. The respiratory chain. J Biol Chem. 1955;217:429–438. [PubMed] [Google Scholar]
- 15.Chance B, Williams GR. A method for the localization of sites for oxidative phosphorylation. Nature. 1955;176:250–254. doi: 10.1038/176250a0. [DOI] [PubMed] [Google Scholar]
- 16.Chance B, Baltscheffsky H. Respiratory enzymes in oxidative phosphorylation. 7. Binding of intramitochondrial reduced pyridine nucleotide. J Biol Chem. 1958;233:736–739. [PubMed] [Google Scholar]
- 17.Chance B. Pyridine nucleotide as an indicator of the oxygen requirements for energy-linked functions of mitochondria. Circ Res. 1976;38:I31–38. [PubMed] [Google Scholar]
- 18.Chance B, Cohen P, Jobsis F, Schoener B. Intracellular oxidation-reduction states in vivo. Science. 1962;137:499–508. doi: 10.1126/science.137.3529.499. [DOI] [PubMed] [Google Scholar]
- 19.Chance B. Spectrophotometric and kinetic studies of flavoproteins in tissues, cell suspensions, mitochondria and their fragments. In: Slater EC, editor. Flavins and Flavoproteins. Elsevier; Amsterdam: 1966. pp. 498–510. [Google Scholar]
- 20.Chance B, Cohen P, Jobsis F, Schoener B. Localized fluorometry of oxidation-reduction states of intracellular pyridine nucleotide in brain and kidney cortex of the anesthetized rat. Science. 1962;136:325. doi: 10.1126/science.136.3513.325. [DOI] [PubMed] [Google Scholar]
- 21.Hassinen I, Chance B. Oxidation-reduction properties of the mitochondrial flavoprotein chain. Biochem Biophys Res Commun. 1968;31:895–900. doi: 10.1016/0006-291x(68)90536-6. [DOI] [PubMed] [Google Scholar]
- 22.Chance B, Schoener B, Oshino R, Itshak F, Nakase Y. Oxidation-reduction ratio studies of mitochondria in freeze-trapped samples. NADH and flavoprotein fluorescence signals. J Biol Chem. 1979;254:4764–4771. [PubMed] [Google Scholar]
- 23.Chance B, Oshino N, Sugano T, Mayevsky A. Basic principles of tissue oxygen determination from mitochondrial signals. Adv Exp Med Biol. 1973;37A:277–292. doi: 10.1007/978-1-4684-3288-6_35. [DOI] [PubMed] [Google Scholar]
- 24.Chance B. Optical method. Ann Rev Biophys Biophys Chem. 1991;20:1–28. doi: 10.1146/annurev.bb.20.060191.000245. [DOI] [PubMed] [Google Scholar]
- 25.Quistorff B, Haselgrove JC, Chance B. High saptial resolution readout of 3-D metabolic organ structure: An automated, low-temperature redox ratioscanning instrument. Anal Biochem. 1985;148:389–400. doi: 10.1016/0003-2697(85)90244-1. [DOI] [PubMed] [Google Scholar]
- 26.Gu Y, Qian Z, Chen J, Blessington D, Ramanujam N, Chance B. High-resolution three-dimensional scanning optical image system for intrinsic and extrinsic contrast agents in tissue. Rev Sci Instrum. 2002;73:172–178. [Google Scholar]
- 27.Chance B, Schoener B. Fluorometric studies of flavin component of the respiratory chain. In: Slater EC, editor. Flavins and Flavoproteins. Elsevier; Amsterdam: 1966. pp. 510–519. [Google Scholar]
- 28.Li LZ, Zhou R, Xu HN, Moon L, Zhong TX, Kim EJ, Qiao H, Reddy R, Leeper D, Chance B, Glickson JD. Quantitative magnetic resonance and optical imaging biomarkers of melanoma metastatic potential. Proc Nat Acad Sci U S A. 2009;106:6608–6613. doi: 10.1073/pnas.0901807106. [DOI] [PMC free article] [PubMed] [Google Scholar]
- 29.Veech RL. The determination of the redox states and phosphorylation potential in living tissues and their relationship to metabolic control of disease phenotypes. Biochem Mol Biol Educ. 2006;34:168– 179. doi: 10.1002/bmb.2006.49403403168. [DOI] [PubMed] [Google Scholar]
- 30.Ozawa K, Chance B, Tanaka A, Iwata S, Kitai T, Ikai I. Linear correlation between acetoacetate beta-hydroxybutyrate in arterial blood and oxidized flavoprotein reduced pyridine-nucleotide in freeze-trapped human liver-tissue. Biochimica Et Biophysica Acta. 1992;1138:350–352. doi: 10.1016/0925-4439(92)90014-e. [DOI] [PubMed] [Google Scholar]
- 31.Nowell PC. Clonal evolution of tumor-cell populations. Science. 1976;194:23–28. doi: 10.1126/science.959840. [DOI] [PubMed] [Google Scholar]
- 32.Fidler IJ, Kripke ML. Metastasis results from preexisting variant cells within a malignant-tumor. Science. 1977;197:893–895. doi: 10.1126/science.887927. [DOI] [PubMed] [Google Scholar]
- 33.Fidler IJ, Hart IR. Biological diversity in metastatic neoplasms — origins and implications. Science. 1982;217:998–1003. doi: 10.1126/science.7112116. [DOI] [PubMed] [Google Scholar]
- 34.Li LZ, Zhou R, Zhong T, Moon L, Kim EJ, Qiao H, Pickup S, Hendrix MJ, Leeper D, Chance B, Glickson JD. Predicting melanoma metastatic potential by optical and magnetic resonance imaging. Adv Exp Med Biol. 2007;599:67–78. doi: 10.1007/978-0-387-71764-7_10. [DOI] [PMC free article] [PubMed] [Google Scholar]
- 35.Xu HN, Zhou R, Nioka S, Chance B, Glickson JD, Li LZ. Histological basis of MR/optical imaging of human melanoma mouse xenografts spanning a range of metastatic potentials. Adv Exp Med Biol. 2009;645:247–253. doi: 10.1007/978-0-387-85998-9_37. [DOI] [PMC free article] [PubMed] [Google Scholar]
- 36.Hillman EMC. Optical brain imaging in vivo: Techniques and applications from animal to man. J Biomed Opt. 2007;12:051402. doi: 10.1117/1.2789693. [DOI] [PMC free article] [PubMed] [Google Scholar]
- 37.Mayevsky A, Chance B. Oxidation-reduction states of NADH in vivo: From animals to clinical use. Mitochondrion. 2007;7:330–339. doi: 10.1016/j.mito.2007.05.001. [DOI] [PubMed] [Google Scholar]
- 38.Shibuki K, Hishida R, Murakami H, Kudoh M, Kawaguchi T, Watanabe M, Watanabe S, Kouuchi T, Tanaka R. Dynamic imaging of somatosensory cortical activity in the rat visualized by flavoprotein autofluorescence. J Physiol Lond. 2003;549:919–927. doi: 10.1113/jphysiol.2003.040709. [DOI] [PMC free article] [PubMed] [Google Scholar]
- 39.Weber B, Burger C, Wyss MT, von Schulthess GK, Scheffold F, Buck A. Optical imaging of the spatiotemporal dynamics of cerebral blood flow and oxidative metabolism in the rat barrel cortex. Eur J Neurosci. 2004;20:2664–2670. doi: 10.1111/j.1460-9568.2004.03735.x. [DOI] [PubMed] [Google Scholar]
- 40.Yuan Y, Li YF, Cameron BD, Relue P. Fluorescence anisotropy of cellular NADH as a tool to study different metabolic properties of human melanocytes and melanoma cells. IEEE J Sel Top Quant Electron. 2007;13:1671–1679. [Google Scholar]
- 41.Xu HN, Wu B, Nioka S, Chance B, Li LZ. Optical Tomography and Spectroscopy of Tissue VIII. SPIE; San Jose, CA, USA: 2009. Calibration of redox scanning for tissue samples; pp. 71742F–8. [DOI] [PMC free article] [PubMed] [Google Scholar]
- 42.Xu HN, Wu B, Nioka S, Chance B, Li LZ. Medical Imaging 2009: Biomedical Applications in Molecular, Structural, and Functional Imaging. SPIE; Lake Buena Vista, FL, USA: 2009. Calibration of CCD-based redox imaging for biological tissues; pp. 72622F–7. [Google Scholar]
- 43.Ghosh AK, Finegold D, White W, Zawalich K, Matschinsky FM. Quantitative histochemical resolution of the oxidation-reduction and phosphate potentials within the simple hepatic acinus. J Biol Chem. 1982;257:5476–5481. [PubMed] [Google Scholar]
- 44.Ranji M, Nioka S, Xu HN, Wu B, Li LZ, Jaggard DL, Chance B. Fluorescent images of mitochondrial redox states in in situ mouse hypoxic ischemic intestines. J Innov Opt Health Sci. 2009;2(4):365–374. [Google Scholar]
- 45.Mayevsky A, Rogatsky GG. Mitochondrial function in vivo evaluated by NADH fluorescence: From animal models to human studies. Am J Physiol Cell Physiol. 2007;292:C615–640. doi: 10.1152/ajpcell.00249.2006. [DOI] [PubMed] [Google Scholar]
- 46.Mayevsky A. Shedding light on life: Optical assessment of mitochondrial function and tissue vitality in biology and medicine. J Innov Opt Health Sci. 2008;1:71–83. [Google Scholar]
- 47.Reinert KC, Dunbar RL, Gao W, Chen G, Ebner TJ. Flavoprotein autofluorescence imaging of neuronal activation in the cerebellar cortex in vivo. J Neurophysiol. 2004;92:199–211. doi: 10.1152/jn.01275.2003. [DOI] [PubMed] [Google Scholar]
- 48.Zhuo S, Chen J, Luo T, Jiang X, Xie S, Chen R. Two-layered multiphoton microscopic imaging of cervical tissue. Lasers Med Sci. 2009;24:359–363. doi: 10.1007/s10103-008-0570-2. [DOI] [PubMed] [Google Scholar]
- 49.Tiede LM, Rocha-Sanchez SM, Hallworth R, Nichols MG, Beisel K. Determination of hair cell metabolic state in isolated cochlear preparations by two-photon microscopy. J Biomed Opt. 2007;12:021004. doi: 10.1117/1.2714777. [DOI] [PMC free article] [PubMed] [Google Scholar]
- 50.Skala MC, Riching KM, Gendron-Fitzpatrick A, Eickhoff J, Eliceiri KW, White JG, Ramanujam N. In vivo multiphoton microscopy of NADH and FAD redox states, fluorescence lifetimes, and cellular morphology in precancerous epithelia. Proc Natl Acad Sci U S A. 2007;104:19494–19499. doi: 10.1073/pnas.0708425104. [DOI] [PMC free article] [PubMed] [Google Scholar]
- 51.Zhuo S, Chen J, Cao N, Jiang X, Xie S, Xiong S. Imaging collagen remodeling and sensing transplanted autologous fibroblast metabolism in mouse dermis using multimode nonlinear optical imaging. Phys Med Biol. 2008;53:3317–3325. doi: 10.1088/0031-9155/53/12/017. [DOI] [PubMed] [Google Scholar]
- 52.Lyubovitsky JG, Spencer JA, Krasieva TB, Andersen B, Tromberg BJ. Imaging corneal pathology in a transgenic mouse model using nonlinear microscopy. J Biomed Opt. 2006;11:014013. doi: 10.1117/1.2163254. [DOI] [PubMed] [Google Scholar]
- 53.Zhang ZH, Li H, Liu Q, Zhou LL, Zhang M, Luo QM, Glickson J, Chance B, Zheng G. Metabolic imaging of tumors using intrinsic and extrinsic fluorescent markers. Biosens Bioelectr. 2004;20:643–650. doi: 10.1016/j.bios.2004.03.034. [DOI] [PubMed] [Google Scholar]
- 54.Welch DR, Bisi JE, Miller BE, Conaway D, Seftor EA, Yohem KH, Gilmore LB, Seftor RE, Nakajima M, Hendrix MJ. Characterization of a highly invasive and spontaneously metastatic human malignant melanoma cell line. Int J Cancer. 1991;47:227–237. doi: 10.1002/ijc.2910470211. [DOI] [PubMed] [Google Scholar]
- 55.Kozlowski JM, Hart IR, Fidler IJ, Hanna N. A human melanoma line heterogeneous with respect to metastatic capacity in athymic nude mice. J Nat Cancer Inst. 1984;72:913–917. [PubMed] [Google Scholar]
- 56.Ramanujam N, Richards-Kortum R, Thomsen S, Mahadevan-Jansen A, Follen M, Chance B. Low temperature fluorescence imaging of freeze-trapped human cervical tissues. Opt Express. 2001;8:335–343. doi: 10.1364/oe.8.000335. [DOI] [PubMed] [Google Scholar]
- 57.Zhang Z, Blessington D, Li H, Busch TM, Glickson J, Luo Q, Chance B, Zheng G. Redox ratio of mitochondria as an indicator for the response of photodynamic therapy. J Biomed Opt. 2004;9:772–778. doi: 10.1117/1.1760759. [DOI] [PubMed] [Google Scholar]
- 58.Contag CH. In vivo pathology: Seeing with molecular specificity and cellular resolution in the living body. Ann Rev Pathol. 2007;2:277–305. doi: 10.1146/annurev.pathol.2.010506.091930. [DOI] [PubMed] [Google Scholar]
- 59.Cicchi R, Sacconi L, Jasaitis A, O’Connor RP, Massi D, Sestini S, De Giorgi V, Lotti T, Pavone FS. Multidimensional custom-made non-linear microscope: From ex-vivo to in-vivo imaging. Appl Phys B Lasers Opt. 2008;92:359–365. [Google Scholar]
- 60.Konig K, Ehlers A, Riemann I, Schenkl S, Buckle R, Kaatz M. Clinical two-photon microendoscopy. Microsc Res Tech. 2007;70:398–402. doi: 10.1002/jemt.20445. [DOI] [PubMed] [Google Scholar]
- 61.Bao HC, Allen J, Pattie R, Vance R, Gu M. Fast handheld two-photon fluorescence microendoscope with a 475 microm × 475 microm field of view for in vivo imaging. Opt Lett. 2008;33:1333–1335. doi: 10.1364/ol.33.001333. [DOI] [PubMed] [Google Scholar]
- 62.Dooley CT, Dore TM, Hanson GT, Jackson WC, Remington SJ, Tsien RY. Imaging dynamic redox changes in mammalian cells with green fluorescent protein indicators. J Biol Chem. 2004;279:22284–22293. doi: 10.1074/jbc.M312847200. [DOI] [PubMed] [Google Scholar]
- 63.Rocheleau JV, Head WS, Piston DW. Quantitative NAD(P)H/flavoprotein autofluorescence imaging reveals metabolic mechanisms of pancreatic islet pyruvate response. J Biol Chem. 2004;279:31780–31787. doi: 10.1074/jbc.M314005200. [DOI] [PubMed] [Google Scholar]
- 64.Nichols MG, Barth EE, Nichols JA. Reduction in DNA synthesis during two-photon microscopy of intrinsic reduced nicotinamide adenine Dinucleotide Fluorescence. Photochem Photobiol. 2005;81:259–269. doi: 10.1562/2004-08-05-RA-263. [DOI] [PubMed] [Google Scholar]
- 65.Zelent B, Troxler T, Vanderkooi JM. Temperature dependence for fluorescence of β-NADH in glycerol/ water solution and in trehalose/sucrose glass. J Fluorescence. 2007;17:37–42. doi: 10.1007/s10895-006-0146-0. [DOI] [PubMed] [Google Scholar]
- 66.Xu HN, Wu B, Nioka S, Chance B, Li LZ. Quantitative redox scanning of tissue samples using a calibration procedure. J Innov Opt Health Sci. 2009;2:375–385. doi: 10.1142/S1793545809000681. [DOI] [PMC free article] [PubMed] [Google Scholar]