Abstract
Quantitative computed tomography (QCT) is increasingly used in osteoporosis studies to assess volumetric bone mineral density (vBMD), bone quality and strength. However, QCT is confronted by technical issues in the clinical research setting, such as potentially confounding effects of body size on vBMD measurements and lack of standard approaches to scanner cross-calibration, which affects measurements of vBMD in multicenter settings. In this study, we addressed systematic inter-scanner differences and subject-dependent body size errors using a novel anthropomorphic hip phantom, containing a calibration hip to estimate correction equations, and a contralateral test hip to assess the quality of the correction. We scanned this phantom on four different scanners and we applied phantom-derived corrections to in-vivo images of 16 postmenopausal women scanned on two scanners. From the phantom study, we found that vBMD decreased with increasing phantom size in three of four scanners and that inter-scanner variations increased with increasing phantom size. In the in vivo study, we observed that inter-scanner corrections reduced systematic inter-scanner mean vBMD differences but that the inter-scanner precision error was still larger than expected from known intra-scanner precision measurements. In conclusion, inter-scanner corrections and body size influence should be considered when measuring vBMD from QCT images.
Keywords: Quantitative computed tomography, bone mineral density, anthropomorphic hip phantom, inter-scanner differences, body size
Introduction
Quantitative computed tomography (QCT) is increasingly employed to assess volumetric bone mineral density (vBMD), bone quality and bone strength in epidemiologic studies and clinical trials of osteoporosis (Adams, 2009; Thomas F Lang, 2010). Geometry, structure and density of cortical and trabecular compartments constitute the primary quantitative information from QCT images; bone strength and stiffness derive from finite element models based on voxel-based material properties across whole bone geometry. Precise quantification of bone parameters is fundamental to assess bone quality and to calculate fracture risk.
For the last 30 years, lack of standardization among CT scanners has been one of the main issues when quantifying vBMD (Birnbaum, Hindman, Lee, & Babb, 2007; Cann, 1988; Carpenter et al., 2014; Goodsitt, 1992; Levi, Gray, McCullough, & Hattery, 1982; Suzuki, Yamamuro, Okumura, & Yamamoto, 1991). Inter-scanner differences are systematic, due to different hardware and software of CT systems. Differences in vBMD measurement occur in multicenter studies, where data from different CT systems are combined; in longitudinal studies, where scanner substitution can cause differences in baseline and followup acquisitions, and when comparing similar data from different studies. Similarly to CT, lack of standardization was investigated for dual-energy X-ray absorptiometry (DXA) scanners two decades ago. Inter-scanner differences were addressed by introducing correction factors that reduced inter-scanner errors to intra-scanner precision errors (Genant et al., 1994; Hanson, 1997).
Susceptibility to subject body size constitutes another major source of error when measuring vBMD from QCT images (Cann, 1988; Goodsitt, 1992; Yu, Thomas, Brown, & Finkelstein, 2012). The beam hardening effect causes underestimation of vBMD values for large body sizes, compromising measurement accuracy and precision. Although scanners have hardware and software corrections for beam hardening, body size-dependent beam hardening may add a subject-dependent component to the systematic inter-scanner error. In studies investigating bone quality in relation to considerable weight loss, incorrect estimation of vBMD due to body size represents a major issue. Recently, Yu et al. (Yu et al., 2013) showed discordant vBMD changes from DXA and QCT for subjects that underwent bariatric surgery. Discordances were predominant for femur measurements, where thick layers of lean and fat tissue caused remarkable beam hardening effects.
In this study, we investigated inter-scanner error and subject-dependent body size influences on vBMD measurements from different CT systems. To this aim, we designed a novel anthropomorphic hip phantom that simulates the beam hardening environment of the human pelvis. The phantom contains inserts representing hips and pelvis, and has girdles to simulate increasing body sizes. We scanned the phantom on four different CT scanners, and we calculated the inter-scanner error from vBMD values of one hip, defined as calibration hip. Finally, we tested the quality of our corrections on the contralateral hip of the phantom, defined as the test hip, and on in-vivo images.
Methods
Anthropomorphic Hip Phantom and Human Subjects
To study the effect of inter-scanner differences and body size on vBMD measurements, we designed a hip phantom that simulates anatomy and the beam-hardening environment of the human pelvis. The phantom is composed of a plastic structure filled with distilled water, and contains removable hip and pelvis inserts with defined concentrations of hydroxyapatite (HA) (see details in figure 1(b)). The femoral heads are homogeneous spheres, whereas the greater trochanters are composed of two concentric bodies, simulating cortical bone and trabecular bone. The two femoral neck inserts differ in shape and concentrations of HA because of their distinctive functions in vBMD correction. The calibration neck covers the range of bone HA concentrations and is used to calculate the correction equations for vBMD measurements. The test neck has two variants, simulating either a femoral neck from an old subject or a femoral neck from a young normal subject. The test hip inserts are used to assess the quality of the estimated correction. The two hips are combined with pelvises of different HA concentrations, lower for the old test hip and higher for the young test hip. The original phantom has a circumference of 89.5 cm, corresponding to a small subject (BMI ≈ 20). To simulate increased body size, we designed two pelvic girdles with circumferences of 102.5 cm and 115.3 cm, corresponding to a medium-sized (BMI ≈ 25) and obese subject (BMI ≈ 32). Each girdle has two layers, the inner representing lean tissue, and the outer representing adipose tissue. The phantom was produced by QRM (Erlagen, Germany).
Figure 1.
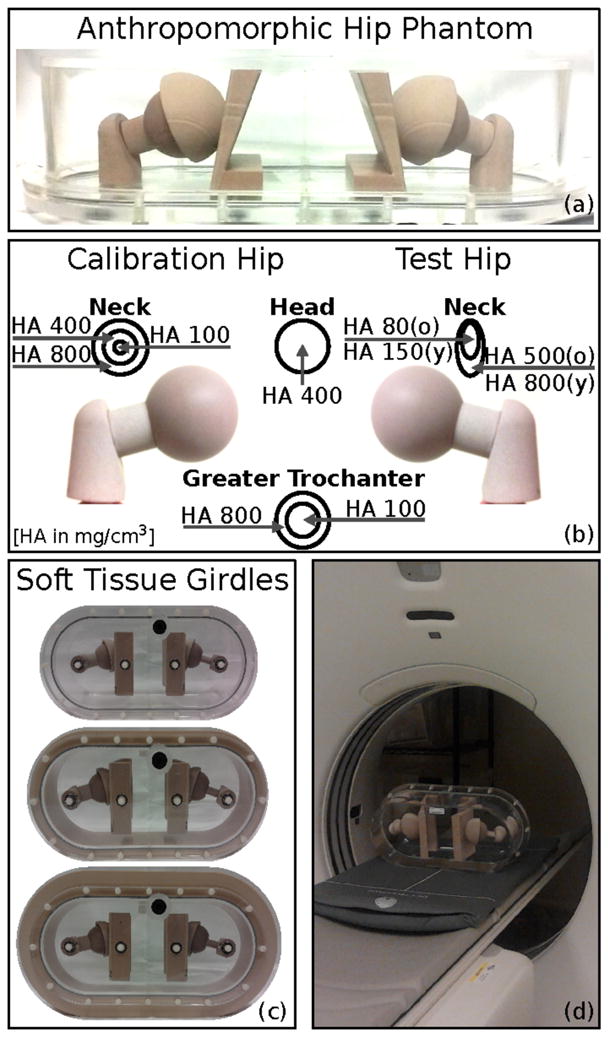
Anthropomorphic hip phantom. (a) Frontal view of the anthropomorphic hip phantom. (b) Concentration of HA in head, neck and greater trochanters for calibration hip and test hip. The pelvis inserts associated the old test hip contained 200 mg/cm3 of HA, whereas the pelvis inserts associated to the young test hip contained 400 mg/cm3 of HA. (c) Phantom with no, small and large girdle to simulate increasing body sizes. (d) The anthropomorphic hip phantom was scanned on top of a calibration phantom, which contains three chambers of 0, 75 and 150 mg/cm3 of HA, to convert Hounsfield Units to concentrations of HA.
To evaluate the effects of inter-scanner corrections on human subjects, we analyzed images from 16 women recruited from the area surrounding our institution. We excluded subjects with previous total hip arthroplasty and those with metal inserts in the thigh. Details about the subjects are shown in table 1. All subjects provided informed consent to participate in this study, and the Committee on Human Research at University of California San Francisco approved the study procedures.
Table 1.
Characteristics of the 16 female subjects involved in the study.
| Age [years] | Height [m] | Weight [Kg] | Body Mass Index [kg/m3] | Subject Circumference [cm] | |
|---|---|---|---|---|---|
| Mean ± Std. Dev. | 64 ± 3 | 1.67 ± 0.11 | 70 ± 17 | 25.0 ± 4.8 | 97.1 ± 8.7 |
| Range | 59 – 69 | 1.47 – 1.93 | 50 – 110 | 18.3 – 32.8 | 82.9 – 107.9 |
Assessment of inter-scanner vBMD differences as a function of phantom size
To calculate and evaluate inter-scanner corrections for different phantom settings, we applied the pipeline described in figure 2. First, we acquired the images for the hip phantom and subjects on different scanners, calibrated the images, and calculated vBMD for necks and greater trochanters. Then, we computed the inter-scanner corrections on the phantom calibration hip. Finally, we evaluated the quality of the correction on the phantom test hip and on the subject’s left hips. Below, we provide more details about each step.
Figure 2.
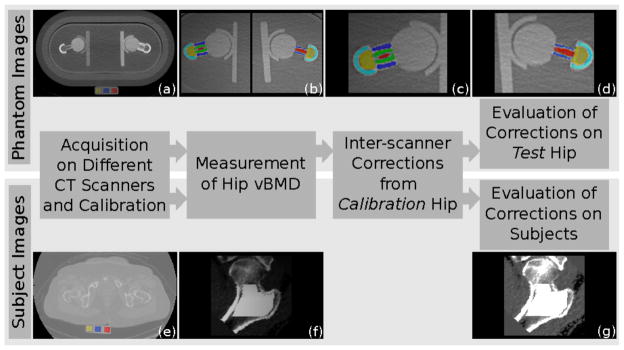
Calculation and evaluation of inter-scanner correction for anthropomorphic hip phantom and human subjects. First, we acquired images of the anthropomorphic hip phantom (a) and human subjects (e) on different CT scanners, and we calibrated the images to convert Hounsfield Units to concentration of hydroxyapatite. From the calibrated images, we measured bone mineral density of neck and greater trochanter ((b) and (f)). Then, we calculated the inter-scanner correction for different body sizes and phantom configurations using the calibration hip (c). Finally, we evaluated the quality of the corrections on the test hip of the anthropomorphic hip phantom (d) and on the subjects’ left hip (g).
Acquiring and calibrating images
We scanned the anthropomorphic hip phantom on four different scanners, two GE VCT 64 systems, situated at UCSF and Mayo Clinic, one Siemens Biograph located at UCSF, and one Siemens Definition Flash at Mayo Clinic. For each scanner, we acquired six images of the phantom, alternating between the young and old test hip, and combining with no, small or large girdle. We scanned human subjects on the two systems located at UCSF (GE VCT 64 system and Siemens Biograph). For all acquisitions, we set the scanner parameters as shown in table 2. We scanned both anthropomorphic hip phantoms (figure 1(b)) and subjects on top of a calibration phantom (Image Analysis, Inc., Columbia, KY, USA) to convert images from Hounsfield Units to vBMD. For each image slice, we calculated linear regressions between the average Hounsfield Unit of each region (yellow, blue and red regions in figure 2(a) and 2(e)) and the corresponding amounts of hydroxyapatite contained in that region (0, 75, 150 mg/cm3). We applied the regression equation to each voxel of the image to obtain maps of vBMD.
Table 2.
Parameters for the acquisition of anthropomorphic hip phantom and human subjects. We used the same scanner settings as for clinical use. The parameters were the same for all scanners, except exposure time and slice thickness.
| Image Acquisition | ||
|---|---|---|
| Parameters | Phantom | Subjects |
| kVp | 120 | 120 |
| X-ray tube Current [mA] | 150 | 150 |
| Pitch | 1 | 1 |
| Exposure Time [ms] | 500(b), 1000(a,c,d) | 500(b), 1000(d) |
| Data Collection Diameter [cm] | 50 | 50 |
| Image Reconstruction | ||
|---|---|---|
| Parameters | Phantom | Subjects |
| Reconstruction Kernel | Standard(a,b), B41s(c,d) | Standard(b), B41s(d) |
| Pixel Spacing [mm] | 0.9766 | 0.9766 |
| Matrix Size [n. of pixels] | 512 × 512 | 512 × 512 |
| Slice Thickness [mm] | 1.00(c,d), 1.25(a,b) | 2.50(b), 3.00(d) |
= GE VCT 64 system at Mayo,
= GE VCT 64 system at UCSF,
= Siemens Definition Flash at Mayo,
= Siemens Biograph at UCSF
Measuring bone mineral density
We calculated cortical, trabecular and integral vBMD for the femoral neck and trochanteric regions of the phantom femora. For the subjects, we quantified the cortical, trabecular and integral vBMD of the total femur region, which encompassed both the femoral neck and trochanteric regions.
In the phantom images, we identified the volumes of interest by automatic segmentation based on image registration (figure 3). We randomly selected a phantom image as reference and we segmented both hips excluding a layer of boundary voxels that would be subject to partial volume effect voxels that could over- or under-estimate vBMD depending on the location. Then, we aligned the hips of the current phantom image to the hips of the reference image using an affine transformation. Finally, we applied the inverse affine transformation to the reference hip masks to segment the hip in the current image. We evaluated the quality of the automatic segmentation visually. From the segmented images, we calculated the vBMD of femoral neck and trochanteric regions, averaging the values in each region. To segment the reference hips we used ITK-snap (Yushkevich et al., 2006), and to compute the affine transformations we used MedInria (Ourselin, Roche, Prima, & Ayache, 2004) (Sophia Asclepios, Nice, France) and ITK 4.3 (Insight Toolkit, Kitware).
Figure 3.
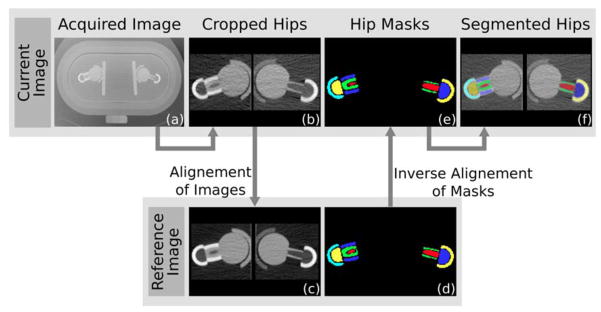
Automatic segmentation of neck and greater trochanter of the phantom hips. For each image of the dataset (a), we cropped the two hips (b), and we registered them to the hips of the reference image (c). Then we applied the inverse transformation to the reference hip masks (d) to obtain the masks of the current hips (e) and thus the completely segmented hips (f).
From the segmented images, we also computed short-term precision for the Siemens and the GE Systems located at the Mayo Clinic, repositioning the phantom between acquisitions.
In the subject images, we calculated bone mineral densities in the left hip using a validated method described previously (T F Lang et al., 1997). Briefly, for each subject, we resampled the image along the neck axis, and we segmented neck and greater trochanter using a threshold-driven region-growing algorithm (figure 2(f)). We separated cortical and trabecular bone combining thresholding and morphological operators, and we calculated vBMD as average over the voxels.
Calculating and evaluating inter-scanner corrections
For each phantom configuration (old/young, no/small/large girdle), we calculated the correction equation for the phantom calibration hip. We first cross-calibrated scanners from the same manufacturer, i.e. Siemens at UCSF against Siemens at Mayo and GE at UCSF against GE at Mayo, and then we cross-calibrated all scanners to a reference scanner, chosen as the scanner with lowest susceptibility to variations in body size. We calculated the correction equation as a linear regression between vBMD values of the current scanner against the reference scanner, obtaining slope (m) and the intercept (b). We applied the correction equation to measured vBMD (vBMDmeasured) of the phantom test hip, and we obtained vBMD corrected for inter-scanner error (vBMDcorrected):
| (1) |
To correct the subjects’ vBMD, we chose the phantom configuration with old test neck and no girdle, because of subjects’ age and body size. Subjects’ body size was calculated directly from CT images, as illustrated in figure 4. Because of discrepancies between the slice thicknesses of subjects’ images and phantom images (2.5–3.0 mm for subjects and 1.0–1.25 for phantom), we down-sampled the UCSF Siemens and GE phantom images from a slice thickness of 1 and 1.25 mm to 2.5 mm. We computed vBMD and inter-scanner correction equation for the GE system against the Siemens system, as explained in the previous paragraph. For each subject, we calculated integral and trabecular bone vBMD as:
| (2) |
where mdown-sampled and bdown-sampled are slope and intercept calculated from the down-sampled images of the phantom with old test neck and without girdle. To calculate cortical bone vBMD (vBMDcortical), we applied a further correction:
| (3) |
where R is the ratio between test neck cortical vBMD measured from Siemens images over test neck cortical vBMD measured from GE images. We performed all computations using Matlab 8.0 (The MathWorks, Inc., Natick, MA, United States).
Figure 4.

Calculation of the body circumference from CT images of the subjects. For each subject, we selected the image slice at the femoral necks (a), and we combined contrast enhancement and thresholding to obtain the body mask (b). We removed the calibration phantom using the Hough Transform (c) and we calculated the circumference of the subject as the perimeter of the binary mask (d).
Statistical analysis
We calculated CT image calibration and inter-scanner corrections using linear regressions. For phantom vBMD corrections, we compared inter-scanner differences before and after correction with paired T-tests adjusting for Bonferroni correction, root mean square (RMS) differences of vBMD and Bland-Altman analysis.
For subject vBMD corrections, we compared vBMD values before and after correction, using mean, standard deviation, paired T-test, coefficient of variation and precision. For each subject, we calculated the coefficient of variation (CV) as:
| (3) |
where vBMDGE is the vBMD calculated from the GE images, vBMDSiemens is the vBMD calculated from the Siemens images, and is the average of vBMDGE and vBMDSiemens. We computed precision as the root-mean-square of CVs (Glüer, Blake, Lu, & Blunt, 1995):
| (4) |
where N is the number of subjects (i.e. 16).
Results
Measuring vBMD for the anthropomorphic hip phantom, calculating inter-scanner correction equations and correcting inter-scanner differences
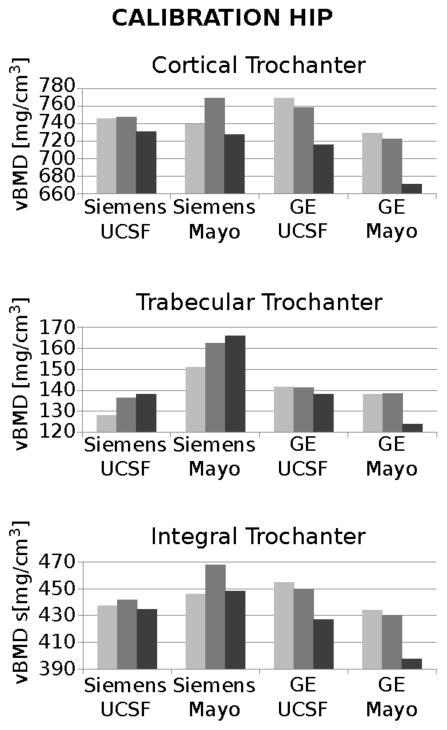
At the calibration hip, measurement of vBMD differed for phantom body size and hip compartment. Intra-scanner differences of vBMD were larger for the phantom scanned with a large girdle than with no/small girdle for the two GE scanners and for the Siemens scanner at Mayo Clinic (figure 5). The Siemens at UCSF was the most stable scanner with respect to body size; therefore we chose it as the reference for inter-scanner corrections. Inter-scanner differences of vBMD were larger in the cortical compartments of the greater trochanter and femoral neck for all scanners, and increased with increasing phantom body size.
Figure 5.
Calibration hip vBMD for the four CT systems at different phantom body sizes. The three graphs show vBMD for cortical, trabecular and integral trochanter; for each scanner, vBMD values derive from images of the phantom with no, small and large girdle. The graphs have different scales to appreciate intra272 and inter-scanner variations.
For the Siemens system, short-term precision in terms of percentage root mean square of coefficient of variations (CVRMS) was 3.3% for the calibration hip and 2.4% for the test hip; for the GE system, CVRMS was 2.3% for the calibration hip and 2.5% for the test hip.
In the inter-scanner regressions comparing scanners from the same manufacturer, the GE systems had smaller slope and larger standard error values than the Siemens systems, except for the phantom configuration with young hip with large girdle. In the inter-scanner regressions against the Siemens system located at UCSF, slopes and intercepts were larger for configurations with small and large girdles, and for the GE systems (slopes range: 0.92–1.12; intercept range: 2.56–17.82). Standard errors of prediction were larger for the larger girdle. Inter-scanner corrections were calculated on regions of 28278 ± 242 voxels (mean ± standard deviation) (table 3).
Table 3.
Regression lines to correct measurements of vBMD for the four different scanners used in this study. We regressed the values acquired with the Siemens and GE systems located at the Mayo Clinic against the corresponding systems located at UCSF, and then we regressed the vBMD values from the images acquired with the Siemens system located at Mayo and the two GE systems against the values acquired with the Siemens System at UCSF.
| Siemens at UCSF (Reference) | Siemens at Mayo Against Siemens at UCSF | GE at UCSF Against Siemens at UCSF | GE at Mayo Against Siemens at UCSF | GE at Mayo Against GE at UCSF | |
|---|---|---|---|---|---|
| Old - No Girdle | |||||
| m | - | 1.04 | 0.99 | 1.02 | 1.02 |
| b | - | −38.96 | −14.28 | −18.36 | −3.90 |
| Standard Error | - | 11.96 | 2.56 | 15.49 | 17.41 |
| Volume (voxels) | 28294 | 28004 | 28508 | 28087 | 28087 |
| Old - Small Girdle | |||||
| m | - | 1.02 | 1.03 | 1.02 | 0.99 |
| b | - | −35.54 | −18.96 | −11.43 | 8.45 |
| Standard Error | - | 5.11 | 10.47 | 16.11 | 21.60 |
| Volume (voxels) | 28418 | 27914 | 28611 | 28143 | 28143 |
| Old - Large Girdle | |||||
| m | - | 1.09 | 1.07 | 1.09 | 1.02 |
| b | - | −68.73 | −12.70 | −4.73 | 8.98 |
| Standard Error | - | 20.41 | 13.73 | 8.10 | 17.38 |
| Volume (voxels) | 28300 | 28081 | 28617 | 28187 | 28187 |
| Young - No Girdle | |||||
| m | - | 1.06 | 0.99 | 1.05 | 1.06 |
| b | - | −45.11 | −11.94 | −21.75 | −10.04 |
| Standard Error | - | 16.44 | 4.67 | 19.76 | 17.91 |
| Volume (voxels) | 28413 | 28226 | 28519 | 28084 | 28084 |
| Young - Small Girdle | |||||
| m | - | 1.06 | 1.05 | 1.03 | 0.98 |
| b | - | −45.90 | −20.71 | −9.42 | 11.25 |
| Standard Error | - | 16.45 | 8.85 | 5.93 | 10.74 |
| Volume (voxels) | 28567 | 27945 | 28319 | 28034 | 28034 |
| Young - Large Girdle | |||||
| m | - | 1.06 | 1.12 | 1.12 | 1.00 |
| b | - | −59.84 | −23.28 | −15.97 | 6.70 |
| Standard Error | - | 23.12 | 8.44 | 8.42 | 6.25 |
| Volume (voxels) | 28475 | 28220 | 28753 | 27959 | 27959 |
m = slope, b = intercept, Standard Error = standard error of prediction, Volume = volume of the analyzed calibration hip in number of voxels and mm3.
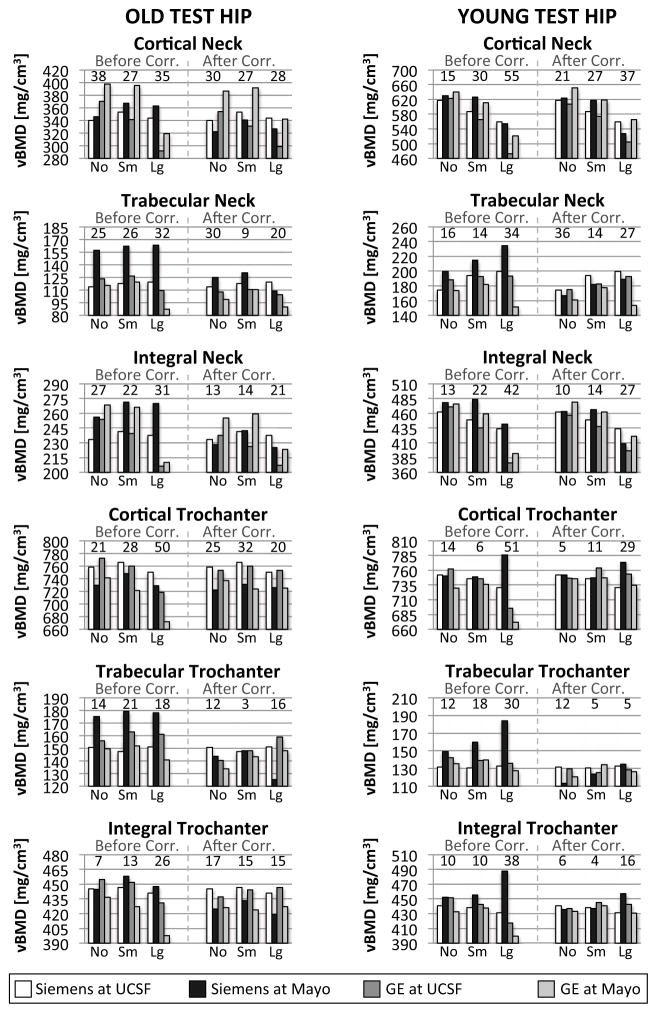
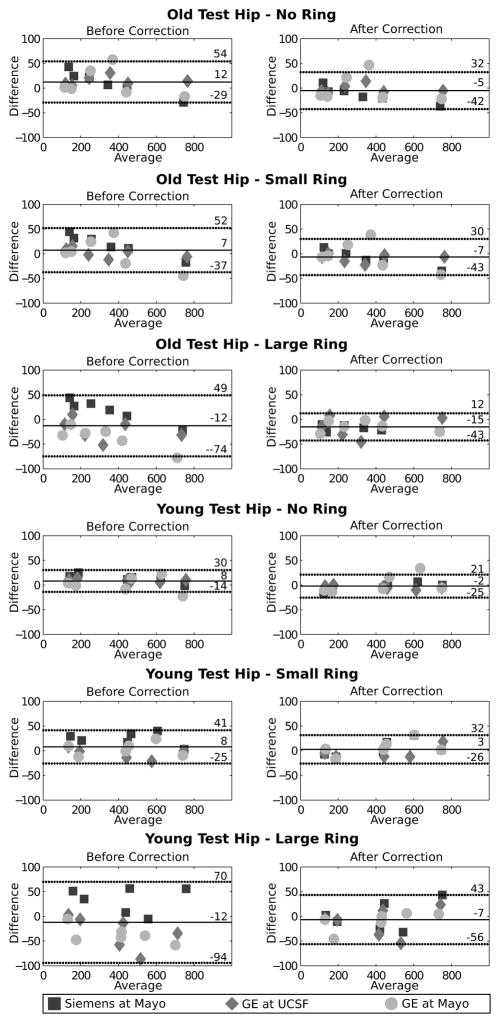
At the test hip, inter-scanner differences of vBMD were significant in all compartments for both old and young femur necks. vBMD were calculated on volumes of 25897 ± 286 voxels (mean ± standard deviation). After correction, differences were reduced considerably, although not significantly (p>0.05). Root mean squares of inter-scanner differences were larger for cortical bone both in femoral neck and greater trochanter, and reduced after correction (figure 6). Larger RMS were measured for the phantom with a large ring for old trochanter and young hip. The Bland-Altman analysis showed that the differences between reference scanner and current scanner where larger for phantom with large girdle, and reduced considerably after correction (figure 7).
Figure 6.
vBMD for old (left) and young (right) test hip before and after inter-scanner correction for the four CT systems. vBMD values for cortical, trabecular and integral neck and trochanter are grouped based on phantom body size. vBMD for the reference scanner, i.e. Siemens at UCSF, are constant before and after correction (white bin). Root mean squares of inter-scanner differences are displayed over each group. Graphs of old and young neck have different scales, because compartments contain different concentrations of HA.
Figure 7.
Bland-Altman analysis of vBMD of test hip before and after correction for the Siemens system at Mayo, and the GE system at UCSF and Mayo against the references scanner, the Siemens system located at UCSF.
Applying inter-scanner corrections to subject BMD
We corrected the subjects’ images using the regression line from down-sampled phantom images (table 4(a)). Standard deviations of vBMD across all the subjects were the same for values from Siemens images, and from GE images before and after correction (table 3(a)). Mean of differences between subject’s BMD from GE and Siemens decreased after correction, but standard deviations remained the same (table 3(b)). Before correction, BMD inter-scanner differences were significantly different for cortical (p<0.001) and trabecular bone (p<0.000001), and became non-significant after correction. Precision decreased after correction for all compartments of the femoral head.
Table 4.
Inter-scanner correction for subjects’ data. (a) Regression line used to correct the subjects’ data and cortical correction coefficient. Phantom images were down-sampled to 2.5 mm to have the same slice thickness as the data (m = slope, b = intercept, Standard Error = standard error of prediction, Volume = volume of the analyzed calibration hip in number of voxels and mm3, R = cortical correction coefficient). (b) Standard deviation (Std. Dev.) of vBMD of all subjects for cortical, trabecular and integral vBMD of the whole femur, calculated from Siemens images and GE images before and after correction. (c) Mean and standard deviation (Std. Dev.), T-test, and precision of differences between subjects’ femoral BMD of GE images from Siemens images, before and after inter-scanner correction.
| Old - No Girdle – Down-sampled | Siemens at UCSF | GE at UCSF |
|---|---|---|
| m | - | 0.998 |
| b | - | −17.126 |
| Standard Error | - | 3.25 |
| Volume (n. of Voxels) | 11354 | 11301 |
|
| ||
| (a) | ||
| Cortical vBMD Mean ± Std. Dev. [mg/cm3] | Trabecular vBMD Mean ± Std. Dev. [mg/cm3] | Integral vBMD Mean ± Std. Dev. [mg/cm3] | |
|---|---|---|---|
| Siemens | 476.16 ± 29.17 | 90.74 ± 30.63 | 244.25 ± 32.92 |
| GE Before Correction | 494.03 ± 31.21 | 105.16 ± 32.92 | 250.63 ± 28.99 |
| GE After Correction | 470.34 ± 30.14 | 86.98 ± 33.28 | 242.18 ± 31.93 |
|
| |||
| (b) | |||
| Cortical vBMD | Trabecular vBMD | Integral vBMD | |||||||
|---|---|---|---|---|---|---|---|---|---|
| Mean ± Std. Dev. [mg/cm3] | T-Test | Precision | Mean ± Std. Dev. [mg/cm3] | T-Test | Precision | Mean ± Std. Dev. [mg/cm3] | T-Test | Precision | |
| Difference Before Correction | 17.87 ± 17.50 | p<0.001 | 3.58 | 14.42 ± 5.96 | p<0.000001 | 12.41 | 6.38 ± 15.76 | p>0.05 | 4.70 |
| Difference After Correction | −5.81 ± 14.35 | p>0.1 | 2.25 | −3.76 ± 6.76 | p>0.01 | 11.03 | −2.06 ± 11.67 | p>0.1 | 3.15 |
|
| |||||||||
| (c) | |||||||||
Discussion
In this study, we evaluated the performance of a novel anthropomorphic cross-calibration phantom for hip vQCT. Several features distinguish this phantom from phantoms currently in use, such as the European Spine and Hip Phantoms, and QA phantoms from Mindways and Image Analysis. In order to better simulate effects on the local beam hardening environment due to variations in body size and pelvic density, the phantom design included bilateral 3D proximal femoral inserts of varying densities, a simulated acetabular and ischeal structure, and the ability to add rings of soft-tissue equivalent to generate variable body sizes. These features allowed us to systematically examine the effect of body size on cortical and trabecular vBMD within scanners, and to examine the interaction of body size and pelvic structure with inter-scanner differences in vBMD. Finally, by studying subjects who were scanned on two different scanners, we were able to examine the ability of phantom-based corrections to adjust for inter-scanner differences in vBMD.
In three of four scanners evaluated, altered body size had similar effects on vBMD values. We observed that intra-scanner measurements of vBMD decreased with increasing phantom body size. For each compartment, vBMD was similar when the phantom was scanned without the soft tissue girdle and with the smaller girdle, and reduced up to 12% when scanned with large girdle. Differences were larger for the cortical compartment in both femoral neck and greater trochanter. Inter-scanner variations followed similar trends: vBMD differences increased for increasing body size, and these differences were larger for the cortical compartments. These findings have important implications when interpreting vBMD measurements in clinical studies involving subjects with a large range of body sizes. Depending on the scanner, comparisons of vBMD in groups having different average body sizes may be confounded by the artifactual effects observed here, and such studies should keep these issues in mind. Intra-scanner differences should be considered when comparing vBMD for the same subject at different body sizes such as before and after bariatric surgery, as in Yu et al. (Yu et al., 2013). Similarly, the effect of body size on inter-scanner differences should be considered in multi-center studies when measuring vBMD, mainly for obese subjects; in longitudinal studies when scanner change occurs; and when comparing data from different studies.
In our phantom study, when corrections derived from the calibration hip were applied to the test hips, inter-scanner variability in vBMD was generally reduced but not eliminated. Root mean square measurements of inter-scanner differences in vBMD values decreased considerably after correction, especially for the cortical compartments and for the young test hip. The remaining differences can be due to a number of causes, including two possible factors: flaws in the mathematical formulation of inter-scanner corrections and lack of correction for partial volume effect. Inter-scanner corrections consisted of linear regression equations derived from the calibration hip; more sophisticated formulations should be investigated to further reduce inter-scanner differences. Partial volume effects could lower vBMD measurements, especially for the thin cortex of the old test neck; the effect was not specifically addressed in this study, but it might require specific corrections for inter-scanner variations in point spread functions, which should be added to inter-scanner and the patient-dependent corrections.
In the in-vivo images, application of inter-scanner corrections reduced femoral vBMD differences appreciably. The mean inter-scanner differences for cortical and trabecular vBMD differences were large (14–18 mg/cm3, p<0.001) and statistically significant before correction. After correction, differences were reduced to less than 2 mg/cm3, becoming non-statistically significant. However, the spread of subject-specific inter-scanner differences, expressed as the inter-scanner precision, was higher than observed for intra-scanner precision in a previous study (Li, Sode, Saeed, & Lang, 2006), although it was reduced by nearly one third by correction (table 3(b)). These findings clearly indicate the presence of remaining subject-specific variability that has to be considered when examining the effect of scanner change QCT vBMD. Thus, while our inter-scanner correction may eliminate systemic vBMD differences, there is still an impact on precision. While increased precision errors hinder the ability to discern vBMD changes in individuals followed on different scanners, they are less likely to hinder clinical trials where the large number of subjects being studied reduces the impact of precision error.
The main limitation of this study relates to the subjects enrolled to evaluate inter-scanner corrections. All 16 women were old and their circumference corresponded to the phantom with no/small girdle. As a consequence, we could not test corrections on subjects with large body size and a larger range of bone densities, which would have provided a more dynamic range for incorporating all of the different phantom settings. However, this flaw can be addressed in future studies that incorporate a larger number of subjects and a wider range of bone densities and body sizes. Another limitation is the lack of correction for partial volume effects in BMD measurements, which complicates inter-scanner differences in vBMD measurements in thin cortical structures. Future phantom studies should include spatial resolution measurements within the scanners in order to correct for inter-scanner differences in point spread function.
In conclusion, in this study we analyzed systematic inter-scanner differences and patient-specific body size influences on vBMD from CT images using a novel anthropomorphic hip phantom. While corrections removed inter-scanner differences, more refinement is needed to investigate and remove patient-specific differences, addressing specifically body size variations, partial volume effect and potentially the presence of marrow fat.
Acknowledgments
This study was funded by NIH/NIAMS 5R01AR060700.
Footnotes
Competing Interests
All authors have no conflict of interest.
References
- Adams JE. Quantitative computed tomography. European Journal of Radiology. 2009;71(3):415–24. doi: 10.1016/j.ejrad.2009.04.074. [DOI] [PubMed] [Google Scholar]
- Birnbaum B, Hindman N, Lee J, Babb J. Multi–Detector Row CT Attenuation Measurements: Assessment of Intra-and Interscanner Variability with an Anthropomorphic Body CT Phantom1. Radiology. 2007;242(1):109–119. doi: 10.1148/radiol.2421052066. [DOI] [PubMed] [Google Scholar]
- Cann CE. Quantitative CT for determination of bone mineral density: a review. Radiology. 1988;166(2):509–22. doi: 10.1148/radiology.166.2.3275985. [DOI] [PubMed] [Google Scholar]
- Carpenter RD, Saeed I, Bonaretti S, Schreck C, Keyak JH, Streeper T, Lang TF. Inter-scanner differences in in vivo QCT measurements of the density and strength of the proximal femur remain after correction with anthropomorphic standardization phantoms. Medical Engineering & Physics. 2014 doi: 10.1016/j.medengphy.2014.06.010. [DOI] [PMC free article] [PubMed] [Google Scholar]
- Genant H, Grampp S, Glüer C, Faulkner KG, Jergas M, Engelke K, Van Kuijk C. Universal standardization of dual energy X-ray absorptiometry: patient and phantom cross calibration results. J Bone MIner Res. 1994;(9):1503–14. doi: 10.1002/jbmr.5650091002. [DOI] [PubMed] [Google Scholar]
- Glüer C, Blake G, Lu Y, Blunt B. Accurate assessment of precision errors: how to measure the reproducibility of bone densitometry techniques. Osteoporosis International. 1995;5(4):262–270. doi: 10.1007/BF01774016. [DOI] [PubMed] [Google Scholar]
- Goodsitt MM. Conversion relations for quantitative CT bone mineral densities measured with solid and liquid calibration standards. Bone and Mineral. 1992;19(2):145–58. doi: 10.1016/0169-6009(92)90922-z. [DOI] [PubMed] [Google Scholar]
- Hanson J. Standardization of Femur BMD. J Bone MIner Res. 1997;12(8):1316–1317. doi: 10.1359/jbmr.1997.12.8.1316. [DOI] [PubMed] [Google Scholar]
- Lang TF. Quantitative Computed Tomography. Radiologic Clinics of NA. 2010;48(3):589–600. doi: 10.1016/j.rcl.2010.03.001. [DOI] [PubMed] [Google Scholar]
- Lang TF, Keyak JH, Heitz MW, Augat P, Lu Y, Mathur A, Genant HK. Volumetric quantitative computed tomography of the proximal femur: precision and relation to bone strength. Bone. 1997;21(1):101–8. doi: 10.1016/s8756-3282(97)00072-0. [DOI] [PubMed] [Google Scholar]
- Levi C, Gray JE, McCullough EC, Hattery RR. The unreliability of CT numbers as absolute values. AJR American Journal of Roentgenology. 1982;139(3):443–7. doi: 10.2214/ajr.139.3.443. [DOI] [PubMed] [Google Scholar]
- Li W, Sode M, Saeed I, Lang T. Automated registration of hip and spine for longitudinal QCT studies: integration with 3D densitometric and structural analysis. Bone. 2006;38(2):273–9. doi: 10.1016/j.bone.2005.08.014. [DOI] [PMC free article] [PubMed] [Google Scholar]
- Ourselin S, Roche A, Prima S, Ayache N. Block Matching : A General Framework to Improve Robustness of Rigid Registration of Medical Images. In: DiGioia AM, Delp S, editors. Third International Conference on Medical Robotics, Imaging and Computer Assisted Surgery (MICCAI 2000) 2004. pp. 557–566. Lecture Notes in Computer Science. [Google Scholar]
- Suzuki S, Yamamuro T, Okumura H, Yamamoto I. Quantitative computed tomography: comparative study using different scanners with two calibration phantoms. The British Journal of Radiology. 1991;64(767):1001–6. doi: 10.1259/0007-1285-64-767-1001. [DOI] [PubMed] [Google Scholar]
- Yu EW, Bouxsein M, Roy AE, Baldwin C, Cange A, Neer RM, Finkelstein JS. Bone loss after bariatric surgery: Discordant results between DXA and QCT bone density. Journal of Bone and Mineral Research : The Official Journal of the American Society for Bone and Mineral Research. 2013;29(3):542–550. doi: 10.1002/jbmr.2063. [DOI] [PMC free article] [PubMed] [Google Scholar]
- Yu EW, Thomas BJ, Brown JK, Finkelstein JS. Simulated increases in body fat and errors in bone mineral density measurements by DXA and QCT. Journal of Bone and Mineral Research : The Official Journal of the American Society for Bone and Mineral Research. 2012;27(1):119–24. doi: 10.1002/jbmr.506. [DOI] [PMC free article] [PubMed] [Google Scholar]
- Yushkevich Pa, Piven J, Hazlett HC, Smith RG, Ho S, Gee JC, Gerig G. User-guided 3D active contour segmentation of anatomical structures: significantly improved efficiency and reliability. NeuroImage. 2006;31(3):1116–28. doi: 10.1016/j.neuroimage.2006.01.015. [DOI] [PubMed] [Google Scholar]


