Abstract
Changes in the viscoelastic parameters of soft biological tissues often correlate with progression of disease, trauma or injury, and response to treatment. Identifying the most appropriate viscoelastic model, then estimating and monitoring the corresponding parameters of that model can improve insight into the underlying tissue structural changes. MR Elastography (MRE) provides a quantitative method of measuring tissue viscoelasticity. In a previous study of the authors [Mag. Res. Med. 70:479–89;2013. doi: 10.1002/mrm.24495], a silicone-based phantom material was examined over the frequency range of 200 Hz to 7.75 kHz using MRE, an unprecedented bandwidth at that time. Six viscoelastic models including four integer order models and two fractional order models, were fit to the wideband viscoelastic data (measured storage and loss moduli as a function of frequency). The “fractional Voigt” model (spring and springpot in parallel) exhibited the best fit and was even able to fit the entire frequency band well when it was identified based only on a small portion of the band. This paper is an extension of that study with a wider frequency range from 500 Hz to 16 kHz. Furthermore, more fractional order viscoelastic models are added to the comparison pool. It is found that added complexity of the viscoelastic model provides only marginal improvement over the “fractional Voigt” model. And, again, the fractional order models show significant improvement over integer order viscoelastic models that have as many or more fitting parameters.
Keywords: Magnetic Resonance Elastography, Viscoelasticity, Fractional model, Multiscale
Introduction
Magnetic Resonance Elastography (MRE) is a method that uses a conventional MR imaging scanner to acquire images of mechanical wave propagation in viscoelastic material, such as biological organs or engineered tissue, under external cyclic motion. In MRE, phase contrast images can be obtained by applying synchronized motion encoding gradients (MEGs) [2, 3]. Wave propagation behavior in a medium relates to the medium’s viscoelastic properties, which in turn may be a biomarker for certain diseases. Hence, as a non-invasive quantitative measurement method of viscoelasticity, MRE is studied for diagnosis of various diseases [4–8] and noninvasive monitoring of mechanical property changes of differentiating engineered tissue [9].
The viscoelastic properties of biological tissue not only affect its motion behavior caused by external dynamic loads, but might also reflect its intrinsic cell structure arrangement. For instance, when considering a fractional Springpot viscoelastic model, the two viscoelastic properties μα and α reflect the connectivity and alignment of the structural building blocks in the organ, respectively. These two parameters can change as a result of pathology, which reveals changes in the structure of the cell organization [10, 11]. Thus, identifying the most suitable model and monitoring the viscoelastic property changes could be helpful in diagnosing and monitoring specific attributes of the biological tissue structure. This, in turn, may become a more sensitive and specific biomarker of disease progression and response to therapy. Combining MRE measurements over a wide frequency range can generate curves of the real and imaginary part of the complex shear modulus (storage and loss moduli) that may better capture multiscale tissue behavior as compared to measurements over narrower bands or single frequencies. Viscoelastic model types with fewer parameters that still accurately capture the dynamic viscoelasticity behavior over a wide dynamic (frequency) range are more valuable than more complex models that require more fitting parameters with greater uncertainty and difficulty in interpretation and linking to intrinsic multiscale tissue structure.
Other groups have conducted multi-frequency MRE studies on organ viscoelasticity. A study on brain viscoelasticity was done from 25 Hz to 62.5 Hz with band resolution of 12.5 Hz. Four models – Voigt, Maxwell, Zener and Springpot – were utilized for fitting; the Springpot model was the best fit [10]. A similar study on liver over the frequency range of 25 Hz to 600 Hz was done by the same group [11, 12]. In these studies, it was also shown that a fractional order model was more accurate than integer order models.
In the present study, MRE was conducted over a wider frequency range, from 500 Hz to 16 kHz, in three experiments of 500 Hz to 3 kHz, 1 kHz to 7.5 kHz, and 5 kHz to 16 kHz. Because the wavelength is inversely proportional to the frequency under harmonic motion where low frequency means long wavelength, and waves attenuate rapidly at high frequency, the boundaries of the frequency range in each experiment are decided by the criteria that a minimum of one full wave should be observed in the sample.
Material and Method
Sample Preparation
Similar to our previous study [13], all samples were made with two-part Smooth-On, Inc. Ecoflex® 0010 Platinum Cure Silicone Rubber. Different from the previous study, Silicone Thinner® Silicone Rubber Thinning Additive is added to this combination in this study in order to better release air bubble as well as elongate the sample curing for enough preparation time. A mixture of part A, part B and thinner in ratio of 1:1:0.1 by volume was prepared in a big container before distributing to the three experiment test tubes. The mixture was put in a vacuum chamber (5305-1212, Thermo Scientific-Nalgene, Rochester, NY) for 15 minutes before distribution in order to speed up the air bubble escape.
Because wavelength is inversely proportional to frequency under harmonic motion, three sample tubes in different dimensions were selected in this study for low, mid and high frequency experiments. All of the tubes have both ends open to minimize the effect from compression waves. An inner diameter (ID) = ϕ30 mm, outer diameter (OD) = ϕ34 mm, length L=35 mm Delrin® tube with both ends open was selected for low frequency experiments from 500 Hz to 3 kHz. In order to avoid the mixture spilling from the tube bottom, the tube bottom was sealed with a piece of laboratory parafilm (BEMIS®, WI, USA) and then capped tightly with a flat cylinder before pouring the mixture into the tube. The mixture was poured to the top of the tube. This sample is prepared while the mixture is still in liquid state and doesn’t capture too much air during the pouring. An ID = ϕ8 mm, OD = ϕ9.5 mm and an ID = ϕ4 mm, OD = ϕ4.9 mm Borosilicate Glass NUM tubes were selected for mid frequency experiments from 1 kHz to 7.5 kHz and high frequency experiments from 5 kHz to 16 kHz, respectively. The mid frequency range and high frequency range glass tubes had the bottom cut to the final length of 70 and 75 mm, respectively. Similar to the Delrin® tube, the bottom of the glass tubes were sealed with a piece of parafilm and a lump of clay to avoid spilling. The same mixture was slowly injected into and filled to the top of the two glass tubes with a 5 ml syringe and PTFE dispensing needle (gauge 16, 1 ½″ long, McMaster-CARR®) to avoid introducing air bubbles into sample.
The curing time for Ecoflex given by the manufacturer is 4 hours at room temperature. In order to ensure it is fully cured and reaches a stable state, the three samples were placed vertically for one week. The sealing parafilm and cap/clay were removed before the experiment.
MRE Experiment
MRE is a method based on the principle that when adding an oscillating magnetic gradient to a present magnetic field gradient, phase shift caused by the motion of nuclear spin accumulates in different amounts Φ in the NMR signal[1]. When the sample is under a continuous oscillatory motion at the same time with the gradient oscillation, the phase accumulation Φ for a given point on the image over a time Δt has a relation with the oscillating gradient and the displacement at that point as below:
| (1) |
where γ is the gyromagnetic ratio of the nucleus, which is 42.576 MHz/T for hydrogen nuclei. G(t) is the motion encoding gradient (MEG) in the time domain and u(t) is the displacement vector in the time domain.
Assuming both MEG and mechanical motion are mono-frequency sinusoids of the same frequency, G(t) = G0sin(ωt + θg) and u(t) = U0sin(ωt + θn), the phase accumulation Φ can be expressed as:
| (2) |
where T = 2π/ω is the period of the mechanical vibration. N is the number of MEG cycles, and θ = θg − θn is the relative phase between the mechanical motion and the MEG [1, 5, 14].
In order to obtain the harmonic component of the vibration motion, multiple acoustic wave images (typically four or eight) are obtained from multiple scans by adjusting the phase offset θ regularly spaced within a vibration cycle. By extracting the corresponding information from the frequency domain by doing a Fast Fourier Transform (FFT) over these phase contrast images, a complex displacement field can thus be reconstructed including the information of the amplitude and the phase of the harmonic displacement in the spatial domain[3].
The MRE experiments in this study were completed in two different MRI scanners and three different RF coils in order to cover all three frequency ranges efficiently. The low frequency experiment was conducted in a 9.4 Tesla Agilent (310/ASR, Santa Clara, CA) horizontal bore animal MR scanner with self-shielded gradient coils (maximum strength 1000 mTm-1). The low frequency sample in an OD=ϕ34 mm tube was scanned in a ϕ39 mm birdcage quadrature radiofrequency (RF) coil. Mid and high frequency experiments were done in a 11.74 Tesla Bruker (Billerica, MA) 56-mm vertical bore MR scanner with a 19 mm gradient coils (maximum strength 2000 mTm-1). The mid frequency sample in an OD=ϕ9.5 mm tube was scanned in a ϕ10 mm saddle Bruker RF coil for the frequency range from 1 kHz to 7.5 kHz. The high frequency sample in an OD=ϕ4.95 mm tube was scanned in a ϕ5 mm Bruker saddle coil for frequency range from 5 kHz to 16 kHz.
In each of the three experiments, the sample container was driven by a piezoelectric actuator. The MRE setup for mid and high frequency experiments is the same as our previous study [13]. A piezoceramic stack actuator (6.5×.5×18 mm, Thor Labs. Inc) providing 11.6 μm displacement amplitude at 100 Volts was selected for these two experiments. The setup for the low frequency experiment in the 9.4 Tesla Agilent horizontal bore system is shown in Figure 1. A preloaded piezo-actuator (P-840.1) from Physik Instrumente (PI) (GmbH & Co. KG, Germany) is selected for this low frequency experiment. The actuator is mounted on a plastic cradle, connected to the test tube via a long plastic rod and a tube holder. This actuator can provide 30 μm displacement at 100 volts. The peak to peak voltage applied to the piezoelectric actuators was 32 Volts for all experiments. A DC supply is added into the circuit in order to give a positive bias to the voltage and avoid negative voltage to the piezoelectric actuator. The actuator shakes the entire test tube transversely. Because the Ecoflex clings to the test tube wall persistently after it is cured, the tube’s transversal motion generates shear waves on the boundary of the sample, which then circularly propagate towards to the center in a focusing fashion.
Figure 1.
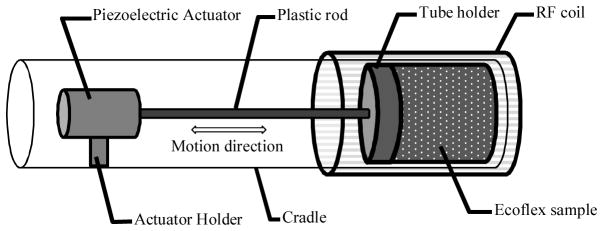
Setup for MRE experiment in 9.4 Tesla Agilent horizontal bore system. The piezoelectric actuator is mounted on the plastic cradle. In order to avoid electromagnetic interference between the charged piezoelectric actuator and RF coil, the actuator is located far away from the RF coil. A Delrin® rod connects the actuator and a tube holder which mount tightly on the sample container. An inertial ground (not shown) is connected to the left side of the actuator.
A gradient echo based sample interval modulation for the simultaneous acquisition (SLIM) MRE pulse sequence [15], which can obtain motion in all three directions in one scan, was utilized in all experiments. Due to the low SNR and wave attenuation at the upper boundary of each frequency range in all three experiments, parameters including repetition time (TR), flip angle (FA), gradient power on slice direction and the MEG duration were adjusted for each frequency accordingly. Table 1 gives the detailed values for these parameters. The image acquisition matrix was 128×128 for all scans. The actuator was triggered 20 milliseconds before the MEG pulse starts in order to have the sample reach steady states. The MEG duration was kept to be around 2 milliseconds with an integer MEG number for most of the scans to keep the echo time (TE) short enough for a high SNR free induction decay (FID) signal. For the ultra-high frequency range, 13 kHz to 16 kHz, the MEG duration was increased approximately to 3 milliseconds with an integer MEG number in order to achieve more phase accumulations.
Table 1.
Main MRE scan parameters for all experiments
| Frequency (kHz) | Scanner | Sample Dia. (mm) | Coil Dia. (mm) | FOV (mm) | TR (ms) | TE (ms) (w/o MRE duration) | FA (°) | Gradient Power (Gauss/cm) | MEG Duration |
|---|---|---|---|---|---|---|---|---|---|
| 0.5 ~1.5 | 9.4 T | ϕ30 | 39 | 36×36 | 100 | 2.56 | 20 | 20 | ~ 2ms with integer MEG number |
| 1.75 ~3 | 9.4 T | ϕ30 | 39 | 36×36 | 100 | 2.56 | 25 | 20 | ~ 2ms with integer MEG number |
| 1 ~ 5 | 11.74 T | ϕ8 | 10 | 10×10 | 100 | 3.95 | 30 | 75 | ~ 2ms with integer MEG number |
| 5.5 ~ 7.5 | 11.74 T | ϕ8 | 10 | 10×10 | 300 | 3.95 | 30 | 90 | ~ 3ms with integer MEG number |
| 5 ~ 12 | 11.74 T | ϕ4 | 5 | 6.4×6.4 | 500 | 2.94 | 50 | 90 | ~ 2ms with integer MEG number |
| 13 ~ 16 | 11.74 T | ϕ4 | 5 | 6.4×6.4 | 600 | 2.94 | 50 | 90 | ~ 3ms with integer MEG number |
Complex Shear Modulus Estimation
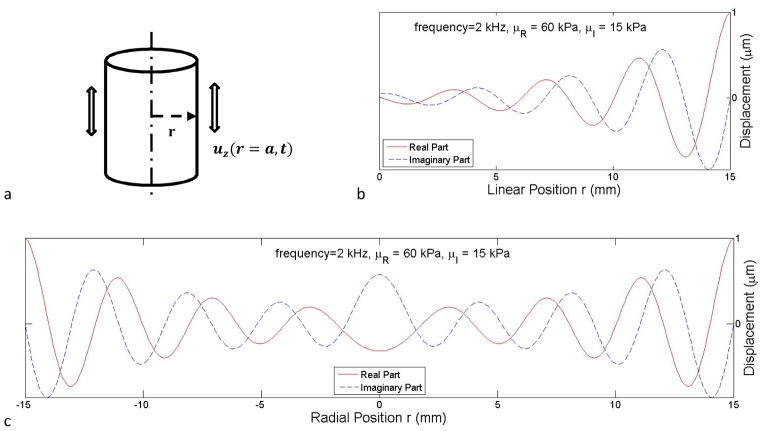
The geometrical focusing MRE experiment method [16] was utilized in this study. In this method, the cylinder under axisymmetric steady state vertical harmonic motion, u = uza exp(jωt), shown in Figure 2a, generates shear waves from the wall of the cylinder. These shear waves propagate towards the center of the cylinder (cylindrical wave propagation) with less attenuation than planar wave propagation due to the geometric focusing phenomenon. For a homogenous and isotropic viscoelastic medium, the displacement along the radial position and far enough away from the free surface at the top and bottom can be written as below:
| (3) |
where ,J0(z) is the 0th order Bessel function of the first kind, ρ is the medium density, and μR and μI are the real and imaginary parts of the shear modulus representing the storage and loss property of the medium, respectively. The advantage of this method is that, the shear wave focuses at the center of the sample, and compensates for the attenuation [17]. Figure 2b and c show the real and imaginary parts of the displacement at phase 0 for a propagating planar wave and a cylindrically propagating wave for a medium with density ρ = 1,000 kg/m3, μR = 60 kPa, μI = 15 kPa and radius of 15 mm under a 2 kHz harmonic vibration with amplitude of 1 μm. It can be observed that the shear wave amplitude may even get amplified in the center of the cylinder.
Figure 2.
a: Diagram of the cylinder used in geometrical focusing MRE method. A harmonic vibration is applied axisymmetrically on the cylinder wall along the vertical direction indicated by the arrows. b: The real and imaginary part of the displacement of planar wave at 2 kHz for a medium with μR = 60 kPa and μI = 15 kPa. c: the real and imaginary part of the displacement along the radial direction of cylindrically propagating wave generated by geometrical focusing method
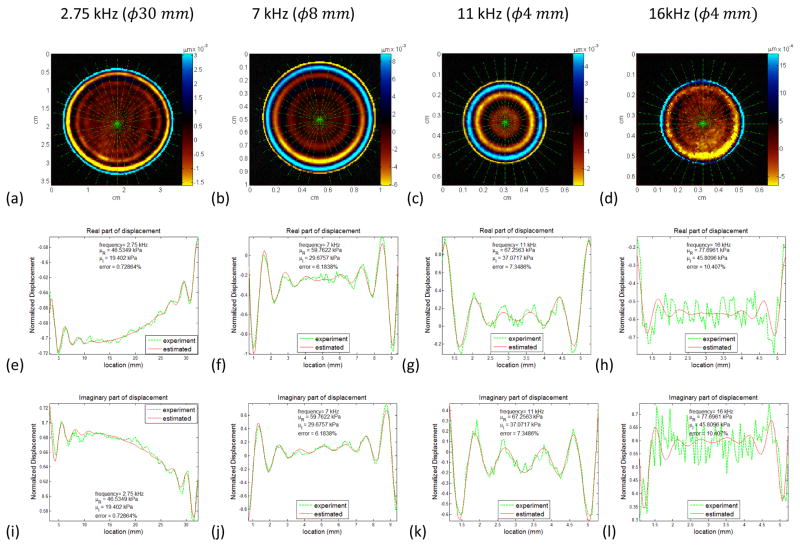
In order to estimate the complex shear modulus of Ecoflex, 18 line profiles with 10° separation passing through the center of the complex MRE wave image encoded in the in-plane direction were taken as shown in Figure 3a, b, c and d for frequencies 2.75 kHz, 7 kHz, 11 Hz and 16 kHz, respectively. Each line profile was fit to the closed form solution, as given in equation (3), in order to estimate the real and imaginary part of the complex shear moduli for that particular frequency. The curve fitting was done with a custom written Matlab code utilizing the Global Optimization toolbox. Compared to the previous study, a quadratic offset y = ax2 + bx + c was used instead of a DC offset y = c in the closed form solution in order to compensate the bias originated from compression waves and uneven vibration due to the unavoidable misalignment of the piezoelectric actuator and the test tube. Figure 3e to Figure 3l show the fitted result of one of the 18 line profiles from the four frequency wave images in Figure 3a, b, c and d, correspondingly. In these fitted line profile figures, the Y axis indicates the normalized displacement based on the maximum magnitude of the complex displacement over the diameter. A normalized error for each spatial point was calculated by dividing the difference between the experimental line profile and the estimated line profile from the closed form solution by the maximum absolute amplitude of the experimental line profile.
Figure 3.
Wave image and line profile with curve fitting for real and imaginary part of the displacement result for different frequencies in different sample containers. A quadratic offset strategy was utilized for fitting the closed form solution to experiment line profiles in order to compensate the uneven vibration caused by unavoidable misalignment of the actuator and the test tube. (a, e, i), (b, f, j), (c, g, k), (d, h, l) are results for 2.75 kHz, 7kHz, 11 kHz and 16 kHz from low, mid and high frequency experiments, respectively. The estimated result of the real and the imaginary part of the shear moduli and the error percentage for each fitting are indicated in the fitting plots. The Y axis for (e) to (l) are normalized displacement based on the maximum magnitude of the complex displacement over the diameter.
| (4a) |
| (4b) |
Indentation Experiment for static shear modulus
The static shear modulus μ0 was measured by the indentation experiment. The experiment was done with a force measurement (Model DS2-1, IMADA, INC., IL, USA) and a Quick-Mount Linear Stage (460A series, Newport, Corporation, USA) on the ϕ30 mm low frequency experiment sample. A rigid conical indenter was utilized. In this case, the total force F applied is a function of sample Young’s modulus E, the indentation depth and the geometry of the indenter as below:
| (5) |
where is the indentation depth, ε = a tan θ is the depth of the contact region, a is the contact radius, and θ is the angle between the plane and the side surface of the cone [18]. The tip angle of the indenter is 85°, thus θ = 47.5° in this experiment.
Viscoelastic Model parameter Estimation
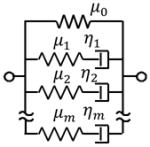
Because of its characteristics of both elasticity and viscosity, viscoelastic models are constructed as a combination of the basic rheological elements: linear elastic spring(s) and linear viscous dashpot(s). The Kelvin-Voigt Solid and Maxwell-Wiechert Fluid models are the two simplest combinations of these elements in parallel and in series, respectively. A generalized model can be constructed by putting a collection of Voigt or Maxwell units in series, plus an isolated spring or dashpot. The Generalized Maxwell model is the most widely used linear integer order viscoelastic model. Besides using a collection of a same type viscoelastic unit in a model, composite Voigt and/or Maxwell units and basic element(s) of spring and/or dashpot reproduce more realistic viscoelastic behavior. The Zener model (one version of Standard Linear Solid composite model) is one of these various composite models. [19, 20]. The schematic and corresponding equation of shear modulus in the frequency domain G*(ω) of these four models are given in Table 2. Here, μ0 in Voigt, Zener and Generalized Maxwell models is the static shear modulus measured in the above section Indentation Experiment for static shear modulus.
Table 2.
Schematic and shear modulus G*(ω) of Four integer order viscoelastic models
| Viscoelastic model | Schematic | G*(ω) | |
|---|---|---|---|
| Voigt |

|
μ0 + jωη | |
| Maxwell |
|
|
|
| Generalized Maxwell |
|
|
|
| Zener |

|
|
However, integer order viscoelastic models cannot perfectly represent some common viscoelastic materials such as clay and biological tissues. Fractional models were introduced because of their success in the description of complex dynamics [21, 22]. A widely utilized basic fractional model is the Springpot model (Figure 4a), which can be derived from a ladder network model of hierarchical arrangements of springs and dashpots. By assuming E1 = E2 = E3 = ··· = E, η1 = η2 = η3 = ··· = η and μα = E(η/E)α, where 0 < α < 1 is the fractional derivative order, it is usually simplified as a symbol shown in Figure 4b with two parameters μα and α [21–23]. Adding a spring element in parallel to the Springpot model forms the Fractional Voigt model. When the fractional derivative order α equals to 1, this model becomes a Voigt model. The stiffness of the added spring is equivalent to the measurable static stiffness μ0, and thus won’t increase the unknown parameter number. Three more fractional order models were considered as well in this study, including two fractional versions of the Maxwell model, replacing the spring or dash pot element with the Springpot unit, respectively, and a 3-parameter fractional Zener model which adds a spring in parallel to the fractional Maxwell-Spring model. The schematic and equation of shear modulus in the frequency domain G*(ω) of these five fractional order models are shown in Table 3. Here, μ0 in all these viscoelastic models is the static shear modulus measured in the above section Indentation Experiment for static shear modulus.
Figure 4.
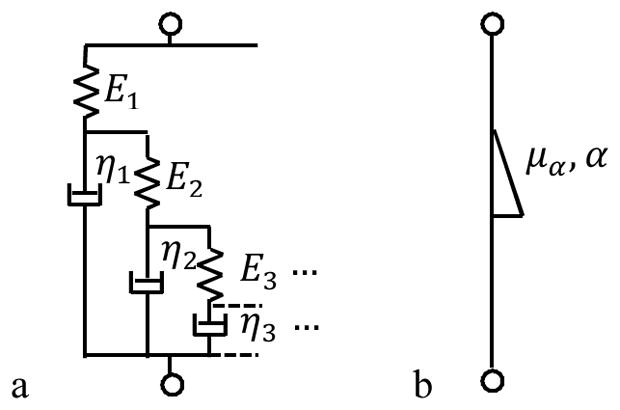
a: Schematic of the commonly utilized fractional Springpot model b: simplified symbol of Springpot Model
Table 3.
Schematic and shear modulus G*(ω) of five fractional viscoelastic models
| Viscoelastic model | Schematic | G*(ω) |
|---|---|---|
| Springpot |
|
μα(jω)α, 0 < α ≤ 1 |
| Fractional Voigt |

|
μ0 + μα(jω)α, 0 < α ≤ 1 |
| Fractional Maxwell-spring |
|
, 0 < α ≤ 1 |
| Fractional Maxwell-dashpot |
|
, 0 < α ≤ 1 |
| 3-parameter fractional Zener |

|
, 0 < α ≤ 1 |
In order to estimate the model parameters, as in the previous study [13], the complex shear modulus equation in frequency domain G*(ω) of these viscoelastic models were fit to the median of the estimated complex shear modulus over the frequency range from 500 Hz to 16 kHz by minimizing the root mean square error (RMSE) defined in equation (6). A mean absolute percentage error (MAPE) defined as equation (7) was utilized for comparison between models. The curve fitting was done in a customized Matlab code using the global optimization toolbox.
| (6) |
| (7) |
where N is the number of frequency points.
Model Selection Criterion
The number of unknown parameter(s) varies in different viscoelastic models. In order to fairly compare different models, a model selection criterion besides the mean absolute percentage error is necessary. Akaike Information Criterion (AIC) and Bayesian model selection are two popular criteria for model selection in various applications [24, 25]. We choose AIC defined as equation (8a) for model scoring in this paper.
| (8a) |
| (8b) |
Here, N is the number of frequency points, RSS defined in equation (8b) is the residual sum of squares, and k is the number of parameters in the model.
Results
Indentation Experiment for static shear modulus
Figure 5 shows the indentation experiment curve. The estimation result of static Young’s Modulus E is 36.89 kPa. Poisson’s ratio is assumed to be 0.4999998 for viscoelastic material in this study, which results an estimated static shear modulus μ0 = 12.3 kPa.
Figure 5.
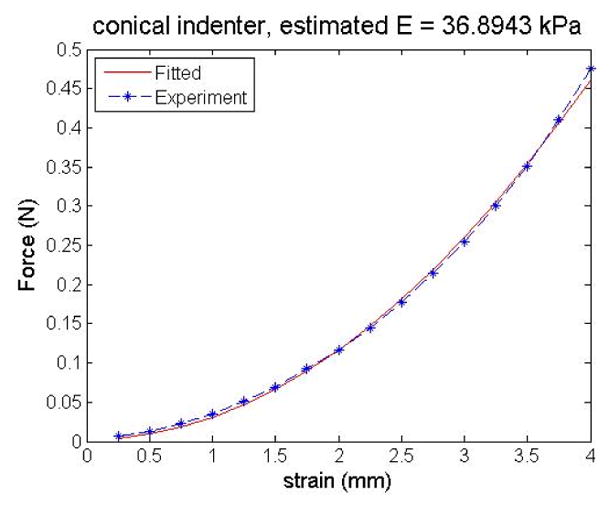
Indentation result for static Young’s Modulus E with a rigid conical indentor.
Shear Modulus Estimations
The box plot result of the real and imaginary part of the shear modulus over the entire frequency range is given in Figure 6. The data of each box comes from the 18 shear modulus estimations corresponding to 18 line profiles. The result from the three experiments are shown in the same plot and distinguished with different colors. For the three experiments, there were overlaps between the low and mid, and mid and high frequency range. The overlapped ranges are indicated with two rectangles in the plot.
Figure 6.
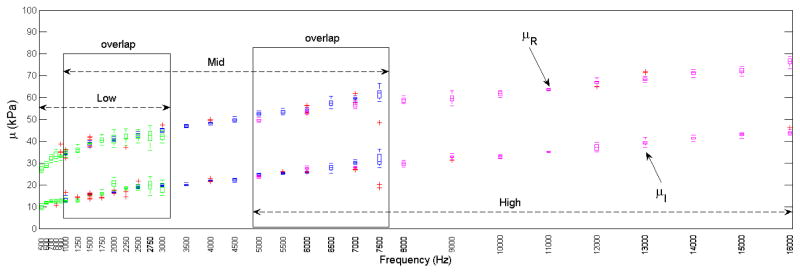
Box plot of the real and the imaginary part of the shear modulus estimations. The overlapped frequency range from low and mid, and mid and high frequency ranges are indicated by the two rectangular frames labeled ‘overlap’. 32 frequency points (0.5 to 1 kHz with 100 Hz interval, 1 to 3 kHz with 250 Hz interval, 3 to 8 kHz with 500 Hz interval, and 8 to 16 kHz with 1 kHz interval) are listed on the frequency axis. Data from the three experiments of low (ϕ30 mm, 0.5 – 3 kHz), mid (ϕ8 mm, 1 – 7.5 kHz) and high (ϕ4 mm, 5–16 kHz) frequency are grouped with different colors. The lines in the boxes mark the median value estimated from all 18 line profiles of the corresponding frequency scan. The whiskers extend to the most extreme data points, which are plotted as red markers (+)
Viscoelastic Model Parameter Estimations
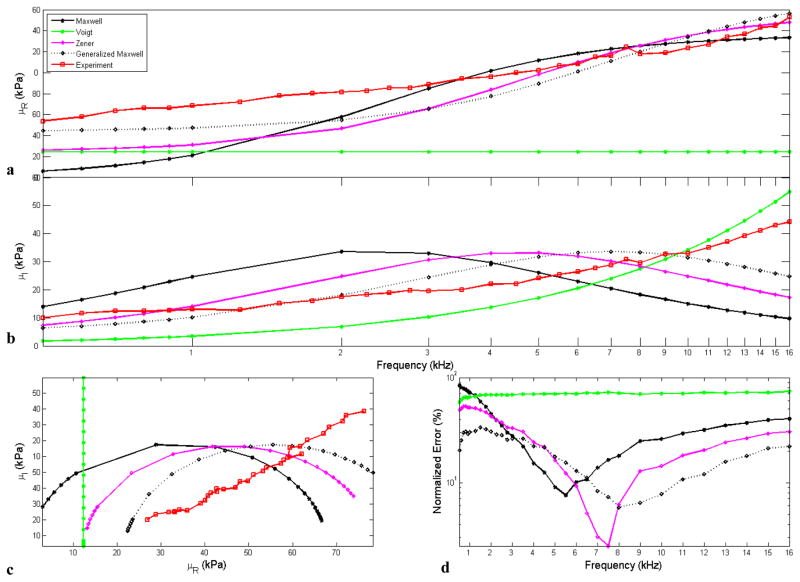
Four integer order viscoelastic models and five fractional order models were compared in this study. The Voigt and the Maxwell models are the two basic viscoelastic models combining the spring and dashpot elements in parallel and series, respectively. Although it has been observed that these simple two-parameter models do not successfully describe the shear dynamic behavior in many materials [26], these two models were included in the study for reference. Compared to these two models, the three-parameter Zener model, which is a parallel combination of a Maxwell unit and a spring, has more flexibility in representing viscoelastic behavior. The Generalized Maxwell model is the most widely utilized integer order viscoelastic model. Adding more parameters into the equation allows it to adapt to various viscoelastic material behavior for a wide range of frequencies. A 5-parameter Generalized Maxwell model, which includes two branches of Maxwell units, was examined in this study. The parameter μ0 in Voigt, Zener, and Generalized Maxwell is the static shear modulus measured in the indentation experiment. The real and the imaginary part of the complex shear moduli of these four integer models and experimental estimation are shown in Figure 7a, b. The estimates of the parameters as well as error percentages and AIC score for each model are given in Table 4.
Figure 7.
The complex shear modulus estimation for four integer viscoelastic models with the parameters estimated via minimization of mean square error between experimental data and the predicted model over the entire frequency range from 500 Hz to 16 kHz. (a) real part of shear modulus μR versus frequency. (b) imaginary part of shear modulus μI versus frequency. (c) μI versus μR plot, where the slope of the plot represents the viscoelastic loss factor. (d) normalized root mean square error between the estimated experimental shear modulus and the shear modulus from fitted viscoelastic models.
Table 4.
Estimates of the viscoelastic parameters by fitting the shear modulus equation G*(ω) for the four integer models to the median of the estimated experimental complex shear modulus over the frequency range (500 Hz to 16 kHz)
| Model | 1st Parameter | 2nd Parameter | 3rd Parameter | 4th Parameter | Error (%) | AIC |
|---|---|---|---|---|---|---|
| Voigt | η = 0.5455 (Pa · s) | / | / | / | 68.76 | 683.3 |
| Maxwell | μ = 68.06 (kPa) | η = 4.645 (Pa · s) | / | / | 38.26 | 642 |
| Generalized Maxwell | μ1 = 78.5 (kPa) | μ2 = 30.17 (kPa) | η1 = 0.72 (Pa · s) | η2 = 9.4 (Pa · s) | 7.08 | 538 |
| Zener | μ1 = 66.47 (kPa) | η1 = 2.36 (Pa · s) | / | / | 29.6 | 624.8 |
A plot of μI versus μR of each viscoelastic model and the experimental values are shown in Figure 7c. The slope of this plot corresponds to the loss factor in viscoelasticity. It is observed that none of these four integer models offer a good match with the experimental measurement. A normalized root mean square error between the shear modulus G*(ω) of each model and experimental result over the frequency range is given in Figure 7d.
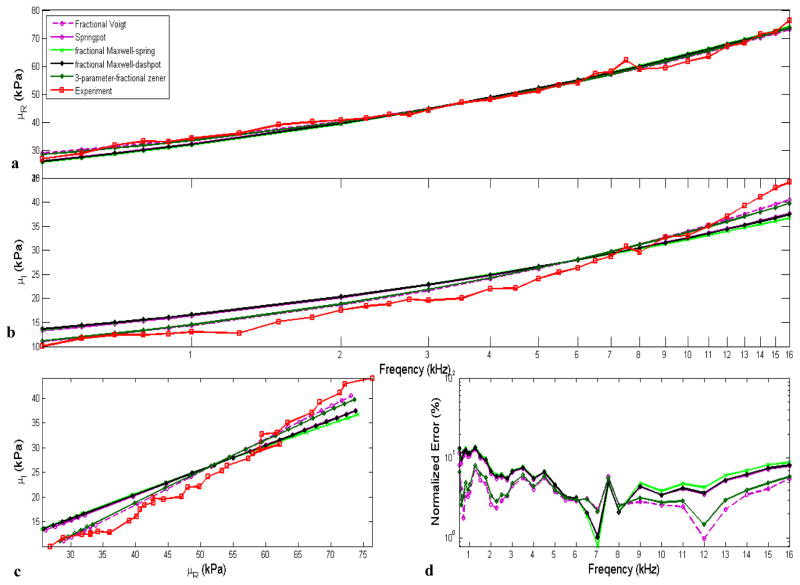
The previous study has shown that the basic fractional viscoelastic Springpot outperforms the four integer models above. And it also revealed that adding a spring in parallel to the Springpot model gives it even more flexibility and accuracy. In order to examine further how well the fractional models perform, three more fractional models were compared in this study. Estimated complex shear moduli over the frequency range for these five fractional models and experimental estimations are shown in Figure 8a and b, and the estimated viscoelastic parameters are given in Table 5. The μI versus μR plot of each model, and the experimental values and the plot of normalized error are shown Figure 8c and d as well. It can be observed that all of the five fractional order models have a better performance than integer order models.
Figure 8.
The complex shear modulus estimation for five fractional viscoelastic models with the parameters estimated via minimization of square error between experimental data and predicted model over the entire frequency range from 500 Hz to 16 kHz. (a) real part of shear modulus μR versus frequency. (b) imaginary part of shear modulus μI versus frequency. (c) μI versus μR, where the slope of the plot represents the viscoelastic loss factor. (d) normalized root mean square error between the estimated experimental shear modulus and the shear modulus from fitted viscoelastic models.
Table 5.
Estimates of the viscoelastic model parameters by fitting the shear modulus equation G*(ω) for the five fractional models with the median of the estimated experimental complex shear modulus over frequency range (500 Hz to 16 kHz)
| Model | 1st Parameter (Pa · sα) | 2nd Parameter | 3rd Parameter | Error (%) | AIC |
|---|---|---|---|---|---|
| Springpot | μα = 2626 | α = 0.2996 | / | 6.51 | 528.9 |
| fractional Voigt | μα = 982 | α = 0.374 | / | 3.78 | 499.2 |
| fractional Maxwell-spring | μα = 2300 | α = 0.3177 | μ1 = 106 Pa | 7.10 | 537 |
| fraction Maxwell-dashpot | μα = 2684 | α = 0.2977 | η = 500(Pa · s) | 6.81 | 536.8 |
| 3-parameter fractional Zener | μα = 839 | α = 0. 393 | μ1 = 106 Pa | 4.12 | 506.3 |
Discussion
Elastography is becoming more recognized and accepted as a means to quantitatively and non-invasively assess biological tissue in vivo. Identifying an appropriate tissue viscoelastic model, and estimating and monitoring its viscoelastic parameters could be a new biomarker and a new approach for diagnosing and monitoring certain pathologies and their response to treatment. Studies have shown that when assuming a Springpot model for brain tissue, the two parameters μα and α represent the connectivity and alignment of the structural building blocks in the tissue, respectively [10]. It was shown that specific aspects of brain viscoelasticity were altered in experimental autoimmune encephalomyelitis [27] and after treatment in normal pressure hydrocephalus [28]. Thus, carefully selecting an appropriate model for the biological organ became more important. Many studies has shown fractional viscoelastic models capture the dynamic viscoelasticity of a biological tissue more precisely than integer order models [10, 12, 29]. From the results in Figure 7, Figure 8, Table 4, and Table 5, it can also be clearly observed that even the two-parameter Springpot model outperforms the five-parameter Generalized Maxwell model. Thus, as an extension of the previous study, this article not only expanded the experimental frequency range, but also focused more on the performance of various fractional models.
Considering Figure 8 and Table 5, although the two versions of fractional Maxwell models have one more fitting parameter than the Springpot, the three of them have similar error percentages. Also, the additional parameter, μ1 or η, reached the predefined upper boundary in optimization. More curve fitting was done with increasing these upper limits, and it was found that the shear modulus curves of these two models approach that of the Springpot when the additional parameters approach infinity. This can also be proven by rewriting the shear modulus equations of these two models as below.
| (9) |
| (10) |
From the observation above, the two versions of fractional Maxwell models, fractional Maxwell spring equation (9) and fractional Maxwell dashpot equation (10), converge to the Springpot model when optimized, and so the 3-parameter fractional Zener model will be equivalent to the fractional Voigt model.
Furthermore, as in the previous study, the fractional Voigt model has a better convergence and lower AIC score than the Springpot model without increasing the number of unknown parameters given that μ0 is known. The following conclusions can be made: 1) the Springpot model outperformed most other viscoelastic models because of high accuracy and less optimization parameters needed; 2) however, if the sample’s static shear modulus is measurable, the fractional Voigt model has the advantage of more flexibility and even better accuracy than the Springpot; 3) Increasing the complexity of a fractional model does not necessarily yield a better model estimation due to increased complexity of the optimization and the noise in the experimental data.
This study was done on a tissue-like material. When expanding this method to clinical application, the slower slew rate of the gradient coil in high field human MR scanners limits the upper limit of frequency range. In our previous study, identification of a viscoelastic model in a limited frequency range from 200 Hz to 900 Hz was discussed. It was concluded that, although the error percentage became higher, the fractional model obtained based on a low frequency range was still able to predict behavior at high frequencies (up to 7.75 kHz which is the highest frequency discussed in that paper) accurately. Additionally, real tissue would have more complicated behavior than tissue-like material. As seen from the result in Figure 7, integer order models cannot even capture the curve of a tissue-like material. Therefore, it is expected that fractional order models will continue to outperform integer order models in fitting real tissue.
Studies from other groups have utilized the Springpot model for clinical application on brain and liver [10, 11, 27]. From the results in the present study, the fractional Voigt model outperforms the Springpot model by adding a static stiffness in parallel. However, in clinical application, it’s impossible to perform in vivo indentation tests on an organ. Thus, adding the static stiffness μ0 as an unknown parameter could be an option if μ0 converges to the indentation test. In order to test this possibility, another fitting was done on the models to have μ0 in the equation of G*(ω) shown in Table 6. It can be found that the μ0 estimated from fractional Voigt model converges the best to the static stiffness measured from the indentation. This strengthens the possibility to use the fractional Voigt model for clinical application.
Table 6.
Estimates of the viscoelastic model parameters by fitting the shear modulus equation G*(ω) for the models having static stiffness as a parameter with the median of the estimated experimental complex shear modulus over the frequency range (500 Hz to 16 kHz) with static stiffness μ0 as an unknown parameter
| Model | μ0 (kPa) | 1st Parameter | 2nd Parameter | 3rd Parameter | 4th Parameter | Error (%) | AIC |
|---|---|---|---|---|---|---|---|
| Voigt | μ0 = 49.83 | η = 0.5455(Pa · s) | / | / | / | 29.97 | 624.5891 |
| Generalized Maxwell | μ0 = 27.5 | μ1 = 88.8(kPa) | μ2 = 22.8(kPa) | η1 = 0.57(Pa · s) | η2 = 2.17(Pa · s) | 29.6 | 624.7848 |
| Zener | μ0 = 36.4 | μ1 = 74.55(kPa) | η1 = 0.9217(Pa · s) | / | / | 13.67 | 573.0675 |
| fractional Voigt | μ0 = 16.72 | μα = 637.3(Pa · sα) | α = 0.4077 | / | / | 3.34 | 495.1964 |
| 3-parameter fractional Zener | μ0 = 18.33 | μα = 453(Pa · sα) | α = 0.4408 | μ1 = 106 (Pa) | / | 3.33 | 496.8971 |
In summary, this study identifies and estimates viscoelastic models and parameters with an approach that compares the complex shear modulus curve in the frequency domain of the predicted mechanical model’s equation and experimental estimation on a tissue-mimicking Ecoflex phantom in an ultra-wide frequency range from 500 Hz to 16 kHz. The complex shear modulus of Ecoflex was estimated by curve fits to the closed form solution with line profiles extracted from MRE experiments conducted in two MRI scanners. Four integer order and five fractional order viscoelastic models were examined in this study, and it is observed that fractional order models describe this viscoelastic material better than integer order models, especially over such a wide frequency range. And, adding a spring element in parallel to a basic fractional model increases the flexibility of the model to also capture static behavior. Among these fractional models, the Springpot and fractional Voigt model have sufficient accuracy and offer the best efficiency with the least number of parameter to be optimized.
Acknowledgments
Financial support of NIH Grant No. EB 012142 is acknowledged.
References
- 1.Muthupillai R, Lomas D, Rossman P, Greenleaf J, Manduca A, Ehman R. Magnetic resonance elastography by direct visualization of propagating acoustic strain waves. Science. 1995;269(5232):1854–1857. doi: 10.1126/science.7569924. [DOI] [PubMed] [Google Scholar]
- 2.Mariappan YK, Glaser KJ, Ehman RL. Magnetic resonance elastography: A review. Clinical Anatomy. 2010;23(5):497–511. doi: 10.1002/ca.21006. [DOI] [PMC free article] [PubMed] [Google Scholar]
- 3.Manduca A, Oliphant TE, Dresner MA, Mahowald JL, Kruse SA, Amromin E, Felmlee JP, Greenleaf JF, Ehman RL. Magnetic resonance elastography: Non-invasive mapping of tissue elasticity. Medical image analysis. 2001;5(4):237–254. doi: 10.1016/s1361-8415(00)00039-6. [DOI] [PubMed] [Google Scholar]
- 4.Streitberger KJ, Paul F, Krefting D, Klatt D, Papazoglou S, Hirsch S, Braun J, Sack I. Decrease of Brain Stiffness Compared to Loss of Brain Volume in Multiple Sclerosis Patients. ISMRM-ESMRMB Joint Annual Meeting; 2010. [Google Scholar]
- 5.Hamhaber U, Klatt D, Papazoglou S, Hollmann M, Stadler J, Sack I, Bernarding J, Braun J. In vivo magnetic resonance elastography of human brain at 7 T and 1.5 T. Journal of Magnetic Resonance Imaging. 2010;32(3):577–583. doi: 10.1002/jmri.22294. [DOI] [PubMed] [Google Scholar]
- 6.Streitberger KJ, Krefting D, Paul F, Klatt D, Papazoglou S, Hirsch S, Braun J, Sack I. MR Elastography and MRI Volumetry of the Aging Brain. ISMRM-ESMRMB Joint Annual Meeting; 2010. [Google Scholar]
- 7.Murphy MC, Curran GL, Glaser KJ, Rossman PJ, John Huston I, Poduslo JF, Jack CR, Felmlee JP, Ehman RL. MR Elastography of the Brain in a Mouse Model of Alzheimer’s Disease. ISMRM-ESMRMB Joint Annual Meeting; 2010. [DOI] [PMC free article] [PubMed] [Google Scholar]
- 8.Hirsch S, Guo J, Reiter R, Papazoglou S, Kroencke T, Braun J, Sack I. MR elastography of the liver and the spleen using a piezoelectric driver, single-shot wave-field acquisition, and multifrequency dual parameter reconstruction. Magn Reson Med. 2013 doi: 10.1002/mrm.24674. [DOI] [PubMed] [Google Scholar]
- 9.Yin Z, Liu Y, Yasar TK, Royston TJ, Magin RL. Evaluation of Tissue Engineered Cartilage Using Microscopic Magnetic Resonance Elastography (μMRE). Experimental Nuclear Magnetic Resonance Conference; 2013; Pacific Grove, CA. [DOI] [PMC free article] [PubMed] [Google Scholar]
- 10.Sack I, Beierbach B, Wuerfel J, Klatt D, Hamhaber U, Papazoglou S, Martus P, Braun J. The impact of aging and gender on brain viscoelasticity. Neuroimage. 2009;46(3):652–7. doi: 10.1016/j.neuroimage.2009.02.040. Epub 2009 Mar 10. [DOI] [PubMed] [Google Scholar]
- 11.Klatt D, Stiller D, Kaulisch T, Nießen H, Riek K, Papazoglou S, Elgeti T, Sack I, Braun J. Wide Dynamic Range MR Elastography of Liver. ISMRM-ESMRMB Joint Annual Meeting; 2010. [Google Scholar]
- 12.Klatt D, Friedrich C, Korth Y, Vogt R, Braun J, Sack I. Viscoelastic properties of liver measured by oscillatory rheometry and multifrequency magnetic resonance elastography. Biorheology. 2010;47(2):133–41. doi: 10.3233/BIR-2010-0565. [DOI] [PubMed] [Google Scholar]
- 13.Yasar TK, Royston TJ, Magin RL. Wideband MR elastography for viscoelasticity model identification. Magnetic Resonance in Medicine. 2013;70(2):479–489. doi: 10.1002/mrm.24495. [DOI] [PMC free article] [PubMed] [Google Scholar]
- 14.Sack I, McGowan CK, Samani A, Luginbuhl C, Oakden W, Plewes DB. Observation of nonlinear shear wave propagation using magnetic resonance elastography. Magnetic Resonance in Medicine. 2004;52(4):842–850. doi: 10.1002/mrm.20238. [DOI] [PubMed] [Google Scholar]
- 15.Klatt D, Yasar TK, Royston TJ, Magin RL. Sample interval modulation for the simultaneous acquisition of displacement vector data in magnetic resonance elastography: theory and application. Physics in medicine and biology. 2013;58(24) doi: 10.1088/0031-9155/58/24/8663. [DOI] [PMC free article] [PubMed] [Google Scholar]
- 16.Yasar TK, Royston TJ, Magin RL. Taking MR Elastography (MRE) to the Microscopic Scale (μMRE). Proceedings of the IEEE International Symposium on Biomedical Imaging: From Nano to Macro; Chicago, IL. March 30 - April 2, 2011.2011. [Google Scholar]
- 17.Royston TJ, Yasar TK, Magin RL. Geometric focusing of high frequency shear waves for noninvasive high resolution MR elastography. 19th Annu. Meeting ISMRM; 2011; Montreal, Canada. [Google Scholar]
- 18.Sneddon IN. The relation between load and penetration in the axisymmetric boussinesq problem for a punch of arbitrary profile. International Journal of Engineering Science. 1965;3(1):47–57. [Google Scholar]
- 19.Fung YC. Biomechanics: mechanical properties of living tissues. 2. Springer-Verlag; 1993. [Google Scholar]
- 20.Gutierrez-Lemini D. Engineering Viscoelasticity. Springer; US: 2014. [Google Scholar]
- 21.Schiessel H, Metzler R, Blumen A, Nonnenmacher TF. Nonnenmacher, Generalized viscoelastic models: Their fractional equations with solutions. J Phys A Mathemat. 1995;Gen. 28 [Google Scholar]
- 22.Magin RL. Fractional calculus in bioengineering. Critical reviews in biomedical engineering. 2004;32:104. doi: 10.1615/critrevbiomedeng.v32.i1.10. [DOI] [PubMed] [Google Scholar]
- 23.Bagley RL, Torvik J. Fractional calculus - A different approach to the analysis of viscoelastically damped structures. AIAA Journal. 1983;21(5):741–748. [Google Scholar]
- 24.Akaike H. A new look at the statistical model identification. Automatic Control, IEEE Transactions. 1974;19(6):716–723. [Google Scholar]
- 25.Bochud N, Rus G. Probabilistic inverse problem to characterize of tissue-equivalent material mechanical properties. IEEE Transactions on Ultrasonics Ferroelectrics and Frequency Control. 2012;59(7):1443–1456. doi: 10.1109/TUFFC.2012.2345. [DOI] [PubMed] [Google Scholar]
- 26.Royston TJ, Dai Z, Chaunsali R, Liu Y, Peng Y, Magin RL. Estimating material viscoelastic properties based on surface wave measurements: A comparison of techniques and modeling assumptions. [DOI] [PMC free article] [PubMed] [Google Scholar]
- 27.Riek K, Millward JM, Hamann I, Mueller S, Pfueller CF, Paul F, Braun J, Infante-Duarte C, Sack I. Magnetic resonance elastography reveals altered brain viscoelasticity in experimental autoimmune encephalomyelitis. Neuro Image: Clinical. 2012;1(1):81–90. doi: 10.1016/j.nicl.2012.09.003. [DOI] [PMC free article] [PubMed] [Google Scholar]
- 28.Freimann FB, Streitberger K-J, Klatt D, Lin K, McLaughlin J, Braun J, Sprung C, Sack I. Alteration of brain viscoelasticity after shunt treatment in normal pressure hydrocephalus. Neuroradiology. 2011 doi: 10.1007/s00234-011-0871-1. [DOI] [PubMed] [Google Scholar]
- 29.Klatt D, Hamhaber U, Asbach P, Braun J, Sack I. Noninvasive assessment of the rheological behavior of human organs using multifrequency MR elastography: a study of brain and liver viscoelasticity. Phys Med Biol. 2007;52(24):7281. doi: 10.1088/0031-9155/52/24/006. [DOI] [PubMed] [Google Scholar]


