Abstract
Ultrasound radiation force-based methods can quantitatively evaluate tissue viscoelastic material properties. One of the limitations of the current methods is neglecting the inherent anisotropy nature of certain tissues. To explore the phenomenon of anisotropy in a laboratory setting, we created two phantom designs incorporating fibrous and fishing line material with preferential orientations. Four phantoms were made in a cube-shaped mold; both designs were arranged in multiple layers and embedded in porcine gelatin using two different concentrations (8%, 14%). An excised sample of pork tenderloin was also studied. Measurements were made in the phantoms and the pork muscle at different angles by rotating the phantom with respect to the transducer, where 0° and 180° were defined along the fibers, and 90° and 270° across the fibers. Shear waves were generated and measured by a Verasonics ultrasound system equipped with a linear array transducer. For the fibrous phantom, the mean and standard deviations of the shear wave speeds along (0°) and across the fibers (90°) with 8% gelatin were 3.60 ± 0.03 and 3.18 ± 0.12 m/s and with 14% gelatin were 4.10 ± 0.11 and 3.90 ± 0.02 m/s. For the fishing line material phantom, the mean and standard deviations of the shear wave speeds along (0°) and across the fibers (90°) with 8% gelatin were 2.86 ± 0.20 and 2.44 ± 0.24 m/s and with 14% gelatin were 3.40 ± 0.09 and 2.84 ± 0.14 m/s. For the pork muscle, the mean and standard deviations of the shear wave speeds along the fibers (0°) at two different locations were 3.83 ± 0.16 and 3.86 ± 0.12 m/s and across the fibers (90°) were 2.73 ± 0.18 and 2.70 ± 0.16 m/s, respectively. The fibrous and fishing line gelatin-based phantoms exhibited anisotropy that resembles that observed in the pork muscle.
Keywords: Transverse isotropy, Ultrasound, Acoustic radiation force, Phantoms, muscle, Shear wave imaging
1. INTRODUCTION
Shear wave elastography constitutes the principle behind a large range of techniques developed in the last two decades for non-invasive assessment of the mechanical properties of soft tissues such as the breast, skeletal muscle, liver, myocardium, prostate, kidney, under normal and abnormal conditions (Nightingale et al., 2001; Sarvazyan et al., 1998; Bercoff et al., 2004; Chen et al., 2009). The basic principle of most shear wave elastography techniques relies on the use of focused ultrasound to generate acoustic radiation force to vibrate the tissue and generate shear waves. The shear wave group velocity (cg) is then tracked as a function of time (Δt) and distance (Δx) using (1). Under the assumption that the tissue is purely elastic, homogenous and isotropic the shear wave group velocity (cg) can then be related to the shear modulus (μ) of the tissue under evaluation (2) respectively, where the tissue density ρ is assumed to be 1000 kg/m3.
| (1) |
| (2) |
Based on these principles, several acoustic radiation force-based shear wave methods have been developed. Acoustic radiation force impulse (ARFI) (Nightingale et al., 2001) uses impulsive radiation force to generate shear waves outside of the excitation region. Supersonic shear imaging (SSI) (Bercoff et al., 2004) creates shear waves inside the tissues by applying focused ultrasound beams at different depths. Shear wave dispersion ultrasound vibrometry (SDUV) (Chen et al., 2009) creates shear waves with harmonic components applying repeated tonebursts of a focused ultrasonic beam. The abovementioned methods provide the ability of accurately quantifying the tissue mechanical properties when dealing with isotropic media or tissues whose mechanical properties are independent of the relative orientation of the transducer with respect to the tissue volume. However, the diagnostic potential of these techniques is challenged when the tissues under evaluation have properties that are directionally dependent, a phenomenon known as anisotropy.
Anisotropy constitutes one of the primary challenges in musculoskeletal ultrasound imaging. Muscle consists of cylindrical fibers organized parallel to each other in clusters called fasciculi. Anisotropy artifacts occur when these clusters of muscle fibers are oblique with respect to the main axis of the muscle or when the orientation of the muscle fibers with respect to the axis of tendons (muscle insertion) occurs in different patterns (Neill, 2008).
A similar issue arises in the myocardium as cardiomyocytes enclosed by endomysial sheaths of collagen are grouped together in fascicles by a sheath of connective tissue (perimysium) organized in a honeycomb like arrangement. This network gives rise to directionally dependent mechanical properties (Engelmayr et al., 2008), as demonstrated by (Lee et al., 2012b).
The presence of anisotropy can also be identified in tissues like the kidneys, where the effect of anisotropy commonly occurs as its two basic layers, the cortex and the medulla contain structures such as the renal tubules, capillaries and small blood vessels that are radially oriented (Giebisch, 2009). It has been shown that the shear wave speed and material properties vary with the direction of the shear wave interrogation with respect to the renal structures (Gennisson et al., 2012; Amador et al., 2011).
Anisotropic effects occur when the angle of exposure of the ultrasound waves used to generate the radiation force is not perpendicular to the plane of the tissue structure that is being evaluated (Neill, 2008). As a result of this, differences in shear wave speed with respect to tissue fiber orientation arise, leading to incorrect interpretation of the shear wave speed values which consequently, affects the quantification of tissue elasticity.
To facilitate the estimation of the elastic parameters of these types of tissues, it is common to assume that these anisotropic biological media can be modeled as being transversely isotropic (TI). TI tissues, can be considered as tissues with physical properties which are symmetric about one plane, normal to the plane of isotropy; in this plane of symmetry the material properties of the media are the same in all directions (Wang et al., 2013). Previous work has demonstrated the feasibility of estimating the mechanical properties of tissues with an anisotropic behavior under this transversely isotropic assumption. Wang, et al., (Wang et al., 2013) and Gennisson, et al., (Gennisson et al., 2003) have provided quantitative speed measurements of shear waves generated by ARFI on ex vivo muscle and by low frequency vibrations on beef muscle and the human biceps, respectively.
More recently, Brum, et al. (Brum, 2014) showed the possibility of estimating the elastic properties of the in vivo transverse isotropic Achilles tendon using shear wave dispersion analysis with the goal of underlying a new technique to diagnose tendon injury.
There is then, a need for developing a tissue mimicking phantom that has characteristics that mimic the shear moduli and shear wave speed variation found in anisotropic materials. Phantoms with transverse isotropic characteristics that can take into consideration different parameters related to anisotropy can help in the accurate interpretation of the shear wave speed measurements and the characterization of this phenomenon in a laboratory setting.
In this study, we designed phantoms using two different fibrous materials at two different concentrations of gelatin. Ex vivo pork muscle was also evaluated under the same set-up for comparison purposes and a simulation study using finite element model (FEM) was used to unify the TI material models. The goal was to evaluate the ability of these phantoms to show repeatable transverse isotropic characteristics and to determinate if the shear wave speed behavior can be similar to the results obtained for the ex vivo pork muscle.
The rest of the paper is organized as follows: In Section II, two different models for characterization of a transversely isotropic material are presented (Royer et al., 2011; Wang et al., 2013; Carcione, 2007; Brum, 2014). The fabrication of transversely isotropic phantoms with two different materials and the experimental set-up, analysis techniques used to evaluate the mechanical properties of these phantoms as well as the FEM study aiming at unifying the theory previously presented in (Wang et al., 2013) for experiments in TI tissues and FEM models (Rouze et al., 2013) for shear waves propagating in a TI material are presented in this Section. B-mode images, group velocity results, and the FEM simulation results are presented in Section III. Additionally, the proposed phantom designs are further evaluated by calculating the fractional anisotropy in Section III. Finally, we discuss the results and conclusions in Sections IV and V, respectively.
2. MATERIALS AND METHODS
2.1. Theory
The wave propagation in anisotropic media is governed by the strain-stress relations or constitutive equations governing the dynamic and static deformation of a material. In order to estimate these relations, it is necessary to first define the strain-energy volume density, which can be expressed using Cartesian components in the form of a 4th order elasticity tensor (Cijkl), and with, εijεkl as the strain tensors (Carcione, 2007) as:
| (3) |
Using the symmetries between the strain and stress tensors, and the independence of the second partial derivatives of V respect to the strain components, the amount of independent elastic constants can be reduced from 81 to 21 (Carcione, 2007). Furthermore, assuming the following form of the strain tensor , which corresponds to the sum of the tensor product of the vectors and multiplied by the strain tensor εij, If the material is transversely isotropic and therefore it possesses an axis of symmetry (x3) , perpendicular to a plane of isotropy (x1, x2) , the strain energy volume density will not be modified by rotations around that axis of symmetry and it can be defined (Carcione, 2007) as
| (4) |
After determining the strain-energy volume density expression, it is necessary to consider the stress, which in its more general form can be defined as:
| (5) |
using again the Cartesian components, the stress for a linear elastic solid (Hooke’s law) can be expressed as:
| (6) |
where, Cijkl and σij represent the elasticity tensor and stress tensor, respectively (Carcione, 2007).
The strain-stress relations described above represent the basis to determine the wave propagation in reference to the displacement in a transversely isotropic material, for which the elasticity tensor contains only five independent elastic constants based on the axial symmetry of TI materials and can be expressed using a matrix notation (Wang et al., 2013) as:
| (7) |
where, the conditions of existence are:
(Wang et al., 2013) has described the mathematical derivations necessary to find the shear wave group velocity in a transversely isotropic material, where the wave equation determined from the relationship between the stress-strain constitutive equations and the equation of motion can be solved assuming plane wave solutions and the symmetry relations that exist for a TI material. The solution of the wave equation becomes a Christoffel equation with the form of an eigenvector eigenvalue problem; from which the shear wave group velocity for a TI material can be calculated as
| (8) |
where Θ is the angle of wave propagation with respect to the fibers in the propagation plane, cg is the shear wave group velocity, p is density, C44 is the longitudinal shear modulus and C66 is the transverse shear modulus (Wang et al., 2013)
2.2. Phantom design & Experimental set up
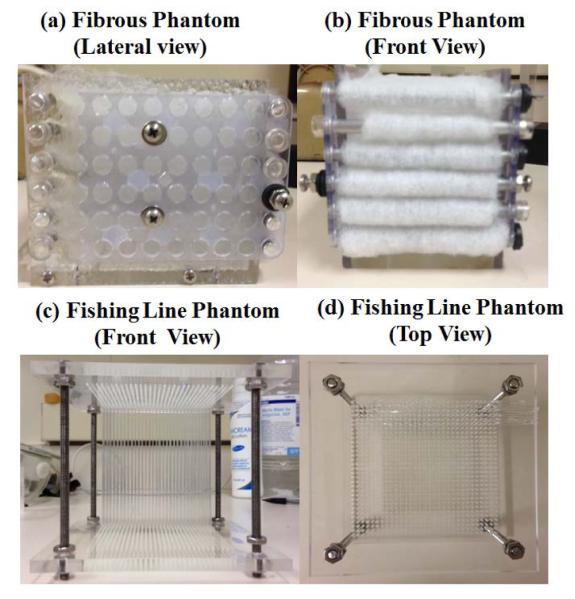
In order to characterize TI materials in a laboratory setting, we created two different phantom designs using fibrous material and fishing line material with directionally dependent properties and dimensions 14 × 14 × 15 cm (width, depth, height). The first phantom design consisted of cube-shaped phantoms using multiple parallel layers of fibrous material (polyester) embedded in porcine 300 Bloom gelatin (Sigma-Aldrich, St. Louis, MO) using two different concentrations of the gelatin (8%, 14%) (figure 1(a) and figure 1(b)). The second phantom design was also made in a cube-shaped mold using a parallel arrangement of monofilament fishing line material (20 lb, Test R6, Transparent Nylon, 0.50 mm diameter, Eagle Claw, Denver, CO) with a spacing of 3 mm in between them. The phantoms were also embedded in porcine gelatin using two different concentrations of the gelatin (8%, 14%) (figure 1(c) and figure 1(d)). In total, 4 TI phantoms were designed and studied. Moreover, in order to evaluate the ability of the phantom designs to effectively mimic TI tissues, we evaluated the anisotropic characteristics of an ex vivo sample of pork tenderloin in a saline bath at 30 °C for comparison.
Figure 1.
Phantom designs incorporating fibrous material ((a), (b)) and fishing line material ((c), (d)) that have preferential orientations. Both set of phantoms were embedded in porcine 300 Bloom gelatin using two different concentrations of the gelatin (8%, 14%).
2.3. Shear wave generation
Shear waves were generated using a Verasonics ultrasound system (Verasonics, Inc., Redmond, WA) equipped with a linear array transducer (L7-4, Philips Healthcare, Andover, MA) operating at a center frequency of f0 = 4.1 MHz. A push beam with duration of 400 μs was focused at a depth of 28 mm from the transducer surface producing particle motion in the direction of the beam. The shear wave speed was estimated from the distribution of particle motion, which was calculated by two-dimensional (2D) in-phase/quadrature auto-correlation method (Kasai, 1986) with spatial and temporal averaging of the compounded echoes from three different angled plane waves transmitted from the ultrasonic array at angles of −4°, 0°, and 4°. The compounded frames were detected at an effective frame rate of 4.16 kHz (Montaldo et al., 2009).
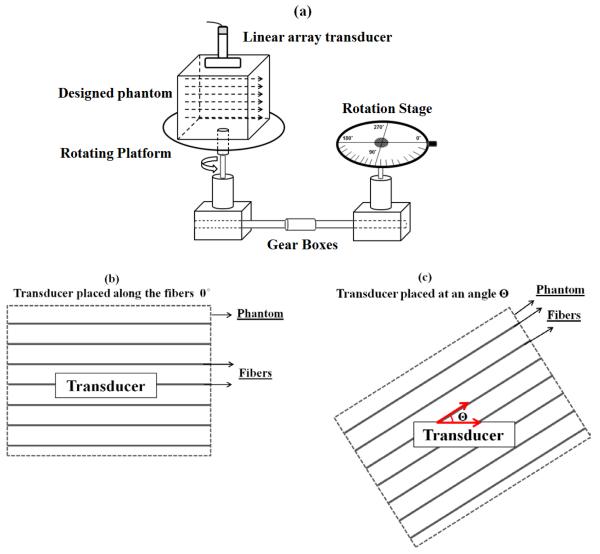
To evaluate the TI characteristics of the four phantoms and the excised pork muscle, each individual phantom and the muscle sample were placed on a rotating platform with the rotation ranging between 0° to 360° every 10° steps as shown in figure 2(a). The phantoms and muscle were rotated with respect to the transducer, where 0° and 180° were defined along the fibers, and 90° and 270° were defined across the fibers as shown in figure 2(b) and figure 2(c). Three shear wave acquisitions were performed at each angle. We also evaluated two different locations for each phantom.
Figure 2.
(a) Experimental set-up with the designed phantom and pork muscle placed on a rotating platform with a rotation range oscillating between 0° to 360° every 10° steps. (b) Top view of the designed phantom, when the ultrasound transducer is placed along the axis of the fibers (0°). (c) Top view of the designed phantom after rotation when the ultrasound transducer is placed at an angle Θ with respect to the axis of the fibers.
2.4. Shear wave group velocity and fractional anisotropy estimation
For all the motion data, a third order Butterworth temporal bandpass filter with frequency band [50-1950 Hz] and a spatial median filter with a 3 by 3 kernel size were applied to the displacement estimations. To obtain the shear wave group velocity, a Radon transform method was used on data averaged over an axial window of size 1.5 mm (Urban and Greenleaf, 2012).
The degree of anisotropy of the designed phantoms and pork muscle was obtained using the fractional anisotropy (FA) formula, which uses the shear wave group velocity results to provide a scalar value that represents the degree of anisotropy of the material. The fractional anisotropy was computed using the following equation (Lee et al., 2012a)
| (9) |
where,
| (10) |
cg1 is the mean group velocity measured at Θ = 0° and Θ = 180° and cg2 is the mean group velocity measured at Θ = 90° and Θ = 270°. The outcome of this FA equation is a numerical value equal or greater than 0, and the higher the numerical value, the more anisotropic the material.
2.5. Finite Element Model
Recently, Rouze, et al., (Rouze et al., 2013) have used a finite element model (FEM) approach to model the wave propagation and impulsive excitation in an incompressible TI material showing the feasibility on estimating the elasticity constants, necessary to describe a TI material. In this paper we performed FEM simulations with the purpose of unifying the transverse isotropic models that have been developed by (Wang et al., 2013), (Royer et al., 2011), (Chadwick, 1994) and to validate the phantom data obtained experimentally. In particular, we are interested in carrying out a cross-validation between the group velocity equation for shear waves in a TI media given by (Wang et al., 2013) and the FEM model developed by (Rouze et al., 2013) for the shear wave propagation in an incompressible TI material.
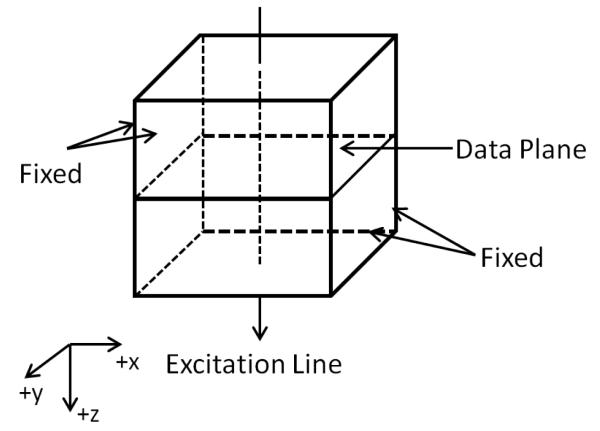
Finite element modeling for simulating shear wave propagation in an elastic, TI medium was carried out in Abaqus CAE (Version 6.12-1, Dassault Systems, Waltham, MA). As shown in figure 3, the model consists of a square block with dimensions 50 × 50 × 50 mm3. The block is excited by a line displacement source along the Z direction, passing through the center point of the Y-X planes. The waveform of the excitation is a 500 μs impulse in the +z direction. The four side surfaces of the block are subjected to a fixed boundary condition.
Figure 3.
Finite element model for simulating shear wave propagation in an elastic, TI medium.
To minimize the effect of the boundaries, shear waves are analyzed in the center plane of the block (z = 0). The displacement in z direction of the data plane are extracted and processed for estimation of the shear wave group velocity. The model is meshed with 1 million hexahedral elements (type C3D8R) with enhanced hourglass control so shear locking and spurious modes are minimized (SIMULIA, 2012). The dimension of each element is 0.5 × 0.5 × 0.5 mm3. The model is solved by the Abaqus® explicit dynamic solver. The total simulated time is 5 ms and the frame rate is 10 kHz.
Because the FEM simulations are carried out in three-dimensions, the full stiffness matrix is needed, although the shear wave speeds are only determined by the two shear moduli C66 (transverse) and C44 (longitudinal). For incompressible, elastic, transverse isotropic materials, three independent variables are needed for constructing the stiffness matrix (Destrade et al., 2013). In this paper, we used the method in (Chadwick, 1994) to estimate the entries of the stiffness matrix other than the two shear moduli (C66 and C44) and we also assumed value of 0.5 for the ratio between in- and cross-isotropy plane Young’s moduli (E1/E3). As described in (Chadwick, 1994), when the material approaches incompressible, the bulk modulus approaches infinity. Therefore, the bulk modulus was set to a large value compared to the shear moduli so the Poisson’s ratio approaches 0.5. This method has been proved to provide a good accuracy for shear wave simulation while keeping the computation time in control (Palmeri et al., 2005). The bulk modulus was not set to that of water (2.2 GPa) because it will significantly increase the runtime without added benefits for shear wave simulation. One way to lower the computational complexity is to split the source into sources for shear waves and compressional waves (Bastard et al., 2009). Because our focus is on the shear wave only and compressional waves travel too fast for ultrasound elastography methods to capture; this effort was not carried out. Table 2 lists the bulk moduli for each simulation; different values were used as cautions were taken so that the speed of the simulated shear wave converges.
Table 2.
Input parameters for stiffness matrix determination
| Material | Transverse shear modulus, C66 (Pa) |
Longitudinal shear modulus, C44 (Pa) |
Bulk Modulus, κ (Pa) |
Poisson’s ratio, ν31 |
|---|---|---|---|---|
| 8% Fibrous Phantom Location 1 | 10109 | 14650 | 1E6 | 0.4908 |
| 8% Fibrous Phantom Location 2 | 10760 | 13769 | 1E6 | 0.4902 |
| 14% Fibrous Phantom Location 1 | 12124 | 17177 | 1E7 | 0.4984 |
| 14% Fibrous Phantom Location 2 | 13225 | 17657 | 1E7 | 0.4988 |
| 8% Fishing-line Phantom Location 1 | 4599 | 8000 | 1E7 | 0.4993 |
| 8% Fishing-line Phantom Location 2 | 5802 | 7418 | 1E7 | 0.4993 |
| 14% Fishing-line Phantom Location 1 | 8404 | 12366 | 1E7 | 0.4992 |
| 14% Fishing-line Phantom Location 2 | 8950 | 13617 | 1E7 | 0.4988 |
| Muscle Tenderloin Location 1 | 5875 | 13220 | 1E6 | 0.4946 |
| Muscle Tenderloin Location 2 | 5909 | 13403 | 1E6 | 0.4946 |
This method is compatible with the methods introduced by others, such as (Royer et al., 2011) and (Papazoglou et al., 2006), which approximates the incompressibility by setting the Poisson’s ratio to ν31≈0.5.
The mass density for all the simulations was set to 1000 kg/m3. The material properties were informed by the experimental data obtained in this study; refer to table 2 in section 3. The shear moduli at the two principal directions 0° and 90° were estimated by first calculating the group velocity at each rotation angle using a time domain cross-correlation method. Then the group velocity as a function of angle was fitted with an ellipse function as indicated by (8) to extract the values of C44 and C66. Because there may be small amount of misalignment, additional degree-of-freedom is allowed in the curve fitting so the ellipse can slightly rotate around and shift from its focus.
The values of C44 and C66 of the FEM simulations were estimated by the method described above. The particle displacement was extracted from the center data plane as indicated in figure 3. Then, the shear wave data for a given angle was calculated by rotating the 2D shear wave image and a cubic interpolation algorithm (imrotate command in MATLAB®). The same data processing procedures were followed as in the processing of experimental data to estimate group velocity and the two shear moduli. Because there is no misalignment in FEM simulated shear wave, the additional rotate and shift of the center of the ellipse in curve fitting were not needed.
3. RESULTS
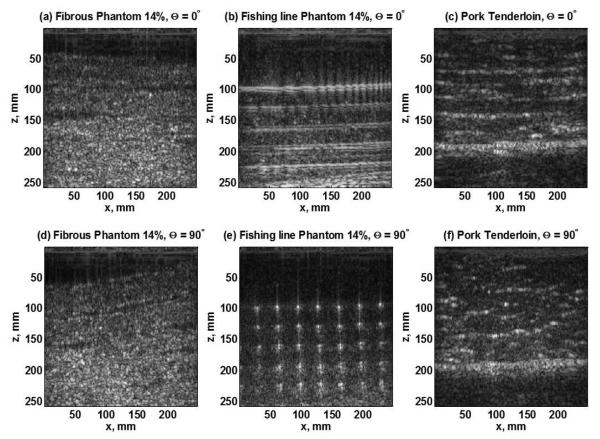
The B-mode images of the two transversely isotropic phantom designs at a gelatin concentration of 14% and the pork muscle sample when the transducer was set parallel (Θ = 0°) and perpendicular (Θ = 90°) to the fibers are illustrated in figure 4.
Figure 4.
B-mode Images for (a) fibrous phantom, (b) Fishing line phantom, (c) pork tenderloin, when the ultrasound transducer is placed along the axis of the fibers (0°). B-mode Images for (d) fibrous phantom, (e) Fishing line phantom, (f) pork tenderloin, when the ultrasound transducer is placed across the axis of the fibers (90°).
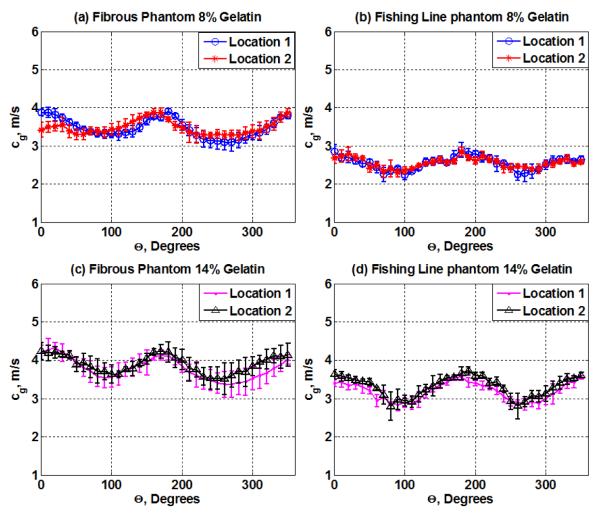
Figure 5 shows the shear wave group velocities as a function of the angle between the transducer and the fibers of the fibrous and fishing line phantom designs at both gelatin concentrations (8% and 14%). For the fibrous phantom, the mean and standard deviations from three measurements of the shear wave group velocity along (0°) and across the fibers (90°) with 8% gelatin were 3.60 ± 0.03 and 3.18 ± 0.12 m/s and with 14% gelatin were 4.10 ± 0.11 and 3.90 ± 0.02 m/s, respectively. For the fishing line material phantom, the mean and standard deviations from three measurements of the shear wave group velocity along (0°) and across the fibers (90°) with 8% gelatin were 2.86 ± 0.20 and 2.44 ± 0.24 m/s and with 14% gelatin were 3.40 ± 0.09 and 2.84 ± 0.14 m/s, respectively. The error bars correspond to the standard deviation between the three different shear wave group velocity measurements at each angle.
Figure 5.
Shear wave group velocity, cg, as a function of the angle of rotation (Θ from 0°-360°) for (a) the fibrous phantom at 8% gelatin concentrations and two different locations within the same phantom; (b) the fishing line phantom at 8% gelatin concentrations and two different locations within the same phantom; (c) the fibrous phantom at 14% gelatin concentrations and two different locations within the same phantom; (d) the fishing line phantom at 14% gelatin concentrations and two different locations within the same phantom.
Figure 6 illustrates the shear wave group velocity as a function of the angle between the transducer and the fibers of the pork muscle sample. For the pork tenderloin sample the mean shear wave group velocity and mean standard deviations from three measurements along the fibers (Θ = 0°) at two different locations were 3.83 ± 0.16 and 3.86 ± 0.12 m/s and across the fibers (Θ = 90°) were 2.73 ± 0.18 and 2.70 ± 0.16 m/s, respectively. The numerical values of shear wave group velocity for the four phantoms and pork tenderloin estimated using a Radon transform method (Urban and Greenleaf, 2012) as explained in section 2.4 are presented in table 1. The standard deviation shows the variation from the mean of three different shear wave group velocity measurements at each angle.
Figure 6.
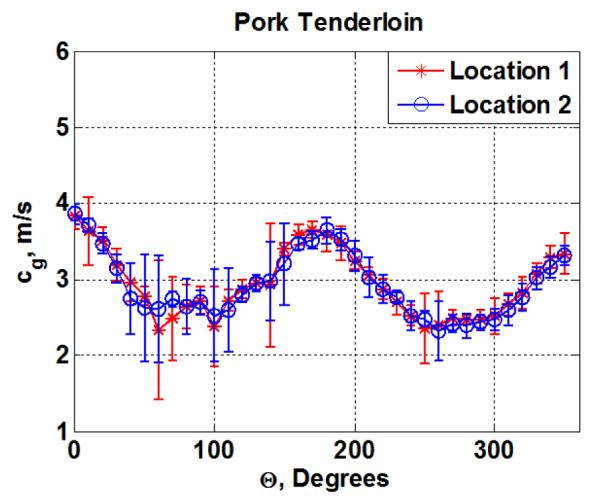
Shear wave group velocity, cg, as a function of the angle of rotation (Θ from 0°-360°) for the pork tenderloin at two different locations within the same phantom.
Table 1.
Group velocity (m/s) estimation for all phantoms and pork muscle along the fibers (Θ = 0°) and across the fibers (Θ = 90°)
| Fibrous Phantom (m/s) |
Fishing Line Phantom(m/s) |
Pork Tenderloin (m/s) |
|||
|---|---|---|---|---|---|
|
|
8% |
14% |
8% |
14% |
|
| Along Fibers | 3.60 ± 0.03 | 4.10 ± 0.11 | 2.86 ± 0.20 | 3.40 ± 0.09 | 3.83 ± 0.16 |
| Across Fibers | 3.18 ± 0.12 | 3.90 ± 0.02 | 2.44 ± 0.24 | 2.84 ± 0.14 | 2.73 ± 0.18 |
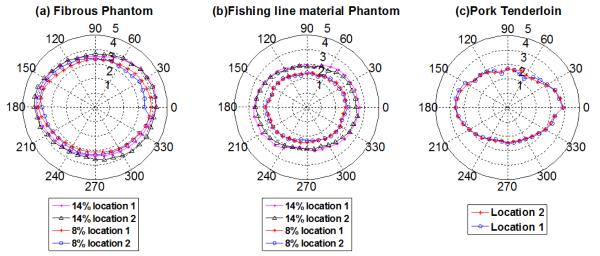
Wang, et al (Wang et al., 2013), has shown that one could also display the shear wave group velocity behavior of a transversely isotropic material using a polar coordinate system with the shear wave group velocity as a function of the angle of rotation, as shown in figure 7.
Figure 7.
Shear wave velocity polar plots for the transversely isotropic phantoms and ex vivo pork tenderloin. (a) fibrous phantom and (b) fishing line phantom at 8% and 14% gelatin concentration at two different locations within the same phantoms, (c) Pork tenderloin at two different locations.
To validate the group velocity results obtained for both phantom designs and the pork muscle sample, FEM simulations were performed assuming the material under evaluation was purely elastic and incompressible. The material properties that were used in the FEM study are shown in Table 2. The longitudinal shear modulus, C44, and transverse shear modulus, C66, were calculated using the following equations (Wang et al., 2013):
| (11) |
| (12) |
The detailed procedure for the determination of the values of C44 and C66 of the FEM simulations is described in section 2.5.
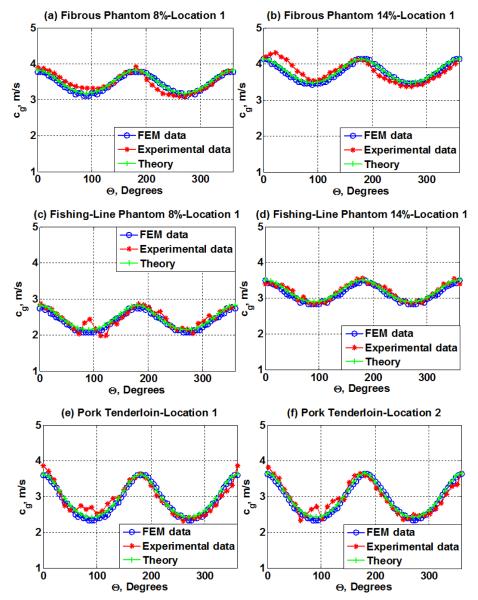
The shear wave group velocity results obtained with FE modeling analysis as a function of the angle between the source of excitation and the material are shown in figure 8. These results show a good agreement with the shear wave group velocity measured experimentally that are described in figure 5 and figure 6. Additionally, the theoretical shear wave group velocity obtained using (8) and the transverse and longitudinal shear modulus on table 2 are shown in figure 8.
Figure 8.
Shear wave group velocity from FEM simulation results vs. Experimental results and theoretical model for (a) fibrous phantom at location 1 with 8% gelatin, ((b) fibrous phantom at location 1 with 14% gelatin, (c) fishing-line phantom at location 1 with 8% gelatin, (d) fishing-line phantom at location 1 with 14% gelatin, (e) Pork tenderloin at location 1, and (f) Pork tenderloin at location 2.
Due to possible misalignments of the ultrasound transducer with respect to the phantom orientation caused by performing the alignment manually, the experimental results were shifted by a certain degree with respect to the theoretical and FEM results. Therefore, to align the experimental results with the values in figure 8 we considered an arbitrary α value, reported in table 3 to realign the experimental results with respect to the FEM and theoretical values. These values of α are estimated from fitting an ellipse for the group velocity.
Table 3.
α value for all phantoms and pork muscle
| Material | α |
|---|---|
| 8% Fibrous Phantom Location 1 | −1.33° |
| 8% Fibrous Phantom Location 2 | −19.93° |
| 14% Fibrous Phantom Location 1 | 2.68° |
| 14% Fibrous Phantom Location 2 | −4.15° |
| 8% Fishing-line Phantom Location 1 | 2.25° |
| 8% Fishing-line Phantom Location 2 | 0.09° |
| 14% Fishing-line Phantom Location 1 | 0.73° |
| 14% Fishing-line Phantom Location 2 | 3.87° |
| Muscle Tenderloin Location 1 | 0.21° |
| Muscle Tenderloin Location 2 | −1.93° |
To quantify the agreement between the FEM simulation and the experimental data, the root mean square error (RMSE) between both data sets along and across the fibers was calculated and summarized in table 4. The RMSE between the theoretical model and the experimental data was also calculated and reported in table 4.
Table 4.
RMSE (m/s) estimation for the experimental values vs. FEM results and Theoretical fits for all phantoms and pork muscle
| Along Fibers |
Across Fibers |
|||||||
|---|---|---|---|---|---|---|---|---|
|
|
8% |
14% |
8% |
14% |
||||
| Theory |
FEM |
Theory |
FEM |
Theory |
FEM |
Theory |
FEM |
|
| Fibrous Phantom (m/s) | 0.028 | 0.106 | 0.055 | 0.053 | 0.144 | 0.209 | 0.062 | 0.117 |
| Fishing Line Phantom(m/s) | 0.028 | 0.118 | 0.113 | 0.095 | 0.291 | 0.363 | 0.062 | 0.003 |
|
Theory
|
FEM
|
Theory
|
FEM
|
|||||
| Pork Tenderloin (m/s) | 0.227 | 0.259 | 0.277 | 0.364 | ||||
Using the measured shear wave group velocity results summarized in table 1 and the fractional anisotropy formula, it is possible to estimate a value that represents the degree of anisotropy of the material. The FA values for the fibrous and fishing line phantoms and the pork muscle sample are listed in table 5.
Table 5.
Fractional anisotropy (FA) estimates for all phantoms and pork muscle.
| Fibrous Phantom |
Fishing line material Phantom |
Pork Tenderloin |
|||
|---|---|---|---|---|---|
|
|
8% |
14% |
8% |
14% |
|
| Location 1 | 0.137 | 0.128 | 0.154 | 0.141 | 0.236 |
| Location 2 | 0.047 | 0.101 | 0.107 | 0.151 | 0.270 |
4. DISCUSSION
Transversely isotropic phantoms represent an alternative when it is desired to characterize the properties of transversely isotropic body organs such as the kidney, skeletal muscle, myocardium, tendons in a laboratory setting. Qin, et al., (Qin et al., 2013) have previously studied the implications of the anisotropic elasticity in soft tissues for the magnetic resonance elastography and diffusion tensor imaging modalities. For these experiments, (Qin et al., 2013) bovine skeletal muscle samples and TI phantoms made out of elastic Spandex fibers and polyvinyl alcohol (PVA) were used. In the study presented in this paper, we studied the implications of transversely isotropic materials in ultrasound by designing phantoms using polyester and fishing-line fibers embedded in porcine gelatin.
Figure 4 shows the B-mode images for the two phantom designs and the pork tenderloin. Here, it is possible to appreciate the changes in the pattern of fiber organization when the angle between the transducer and the fibers goes from Θ = 0° (along the fibers) to Θ= 90° (across the fibers). For the fibrous phantom as shown in figure 4(a) and figure 4(d), it is possible to appreciate the parallel arrangement of the thick layers of fibrous material at Θ = 0°. At Θ = 90°, the pattern can still be distinguished but with slight variations that results in differences in the shear wave group velocity as summarized in table 1. For the fishing line material phantoms shown in figure 4 (b) and figure 4(e), the structural changes in the 2D cross-sectional image of the phantom are more noticeable. There is a parallel organization of the fishing line layers when the transducer is placed along the axis of the fibers, but when it is placed perpendicular to them, it is only possible to observe the strings in cross section. In figure 4(c) is the B-mode of the pork tenderloin when the transducer is placed along the fibers. As can be observed, there is a close parallel and interrupted organization of the muscle fibers at Θ = 0°. When the transducer is rotated to an angle of Θ = 90° with respect to the fibers, the pattern of organization is completely altered as can be seen in figure 4(f).
The shear wave group velocity measurements obtained at different angles between the transducer and the fibers (figure 5 and figure 6) demonstrate that the shear wave group velocity increases gradually as the pork muscle sample and both phantoms designs are rotated to an angle parallel to the fibers. The shear wave group velocity decreases gradually as the phantoms and pork muscle are rotated to an angle perpendicular to the fibers. A similar characteristic for the group velocity in an anisotropic media has been reported by Gennisson, et al. (Gennisson et al., 2003) where the anisotropy of the skeletal muscle was investigated by performing in vitro and in vivo experiments on beef biceps femoris semitendinosus and a human biceps, respectively. The experiments were performed using a rod system with a transducer placed in the middle of it. The shear wave speed measurements were obtained as a function of the angle between the rod and the fibers. Their results showed that the maximum value of shear wave speed was obtained when the transducer was parallel to the fibers and the minimum shear wave speed value measured was obtained when the transducer is perpendicular to the fibers; this premise constitutes the basis of the ultrasound elastic tensor imaging (Lee et al., 2012a) and it has been shown to be a useful indicator for the characterization of anisotropic tissues.
The gelatin concentration is another factor that influences the shear wave group velocity measurements. There is a variation in the speed values obtained when using 8% and 14% gelatin on both phantom designs (figure 5). This difference is more noticeable when examining at the fishing line material phantom; indicating that the shear wave group velocity increases as the gelatin concentration is increased.
To validate the experimental results, FEM simulation and theoretical analysis were performed. The curves obtained using the shear wave group velocity results from the FEM simulation show that there is a good agreement between the FEM data and the numbers obtained experimentally as can be noticed by looking at the level of overlapping of the results obtained experimentally and using FEM in all cases in figure 8.
This agreement is confirmed by the RMSE estimations, summarized in table 4, where it can be seen that the distance of the experimental data points along and across the fibers from the FEM fits is reasonable, where the largest and smallest margin of error are obtained across the fibers for the fishing line phantom at 8% and 14% gelatin respectively, and correspond to a 0.363 m/s and 0.003 m/s difference with the FEM results.
The curves obtained using the shear wave group velocity results obtained theoretically using (8) show a better agreement with the experimental data when compared to the FEM results. The RMSE values summarized in table 4, show that the distance of the experimental data points along from the theoretical data line is smallest along the fibers than across the fibers for all the phantoms and the sample of pork muscle. The largest margin of error is obtained across the fibers for the fishing line phantom at 8% and corresponds to 0.291 m/s difference with the FEM result. The smallest margin of error is obtained along the fibers for the 8% gelatin fibrous and fishing line phantom, and corresponds to a 0.028 m/s difference with the FEM results.
The experimental shear wave group velocity as a function of the angle of rotation can also be observed using a polar coordinate system. Wang et al., (Wang et al., 2013)have previously shown that the polar graph for the shear wave group velocity (wave surface) of a transversely isotropic material is an ellipse. As can be observed in figure 7, when looking at the wave speed distributions the two sets of phantoms and pork muscle approximate the profile of an ellipse, which is the characteristic shape mentioned above for a TI material. This TI behavior is more prominent when looking at the results for the phantoms constructed with a concentration of gelatin of 14%.
Likewise, the anisotropic characteristics of the phantoms designed for this experiment and the pork muscle sample can be characterized using the fractional anisotropy formula (table 5), the higher this scalar value is, the greater the anisotropic characteristics of the material or tissue. An increase in the gelatin percentage increases causes an increase in the degree of anisotropy of the material. The values calculated for the pork tenderloin are higher than the FA values obtained for the phantom designs.
The fabrication of transversely isotropic phantoms has several advantages that can facilitate the study of the anisotropic behavior of many soft tissues. First, as can be appreciated above, the phantoms designed for this study can be built without any difficulty and all the materials used for their construction are commercially available. Additionally, the creation of TI phantoms allows for repeatable measurements using shear waves, as the estimation of the mechanical properties depends on the direction of propagation of the waves respect to the orientations of the fibers in these tissues, therefore ensuring the correct evaluation of tissues whose properties are directionally dependent. Moreover, it is also possible to easily modify the parameters of the designed phantoms such as the level of tension of the fibers, the density of the fibers, and the angle of orientation of different fiber layers, to better approximate other tissues such as the heart. The matrix properties can also be changed to simulate the characteristics of the specific organ that needs to be assessed; for this purpose, different gelatin mixtures, PVA, polyvinyl chloride (PVC), or paraffin can be used as matrix modifications.
The fractional anisotropy formula can also be used in tissue to standardize the degree of anisotropy of different body organs. This value can then be used as a reference for the phantom design and construction. Nevertheless, it will be necessary to elucidate different approaches related to the phantom design that can aid to increase the degree of anisotropy of these materials for future experiments.
There are also, several limitations on this study. First, we only performed the experiments using one level of fiber tension; modifying it could change the degree of anisotropy of the phantom and therefore the shear wave group velocity results; this will be considered for future experiments. Second, the fibers used for the fabrication of the fishing line material phantoms are very stiff compared to the gelatin matrix, and the level of tension at some points along the fibers might have varied, which could have affected the shear wave propagation in these structures and therefore the shear wave group velocity values obtained for this phantom design. Moreover, as can be seen on the B-mode images for the different phantom designs, the fibers are not strictly organized in a specific manner, especially in the fibrous phantom, whereas the fibers in soft tissues might have a particular arrangement. It will be then necessary to better approximate the pattern of fiber organization in future TI phantom designs. Additionally, for the phantom construction we only used gelatin as the matrix based material. It is of interest to vary the matrix properties to observe how it affects the degree of anisotropy of the phantom.
There were also, some difficulties in relation to the alignment of the phantom and the ultrasound transducer with the axis of rotation of the platform. The alignment was performed manually, therefore for some of the experiments the alignment might have changed slightly between phantoms. The values of α in table 3 are generally below 5° which indicate a good overall alignment for the phantoms and sample tested. For future experiments it will be necessary to refine our methods to ensure the correct alignment of the ultrasound probe and the phantom.
The assessment of the viscoelastic properties of the designed phantoms will be performed in future studies in order to achieve a more precise characterization of the transverse isotropic phenomenon in a laboratory setting.
5. CONCLUSION
Transverse isotropic phantoms were designed and fabricated out of fibrous material and fishing line material with the purpose of characterizing the behavior of transverse isotropy media in a laboratory setting. A characterization of the TI phenomenon in these phantom using shear waves was performed assuming they were purely elastic; the results closely matched the ones obtained for the group velocity in ex vivo pork muscle sample and in the FEM simulations, indicating that the phantoms described here can be used to test the transversely isotropic phenomenon in a laboratory setting. The parameters of these phantoms can be adjusted to better resemble the behavior in other TI tissues such as the kidney.
ACKNOWLEDGMENT
The authors thank Jennifer Milliken for administrative support and Thomas M. Kinter for computational support. M. W. Urban thanks Mary Anne Urban for providing different samples for the fibrous material. This work was supported by grant DK092255 from the National Institutes of Health. The content is solely the responsibility of the authors and does not necessarily represent the official views of the National Institute of Diabetes and Digestive and Kidney Diseases or the National Institutes of Health.
REFERENCES
- Amador C, Urban MW, Chen S, Greenleaf JF. Shearwave Dispersion Ultrasound Vibrometry (SDUV) on Swine Kidney. IEEE Transactions on Ultrasonics Ferroelectrics and Frequency Control. 2011;58:2608–19. doi: 10.1109/TUFFC.2011.2124. [DOI] [PMC free article] [PubMed] [Google Scholar]
- Bastard C, Remenieras J-P, Calle S, Sandrin L. Simulation of shear wave propagation in a soft medium using a pseudospectral time domain method. J. Acoust. Soc. Am. 2009;126:2108–16. doi: 10.1121/1.3206585. [DOI] [PubMed] [Google Scholar]
- Bercoff J, Tanter M, Fink M. Supersonic shear imaging: A new technique for soft tissue elasticity mapping. IEEE Transactions on Ultrasonics Ferroelectrics and Frequency Control. 2004;51:396–409. doi: 10.1109/tuffc.2004.1295425. [DOI] [PubMed] [Google Scholar]
- Brum JB,M, Gennisson JL, Tanter M. In vivo evaluation of the elastic anisotropy of the human Achilles tendon using shear wave dispersion analysis. Phys. Med. Biol. 2014:505–23. doi: 10.1088/0031-9155/59/3/505. [DOI] [PubMed] [Google Scholar]
- Carcione JM. In: Wave Fields in Real Media: Wave Propagation in Anisotropic, Anelastic, Porous and Electromagnetic Media. Carcione JM, editor. Elservier; Amsterdam: 2007. pp. 1–24. [Google Scholar]
- Chadwick P. Wave Propagation in Incompressible Transversely Isotropic Elastic Media II. Inhomogeneous Plane Waves. Proceedings of the Royal Irish Academy. 1994;94A:85–104. [Google Scholar]
- Chen S, Urban MW, Pislaru C, Kinnick R, Zheng Y, Yao AP, Greenleaf JF. Shearwave Dispersion Ultrasound Vibrometry (SDUV) for Measuring Tissue Elasticity and Viscosity. IEEE Transactions on Ultrasonics Ferroelectrics and Frequency Control. 2009;56:55–62. doi: 10.1109/TUFFC.2009.1005. [DOI] [PMC free article] [PubMed] [Google Scholar]
- Destrade M, Mac Donald B, Murphy JG, Saccomandi G. At least three invariants are necessary to model the mechanical response of incompressible, transversely isotropic materials. Computational Mechanics. 2013;52:959–69. [Google Scholar]
- Engelmayr GC, Cheng MY, Bettinger CJ, Borenstein JT, Langer R, Freed LE. Accordion-like honeycombs for tissue engineering of cardiac anisotropy. Nature Materials. 2008;7:1003–10. doi: 10.1038/nmat2316. [DOI] [PMC free article] [PubMed] [Google Scholar]
- Gennisson J-L, Grenier N, Combe C, Tanter M. Supersonic Shear Wave Elastography of In Vivo Pig Kidney: Influence of Blood Pressure, Urinary Pressure and Tissue Anisotropy. Ultrasound in Medicine and Biology. 2012;38:1559–67. doi: 10.1016/j.ultrasmedbio.2012.04.013. [DOI] [PubMed] [Google Scholar]
- Gennisson JL, Catheline S, Chaffai S, Fink M. Transient elastography in anisotropic medium: Application to the measurement of slow and fast shear wave speeds in muscles. J. Acoust. Soc. Am. 2003;114:536–41. doi: 10.1121/1.1579008. [DOI] [PubMed] [Google Scholar]
- Giebisch GW, Erich . In: Medical Physiology. Boron WFB, Emile L, editors. Elsevier Health Sciences; Philadelphia: 2009. p. 1352. [Google Scholar]
- Kasai C. Real-Time Two-Dimensional Blood-Flow Imaging Using An Autocorrelation Technique. IEEE Transactions on Ultrasonics Ferroelectrics and Frequency Control. 1986;33:458–64. [Google Scholar]
- Lee WN, Larrat B, Pernot M, Tanter M. Ultrasound elastic tensor imaging: comparison with MR diffusion tensor imaging in the myocardium. Phys. Med. Biol. 2012a;57:5075–95. doi: 10.1088/0031-9155/57/16/5075. [DOI] [PubMed] [Google Scholar]
- Lee WN, Pernot M, Couade M, Messas E, Bruneval P, Bel A, Hagege AA, Fink M, Tanter M. Mapping Myocardial Fiber Orientation Using Echocardiography-Based Shear Wave Imaging. IEEE Transactions on Medical Imaging. 2012b;31:554–62. doi: 10.1109/TMI.2011.2172690. [DOI] [PubMed] [Google Scholar]
- Montaldo G, Tanter M, Bercoff J, Benech N, Fink M. Coherent Plane-Wave Compounding for Very High Frame Rate Ultrasonography and Transient Elastography. IEEE Transactions on Ultrasonics Ferroelectrics and Frequency Control. 2009;56:489–506. doi: 10.1109/TUFFC.2009.1067. [DOI] [PubMed] [Google Scholar]
- Neill JO, editor. Musculoskeletal Ultrasound: Anatomy and Technique. Vol. 1. Springer Science+Business Media, LLC; New York: 2008. [Google Scholar]
- Nightingale KR, Palmeri ML, Nightingale RW, Trahey GE. On the feasibility of remote palpation using acoustic radiation force. J. Acoust. Soc. Am. 2001;110:625–34. doi: 10.1121/1.1378344. [DOI] [PubMed] [Google Scholar]
- Palmeri ML, Sharma AC, Bouchard RR, Nightingale RW, Nightingale KR. A finite-element method model of soft tissue response to impulsive acoustic radiation force. Ieee Transactions on Ultrasonics Ferroelectrics and Frequency Control. 2005;52:1699–712. doi: 10.1109/tuffc.2005.1561624. [DOI] [PMC free article] [PubMed] [Google Scholar]
- Papazoglou S, Rump J, Braun J, Sack I. Shear wave group velocity inversion in MR elastography of human skeletal muscle. Magnetic Resonance in Medicine. 2006;56:489–97. doi: 10.1002/mrm.20993. [DOI] [PubMed] [Google Scholar]
- Qin EC, Sinkus R, Geng G, Cheng S, Green M, Rae CD, Bilston LE. Combining MR elastography and diffusion tensor imaging for the assessment of anisotropic mechanical properties: a phantom study. J Magn Reson Imaging. 2013;37:217–26. doi: 10.1002/jmri.23797. [DOI] [PubMed] [Google Scholar]
- Rouze NC, Wang MH, Palmeri ML, Nightingale KR. Finite element modeling of impulsive excitation and shear wave propagation in an incompressible, transversely isotropic medium. Journal of Biomechanics. 2013;46:2761–8. doi: 10.1016/j.jbiomech.2013.09.008. [DOI] [PMC free article] [PubMed] [Google Scholar]
- Royer D, Gennisson JL, Deffieux T, Tanter M. On the elasticity of transverse isotropic soft tissues. J. Acoust. Soc. Am. 2011;129:2757–60. doi: 10.1121/1.3559681. [DOI] [PubMed] [Google Scholar]
- Sarvazyan AP, Rudenko OV, Swanson SD, Fowlkes JB, Emelianov SY. Shear wave elasticity imaging: A new ultrasonic technology of medical diagnostics. Ultrasound in Medicine and Biology. 1998;24:1419–35. doi: 10.1016/s0301-5629(98)00110-0. [DOI] [PubMed] [Google Scholar]
- SIMULIA DS. Abaqus Scripting User’s Manual 6.11. 2012.
- Urban MW, Greenleaf JF. Use of the radon transform for estimation of shear wave speed. J. Acoust. Soc. Am. 2012;132:1982–3. [Google Scholar]
- Wang M, Byram B, Palmeri M, Rouze N, Nightingale K. Imaging Transverse Isotropic Properties of Muscle by Monitoring Acoustic Radiation Force Induced Shear Waves Using a 2-D Matrix Ultrasound Array. IEEE Transactions on Medical Imaging. 2013;32:1671–84. doi: 10.1109/TMI.2013.2262948. [DOI] [PMC free article] [PubMed] [Google Scholar]


