

Abstract
Restoration of epidermal organization and function in response to a variety of pathophysiological insults is critically dependent on coordinated keratinocyte migration, proliferation, and stratification during the process of wound healing. These processes are mediated by the reconfiguration of both cell-cell (desmosomes, adherens junctions) and cell-matrix (focal adhesions, hemidesmosomes) junctions and the cytoskeletal filament networks that they serve to interconnect. In this study, we investigated the role of substrate elasticity (stiffness) on keratinocyte colony formation in vitro during the process of nascent epithelial sheet formation as triggered by the calcium switch model of keratinocyte culture. Keratinocytes cultured on pepsin digested type I collagen coated soft (nominal E = 1.2 kPa) polyacrylamide gels embedded with fluorescent microspheres exhibited (i) smaller spread contact areas, (ii) increased migration velocities, and (iii) increased rates of colony formation with more cells per colony than did keratinocytes cultured on stiff (nominal E = 24 kPa) polyacrylamide gels. As assessed by tracking of embedded microsphere displacements, keratinocytes cultured on soft substrates generated large local substrate deformations that appeared to recruit adjacent keratinocytes into joining an evolving colony. Together with the observed differences in keratinocyte kinematics and substrate deformations, we developed two ad hoc analyses, termed distance rank (DR) and radius of cooperativity (RC), that help to objectively ascribe what we perceive as increasingly cooperative behavior of keratinocytes cultured on soft versus stiff gels during the process of colony formation. We hypothesize that the differences in keratinocyte colony formation observed in our experiments could be due to cell-cell mechanical signaling generated via local substrate deformations that appear to be correlated with the increased expression of β4 integrin within keratinocytes positioned along the periphery of an evolving cell colony.
1. Introduction
The human epidermis, composed of its principal cell type, the keratinocyte, plays an important role in the barrier function of skin, essential to the physiologic processes of water homeostasis, photoprotection from UV-induced damage, and immune surveillance (1). Central to its biomechanical function, the epidermis is endowed with the ability to regenerate following a variety of different pathophysiological insults. Keratinocyte migration, proliferation, and stratification during the process of wound healing represent the body's attempt to restore the complex organization and function of the tissue (2, 3). This organization is critically dependent on the arrangement of interconnecting desmosomes, adherens junctions, focal adhesions, hemidesmosomes, and transcellular intermediate filament networks. These and other cytoskeletal proteins are responsible for the biomechanical properties of the epidermis. Coupled with fibroblast-mediated repair and reorganization of the dermal extracellular matrix (ECM), investigations focused on enhancing our understanding of the mechanobiological process of wound healing represent an important and ongoing topic of active research.
Under normal physiologic conditions in vivo, keratinocytes at the wound margins must form cell-matrix adhesions in order to migrate, proliferate, and reform a continuous epithelial barrier spanning the zone of damaged tissue. The extracellular matrix (ECM) that keratinocytes are in contact with throughout this process – clinically referred to as granulation tissue – is dynamic in both composition and structure. By necessity, the ability of keratinocytes to sense and respond to changes in such a dynamic mechanical environment must play an integral role in the process of wound healing and the structure-function relationships that develop within the epidermis post-tissue repair (4). Past works have shown that keratinocyte force generation, morphology, migration, and differentiation in vitro can be modulated via changes in the elasticity (or stiffness) of the culture substrate, geometric constraints on cell shape and spreading, the physical dimensionality of the culture system (2D versus 3D), and the biochemical specificity of extracellular matrix proteins available for the formation of adhesive contacts (5-9).
More recently, researchers have explored the mechanobiology of monolayer epithelial sheets via traction force microscopy experiments that probe the migratory behaviors of Madin-Darby canine kidney epithelial cells during the attempted closure of geometrically prescribed defects both internal and external to the boundaries of the monolayer (10-12). As a fiducial model of epithelial sheet mechanics, these studies provide novel insight into the potential behavior of keratinocytes within the context of wound healing. Collectively, however, these studies are focused on the movements of a monolayer epithelial sheet, and not the behaviors of individual cells during the initial formation of the sheet. Although not universally recognized as a mechanism of re-epithelialization, it is conceivable that individual keratinocyte migration, proliferation, and colony formation may play a role in the re-epithelialization of large wounds in vivo. Moreover, individual keratinocyte migration, proliferation, and colony formation may also represent the primary mechanism by which liquid spray-applied keratinocyte cell-based therapies contribute to the enhanced re-epithelialization of chronic human venous ulcers observed in some clinical trials (13, 14). Arguably, experiments that assay the migration, proliferation, and differentiation of individual keratinocytes during the process of re-epithelialization will not only increase our understanding of the physiology of wound healing, but they will also aid in the development and optimization of cell-based wound care therapies of the future.
Towards this end, the purpose of this study was to investigate the role of substrate elasticity (stiffness) on keratinocyte colony formation in vitro during the process of nascent epithelial sheet formation as triggered by the calcium switch model of keratinocyte culture (15-17). In this culture model, normal epidermal keratinocytes maintained in a proliferative monolayer state under low calcium concentrations (0.05-0.1 mM) are induced to form stable cell-cell junctions and stratify by increasing the calcium concentration of the culture media (1.2-1.8 mM). Using a combination of time-lapse differential interference contrast microscopy and substrate displacement tracking microscopy, we monitored cell migration characteristics, rates of colony formation, cytoskeleton/cell morphology, and cell-generated substrate deformations for keratinocytes cultured on both soft (nominal 1.2 kPa) and stiff (nominal 24 kPa) polyacrylamide (PA) gels coated with covalently attached pepsin digested type I collagen and embedded with fluorescent microspheres, before, during, and after a calcium switch. In these experiments, keratinocytes cultured on soft PA gels migrated at increased velocities, produced substantially larger substrate displacements, and colonized faster via more cooperative cellular behaviors than did keratinocytes cultured on stiff PA gels. We hypothesize that the differences in colony formation observed in these experiments could be due to cell-cell mechanical signaling generated via local substrate deformations that appear to correlate with the increased expression of β4 integrin within keratinocytes positioned along the periphery of the evolving cell colony.
2. Material and Methods
2.1. Cell Culture
Neonatal human epidermal keratinocytes (HEKn) (Invitrogen, Carlsbad, CA) were cultured in keratinocyte serum free medium (KSFM) (Invitrogen) supplemented with 1% penicillin-streptomycin and 0.1% amphotericin-B in a humidified incubator maintained at 37° C and 95%/5% air/CO2. The baseline concentration of calcium in this supplemented medium is 0.09 mM, designated here as Low Ca2+ medium. High Ca2+ medium, with a calcium concentration of 1.2 mM, was created by adding CaCl2 to KSFM medium supplemented with penicillin-streptomycin and amphotericin-B as noted above. HEKn were initially plated and passaged in Low Ca2+ medium using standard tissue culture polystyrene flasks. Passage 3 keratinocytes were used for all experiments.
2.2. Polyacrylamide Gels
The polyacrylamide (PA) gels used in these experiments were prepared using a modified version of the protocol described by Pelham and Wang (18). Briefly, glass coverslips (40-mm circular No. 1½, Warner Instruments, Hamden, CT, and 12-mm circular No. 1, Fisher brand, Fischer Scientific, Pittsburgh, PA) were cleaned and etched with a 50:50 hydrochloric acid and methanol solution (19). 40 mm coverslips were used for time-lapse imaging experiments and 12 mm coverslips were used for immunofluorescence studies. After washing, coverslips were activated with 0.1 N sodium hydroxide (Fisher Scientific), 100% 3-aminopropyltrimethyoxysilane (Sigma-Aldrich, St. Louis, MO), and 0.5% glutaraldehyde (Fisher Scientific). To fabricate either a soft or stiff PA gel, respectively, we combined 250 μL and 625 μL or 940 μL and 750 μL of acrylamide and bis-acrylamide using stock solutions of acrylamide monomer (40% w/v, Bio-Rad, Hercules, CA) and bis-acrylamide (2% w/v, Fisher Scientific) that had been passed through a 0.2 μm filter. In a separate mixture, we added 100 μL of 0.5 μm diameter fluorescent microspheres (FluoSpheres® Ex/Em 580/605 nm, Life Technologies, Grand Island, NY), to either 3,992.5 μL (soft gels) or 3,180 μL (stiff gels) of deionized water, sonicating each solution for 15 minutes. The microsphere solutions were then added to their respective soft or stiff acrylamide/bis-acrylamide mixtures. Using a vortex mixer, we then added 7.5 μl of N, N, N′, N′ tetramethylethylenediamine (TEMED) (Fisher Scientific) to each acrylamide/bis-acrylamide/microsphere solution, immediately followed by a 15 minute vacuum degas. Finally, 25 μL of 10% ammonium persulfate (APS) (Fisher Scientific) was added to each acrylamide/bis-acrylamide/microsphere/TEMED solution in order to initiate polymerization. For our time-lapse imaging experiments, 20 μL of either fully combined acrylamide/bis-acrylamide/microsphere/TEMED/APS solution was pipetted onto the surface of an inactivated Rain-X (ITW Global Brands, Houston, TX) treated glass microscope slide cut to measure 15 mm × 15 mm. An activated 40 mm cover glass slip was then placed on top of the liquid bead, in effect forming a thin liquid film between the microscope slide and cover glass. Our immunofluorescence specimens were prepared in a similar fashion, using 10 μL of either fully combined acrylamide/bis-acrylamide/microsphere/TEMED/APS solution, an uncut but inactivated Rain-X treated glass microscope slide, and activated 12 mm coverslips. After allowing the samples to polymerize for 15 minutes at room temperature, the Rain-X treated coverslips were removed. The resultant time-lapse and immunofluorescence specimens consisted of approximately 60-100 μm thick PA gels incorporated with fluorescent microspheres predominantly localized to the free surface of the gel. Upon completion of this initial fabrication sequence, all PA gel specimens were washed with phosphate buffered saline (PBS) and placed in sterile deionized water overnight on an orbital shaker to remove any unreacted residual acrylamide and bis-acrylamide.
In order to facilitate keratinocyte attachment for our calcium switch experiments, pepsin digested type I collagen was covalently attached to the surface of both soft and stiff PA gels using a protocol modified from Pelham and Wang (18). Briefly, sulfosuccinimidyl 6 (4-azido-2-nitrophenyl-amino) hexanoate (sulfo-SANPAH) (Thermo Scientific, Waltham, MA) was dissolved in DMSO (0.25 w/v) and then diluted in 50 mM 4-(2-hydroxyethyl)-1-piperazineethanesulfonic acid (HEPES) (adjusted to pH = 8.5) to a final concentration of 0.2% v/v. The solution was added to the surface of each PA gel and placed under a UV light (Lamp XX-20BLB; 365 nm, 115 V, 20 W, Fisher Scientific) for five minutes. Samples were then washed with HEPES and a fresh mixture of sulfo-SANPAH and HEPES was added to the gel surface. Samples were then exposed to UV light for an additional 5 minutes. After a final HEPES wash, 100 μg/ml of pepsin digested type 1 collagen (PureCol® Advanced Biomatrix, San Diego, CA) was added to the surface of each PA gel and allowed to incubate at room temperature for two hours. Unbound collagen was removed by rinsing the gels with PBS. PA gel substrates were sterilized under UV light (254 nm) in the biosafety cabinet for 15 minutes prior to initiating cell culture. Though not directly measured, the nominal moduli for the soft and stiff PA gels used in this work were assumed to be 1.2 kPa and 24 kPa, respectively, as our gel formulations were nearly identical to those measured previously (20, 21).
2.3. Time-Lapse Live Cell Imaging
Time-lapse live cell images were acquired with a Nikon Eclipse Ti inverted microscope equipped with a perfect focus system, wide-field epifluorescence and differential interference contrast (DIC) microscopy capabilities, a DS-Qi1 Nikon CCD camera, and a ProScan II motorized stage, all driven by NIS Elements software. DIC images for our cell tracking, counting, and classification analyses were obtained with a CFI Plan Apo 10× DIC objective (NA=0.45), as were the fluorescent images used in our substrate deformation tracking analysis (cf. Section 2.6). Inside the biosafety cabinet, a PA gel was placed in a temperature-controlled perfusion chamber (RC-31A, Warner Instruments). The keratinocytes were then plated onto the gel at a density of 4,000 cells/cm2 in Low Ca2+ medium (cf. Section 2.1). Within 15 minutes, the chamber was mounted onto the microscope stage, the temperature was stabilized at 37 °C, and time-lapse imaging was initiated. Keratinocytes were allowed to attach and reach a relative equilibrium for three hours before the calcium concentration of the medium was increased from Low Ca2+ to High Ca2+ via a syringe pump attached to the chamber. High Ca2+ medium was introduced to the chamber at a rate of 0.02 ml/min. The moment that the syringe pump was activated was designated as t = 0. The syringe pump was turned off at t = 50 minutes to ensure that at least two volume changes of the medium had occurred within the chamber. Time-lapse images were collected for a total of 24 hours, after which, the experiment was terminated via introduction of trypsin to the perfusion chamber. For each discrete observation time, t, DIC and fluorescent (Ex/Em 545/620 nm) image pairs were acquired at four overlapping visual fields on the PA gel. Of these four fields, the field with a keratinocyte count closest to 30 cells at time t = 0 was selected for use in the data analyses detailed in sections 2.4, 2.5, and 2.6. The time interval between images in our experiments was set at two minutes as a compromise between the need to minimize the keratinocytes' exposure to light (i.e., phototoxicity) and the need to minimize microsphere displacement tracking errors arising from large microsphere movements between subsequent image pairs. To ensure repeatability, three replicate experiments were performed on each type of PA gel substrate (n = 3 soft gels, n = 3 stiff gels). In addition, in order to provide some context for keratinocyte behavior in the absence of High Ca2+ medium, the experiment was repeated once on each substrate (n = 1 soft gel, n = 1 stiff gel) with exactly the same conditions except that Low Ca2+ medium was perfused through the chamber (starting at t = 0) instead of High Ca2+ medium.
2.4. Cell Classification and Counting
In order to differentiate between single cell and collective cell behaviors, keratinocytes observed in each acquired DIC image were classified as belonging to one of three groups: (i) single cells- individual keratinocytes lacking definitive cellular contacts along the entire periphery of its cell membrane; (ii) cell couples- two juxtaposed keratinocytes with a definitive area of mechanical contact formed by the apposition of their respective cell membranes; and (iii) colonies- three or more juxtaposed keratinocytes with multiple definitive areas of contact formed by the apposition of their respective cell membranes. In this classification scheme, cell couples were distinguished from colonies due to the possibility that cell couples could represent either a dividing cell or a transient cell-cell contact. The number of single cells, cell couples, and colonies were counted at every hour of the experiment. Regardless of their would-be classification, keratinocytes intersecting the border of each DIC image were excluded from the counts due to the uncertain presence of cell-cell contacts outside the field of view.
2.5. Cell Tracking
Cell migration was hand-tracked using the Manual Tracking plugin for ImageJ (National Institutes of Health, Bethesda, MD). The migratory path of a single keratinocyte i at time t in a DIC image was determined by clicking on the center of the cell nucleus and following it frame-by-frame until the cell reached the border of the field of view or until the keratinocyte joined a cell pair or colony. In this manner, an array of position vectors, p⃗i, was created for the tracked keratinocyte. The process was repeated for all individual keratinocytes observed within the DIC image field. Although the time-lapse between DIC images was constant across all of our experiments, the total number of image frames counted for a given keratinocyte varied greatly, i.e., we could not control whether or not the keratinocyte being tracked remained within the field of view, nor could we control how quickly or slowly a keratinocyte being tracked joined a cell pair or colony.
Several parameters associated with keratinocyte migration and colony formation were calculated from the hand-tracked position vectors. First, the average instantaneous speed, 〈s〉i, of cell i was calculated as , where N is total number of image frames counted for the keratinocyte being tracked, and ν⃗i is the instantaneous velocity vector for cell i, calculated as ν⃗i(t)=(p⃗i(t)−p⃗i(t−Δt))/Δt, where Δt is the time-lapse interval between frames. A small number of cells (approximately 5% to 10% per frame) that left the image within the first 15 frames (i.e., 30 minutes) of the experiment were excluded from analysis in order to negate any effect the shear stress generated by the active flow of High Ca2+ medium into the perfusion chamber may have imposed on the initial migratory behaviors of the keratinocytes.
Second, an ad hoc ordinal distance rank (DR) was calculated for each single keratinocyte present in the field at time t = 0. To calculate this metric, we started with a single keratinocyte of interest at t = 0 and ranked the remaining keratinocytes in the visual field by order of the magnitude of their respective internuclear separation distances with the cell closest to the keratinocyte of interest being labeled with a rank of 1. All keratinocytes present within the field were rank ordered, regardless of whether or not they were present as single cells, couples, or colonies. Tracking keratinocytes forward in time, we then identified the rank of the cell that ultimately joined the original keratinocyte of interest to form a couple or colony. The ranking and tracking process was repeated for each single keratinocyte present within the DIC image at time t = 0.
Third, an ad hoc analysis we term the radius of cooperativity (RC) was calculated for each keratinocyte couple or colony present in our DIC images. To calculate this metric, we constructed a circle of radius, RC, centered on a keratinocyte couple or colony observed within the visual field. We then counted all cellular entities (single cells, couples, or colonies) that migrated into the circle, including entities in contact with only the peripheral margin of the circle. Tracking these entities forward in time, we then calculated the percentage of entities initially localized to within the circle that ultimately joined the colony or couple under analysis. The calculations were repeated for each colony or couple formed within the DIC image during the course of the experiment.
2.6. Substrate Displacement Tracking
Substrate displacements generated by keratinocyte tractions on PA gels were measured by tracking the displacements of fluorescent microspheres embedded in our PA gels using a modified version of a template matching digital image correlation algorithm (22) applied to the fluorescent images collected during live time-lapse cell imaging. The algorithm, which uses normalized cross-correlation with an optimized sub-pixel displacement algorithm and local neighborhood smoothing, was applied to subsequent pairs of fluorescent microsphere images associated with times t and t-Δt. Embedded microsphere positions noted at the initialization of the experiment, i.e., just after cell seeding but prior to cell attachment, were used as the reference, or undeformed configuration of the gel. Note that in this version of the algorithm, the sub-pixel displacements were calculated using the algorithm proposed by Chan and Nguyen (23). All displacement tracking and visualization was done in MATLAB (Mathworks, Natick, MA). In adjunctive studies to our major time-lapse cell imaging experiments, we attempted to perform simultaneous cell tracking and counting analyses and substrate displacement tracking using a CFI Plan-Apo 20× DIC objective (NA=0.75) combined with a 1.5× magnifier. Although the higher magnification proved useful for resolving small substrate displacements on stiff gels (cf. Section 3.2), the smaller field of view impaired our ability to conduct cell counting and tracking analyses. As a compromise, all major experiments were performed using a 10× objective (cf. Section 2.3). Lastly, note that for reasons to be discussed in Section 3.2, measured substrate displacements were not used to calculate/estimate the associated cellular tractions as is typically done in a traction force microscopy (TFM) experiment (24).
2.7. Immunofluorescence
In a separate but parallel set of experiments, keratinocytes were cultured in Low Ca2+ on both soft and stiff PA gels that were fabricated on 12 mm coverslips for immunofluorescent labeling of either actin microfilaments and E-cadherin; keratin intermediate filaments and desmoplakin; integrins β1 and β4; or involucrin. Labeling was performed in accord with protocol modified from Zamansky (15) and Selby (25). After seeding and allowing the cells to equilibrate for three hours, the calcium levels of the culture medium were increased to High Ca2+ for selected specimens. At times t = 0 minutes, 1 hour, 4 hours, and 24 hours following the calcium switch, keratinocytes were removed from culture and fixed with either cold (-20 °C) methanol for 10 minutes (actin and E-cadherin; keratin and desmoplakin) or 4% paraformaldehyde at room temperature for 1 hour (β1 and β4; involucrin). Samples in which the calcium concentration was initialized and maintained at 0.09 mM throughout culture (Low Ca2+) were also removed from culture and fixed at 0 and 24 hours. Fixative was then removed and the samples were washed with PBS. Samples that were fixed with 4% paraformaldehyde were further permeablized with 0.5% Triton-X for 5 minutes and washed in PBS for 10 minutes. All samples were then blocked for 30 minutes with either 10% normal goat serum or 10% normal donkey serum and incubated at 37°C using the following antibody combinations: (i) a 1:100 dilution of rabbit anti-cytokeratin polyclonal antibodies (#BT-571, Biomedical Technologies, Ward Hill, MA) and a 1:100 dilution of mouse anti-desmoplakin I + II monoclonal antibodies (#AB16434, Abcam); (ii) a 1:100 dilution of mouse anti-actin monoclonal antibodies (#MAB1501R, EMD Millipore, specific for both globular and filamentous actin) and a 1:100 dilution of rabbit anti-E cadherin monoclonal antibodies (#AB40772, Abcam); (iii) a 1:100 dilution of goat anti-integrin β1 polyclonal antibodies (#SC6622, Santa Cruz Biotechnology) and a 1:100 dilution of mouse anti-human CD104 (i.e., integrin β4) monoclonal antibodies (#555722, BD Pharmingen); and (iv) a 1:500 dilution of mouse anti-involucrin monoclonal antibodies (#AB68, Abcam). Anti-involucrin antibodies were allowed to incubate for 2 hours at 37°C as opposed to the 1-hour incubation used for the other antibody combinations. Following incubation, samples were treated with a second blocking step in either 10% normal goat serum or 10% normal donkey serum for a period of 20 minutes. Finally, the coverslips were incubated for 30 minutes at 37 °C with a 1:100 dilution of the corresponding secondary antibodies: goat anti-rabbit IgG antibodies (#A-11034, Invitrogen Corporation), goat anti-mouse IgG antibodies (#A-11031, Invitrogen Corporation), donkey anti-goat IgG H&L antibodies (#AB150129, Abcam), or donkey anti-mouse IgG antibodies (#A10036, Life Technologies). Between each step in the process, all samples were washed with PBS. Finally, coverslips were mounted onto microscope slides with Prolong® Gold Antifade Mountant with DAPI (Life Technologies) in order to visualize keratinocyte nuclei. Immunofluorescence images were acquired using a Nikon Eclipse Ti inverted microscope with a 20× CFI Plan Apo DIC objective and a 1.5× magnifier.
2.8. Statistical Analysis
Statistical significance (p<0.05) was determined by performing either Student's t-tests when comparing two groups or analysis of variance (ANOVA) when comparing multiple groups. All statistical analysis was done in MATLAB.
3. Results
3.1 Kinematics of Keratinocyte Migration and Colony Formation
Differences in keratinocyte behavior and colony formation as a function of substrate stiffness and exposure to Low Ca2+ (0.09 mM) and High Ca2+ (1.2 mM) medium were assessed by imaging and tracking keratinocyte migratory behaviors on pepsin digested type I collagen coated soft and stiff PA gels. Over the 24-hour observation period, several behavioral differences were observed (Movie S1 - S4).
First, keratinocytes were significantly more spread out on stiff substrates compared to soft. Significant differences in spread areas between keratinocytes on soft and stiff substrates in our Low Ca2+ control experiments were observed for all analyzed time points (Table 1). For example, at t = 2 hours, the average area of a single keratinocyte maintained in our Low Ca2+ control experiments on soft versus stiff gels was 535 ± 315 μm2 (n=18) and 3,189 ± 2,119 μm2 (n=16), respectively. In our High Ca2+ experiments, a two-way ANOVA suggests that keratinocyte spread area is a function of both time and substrate stiffness, with increased spread areas on stiff compared to soft substrates, and a general trend of decreasing spread areas with duration of culture for both types of substrate (Table 1). In comparing differences between spread areas in High Ca2+ and Low Ca2+ experiments, we did find that the calcium switch had an effect on spread area during the first several hours of culture on soft gels (but not stiff gels), but the significance was lost at later time points.
Table 1. Keratinocyte Spread Areas.
| Condition | Cell Area (×103 μm2) | |||||||
|---|---|---|---|---|---|---|---|---|
| 0 hr | 1 hr | 2 hr | 4 hr | 8 hr | 16 hr | 24 hr | ||
| Low Ca2+ | Soft | 0.96 ± 0.64 | 1.06 ± 0.52 | 0.54 ± 0.32 | 0.62 ± 0.37 | 0.51 ± 0.22 | 0.74 ± 0.41 | 0.42 ± 0.13 |
| Stiff | 3.23 ± 1.31 | 3.54 ± 1.71 | 3.19 ± 2.12 | 2.33 ± 1.27 | 2.57 ± 1.83 | 2.08 ± 1.44 | 2.15 ± 1.58 | |
| High Ca2+ | Soft | 1.41 ± 0.85 | 1.55 ± 1.05 | 0.96 ± 0.73 | 0.96 ± 0.73 | 0.96 ± 0.87 | 0.57 ± 0.21 | 0.56 ± 0.13 |
| Stiff | 3.17 ± 1.59 | 2.76 ± 1.56 | 2.94 ± 2.02 | 2.58 ± 2.09 | 1.99 ± 1.02 | 1.99 ± 1.37 | 1.85 ± 1.50 | |
Data are mean ± standard deviation
With regard to migration velocities (Table 2), in Low Ca2+ medium, keratinocytes were 30% faster on soft gels, with an average instantaneous velocity of 1.13 ± 0.25 μm/min compared to 0.86 ± 0.27 μm/min on stiff gels (p < 0.005). Velocities remained virtually unchanged upon exposure to High Ca2+ medium (1.11 ± 0.41 μm/min on soft gels and 0.85 ± 0.39 μm/min on stiff gels) across all time points, demonstrating that keratinocyte speed was not affected by the calcium switch.
Table 2. Keratinocyte Migration and Colony Forming Metrics.
| Measurement | Low Ca2+ | High Ca2+ | ||
|---|---|---|---|---|
| Soft | Stiff | Soft | Stiff | |
| Keratinocyte Speed (μm/min) | 1.13 ± 0.25 | 0.86 ± 0.27 | 1.11 ± 0.41 | 0.85 ± 0.39 |
| Duration of Cell Engagement (min) | 53 ± 99 | 100 ± 120 | 152 ± 155 | 219 ± 157 |
| t50% (min) | - | - | 57.3 ± 22.7 | 162.7 ± 74.9 |
| tfirst (hr) | - | - | 4.5 ± 2.7 | 11.7 ± 5.5 |
| Distance Rank (DR) | - | - | 2.6 ± 2.8 | 5.7 ± 5.5 |
| RC - 125 μm (% of cells that attached) | - | - | 77.8 ± 4.9 | 51.7 ± 12.1 |
| RC - 175 μm (% of cells that attached) | - | - | 64.8 ± 2.8 | 40.3 ± 10.9 |
Data are mean ± standard deviation
In contrast, the process of colony formation was dependent on the switch to High Ca2+ medium (Table 2, Table 3, and Fig. 1). On both types of PA gel, pairs of keratinocytes in Low Ca2+ medium frequently came into contact with each other, but they did not form permanent attachments, and they ultimately disengaged from each other on time scales ranging from a few minutes to several hours over the 24-hour observation period. The duration of engagement (Table 3), though not significantly different (p = 0.1454), was generally shorter on soft gels (average of 53 ± 99 minutes, median 23 minutes) than on stiff gels (average of 100 ± 120 minutes, median 46 minutes). Changing to High Ca2+ medium triggered the keratinocytes to join colonies that were marked by the formation of more permanent cell-cell adhesions, consisting of both desmosomes (Fig. 5) and adherens junctions (Fig. 6). This process unfolded in a dynamic substrate-dependent manner, with keratinocytes joining and sometimes releasing from each other until the majority of cells in the field were associated with couples or colonies. On soft gels, the number of single keratinocytes in a field quickly decreased from an average of 24.3 ± 4.7 cells (or 87.6% ± 13.6% of total cells in the field) at t = 0 hours to 3.7 ± 2.5 cells (10.8% ± 7.8%) at t = 24 hours (Table 3). The number of single keratinocytes on stiff gels did not decrease as quickly or to the same extent (31.0 ± 5.3 to 6.0 ± 4.0 cells or 97.7% ± 4.0% to 21.5% ± 12.2% over the same range). A two-way ANOVA indicated that the number of single cells was dependent on both time and substrates stiffness (p < 0.001), whereas the average total number of keratinocytes per visual field for the soft and stiff gels remained statistically constant throughout the duration of the experiment at 32.1 ± 4.7 cells and 29.8 ± 5.7 cells, respectively (p = 0.57).
Table 3. Keratinocyte Classification and Counts.
| Condition | Measurement | Time | |||||||
|---|---|---|---|---|---|---|---|---|---|
| 0 hr | 1 hr | 2 hr | 4 hr | 8 hr | 16 hr | 24 h | |||
| High Ca2+ | Soft | No. Single | 24.3 ± 4.7 | 19.0 ± 1.7 | 13.3 ± 4.0 | 9.7 ± 1.5 | 7.3 ± 1.5 | 4.7 ± 2.1 | 3.7 ± 2.5 |
| (n=3) | No. Couples | 0.7 ± 1.2 | 1.7 ± 0.6 | 1.7 ± 0.6 | 1.7 ± 0.6 | 1.3 ± 1.2 | 1.7 ± 0.6 | 1.7 ± 0.6 | |
| No. Colonies | 0.7 ± 0.6 | 1.7 ± 0.6 | 3.0 ± 1.0 | 2.3 ± 1.5 | 4.3 ± 1.2 | 4.0 ± 0.0 | 4.7 ± 1.2 | ||
| No Cells per Colony | 2.0 ± 1.7 | 3.2 ± 1.4 | 3.3 ± 1.2 | 5.1 ± 2.6 | 4.9 ± 2.2 | 6.3 ± 3.3 | 6.1 ± 3.2 | ||
| Stiff | No. Single | 31.0 ± 5.3 | 26.3 ± 6.1 | 24.0 ± 3.6 | 21.3 ± 5.9 | 12.3 ± 6.6 | 7.7 ± 2.1 | 6.0 ± 4.0 | |
| (n=3) | No. Couples | 0.3 ± 0.6 | 1.7 ± 1.5 | 2.7 ± 0.6 | 2.3 ± 2.1 | 5.3 ± 3.5 | 2.3 ± 1.5 | 3.0 ± 2.0 | |
| No. Colonies | 0.0 ± 0.0 | 0.3 ± 0.6 | 0.7 ±0.6 | 2.0 ± 1.7 | 3.3 ± 1.5 | 3.3 ± 0.6 | 3.0 ± 1.0 | ||
| No Cells per Colony | 0.0 ± 0.0 | 1.0 ± 1.7 | 2.3 ± 2.1 | 3.2 ± 0.4 | 3.4 ± 0.5 | 4.0 ± 1.3 | 5.2 ± 2.3 | ||
| Low Ca2+ | Soft | No. Single | 28 | 28 | 23 | 21 | 23 | 22 | 25 |
| (n=1) | No. Couples | 0 | 0 | 2 | 3 | 0 | 0 | 0 | |
| No. Colonies | 0 | 0 | 0 | 0 | 1 | 0 | 0 | ||
| No Cells per Colony | 0 | 0 | 0 | 0 | 3 | 0 | 0 | ||
| Stiff | No. Single | 21 | 22 | 21 | 20 | 20 | 20 | 22 | |
| (n=1) | No. Couples | 2 | 0 | 0 | 0 | 1 | 2 | 3 | |
| No. Colonies | 0 | 1 | 1 | 0 | 0 | 1 | 1 | ||
| No Cells per Colony | 0 | 3 | 3 | 0 | 0 | 4 | 4 | ||
Data are mean ± standard deviation
Fig. 1.
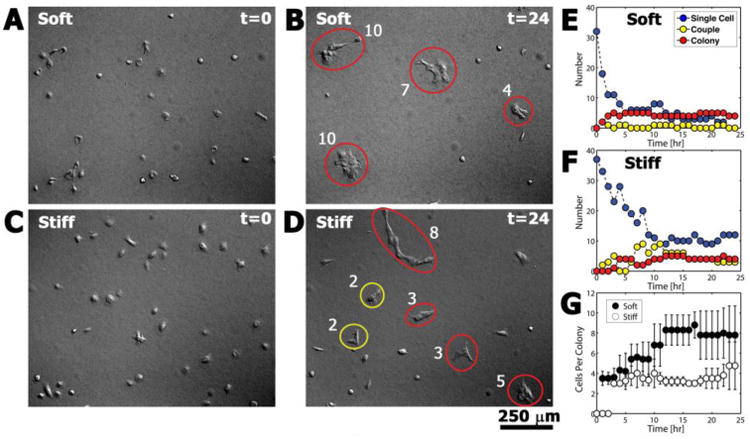
Representative DIC images showing differences in colony formation on soft and stiff PA gels at t = 0 hours (A, C) and t = 24 hours (B, D). At each hour the number of single cells, couples (yellow ellipses), and colonies (red ellipses) was determined (E, F), along with (G) the number of cells per colony (number adjacent to each ellipse).
Fig. 5.
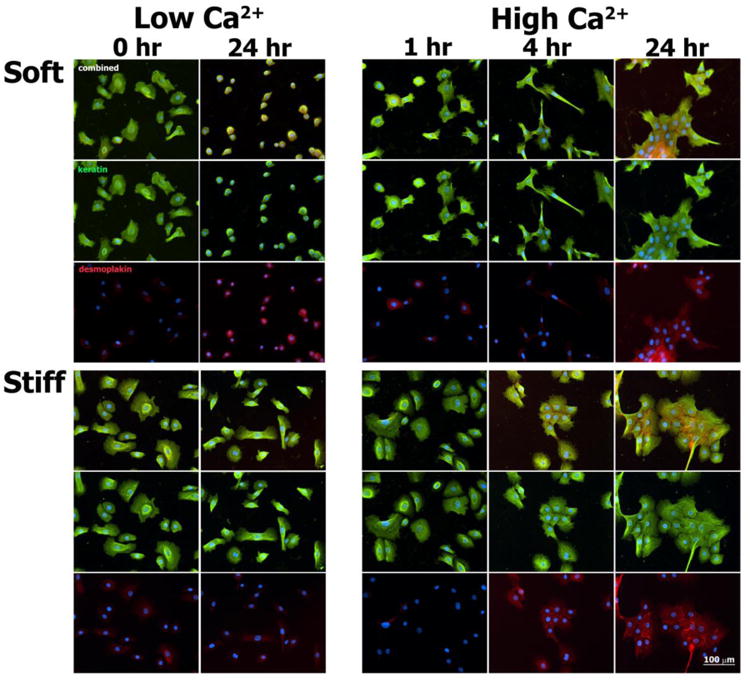
Immunofluorescence images of keratin intermediate filaments (green), desmoplakin (red), and nuclei (blue) in normal human epidermal keratinocytes cultured for select times on soft and stiff PA gels exposed to both Low Ca2+ and High Ca2+ conditions.
Fig. 6.
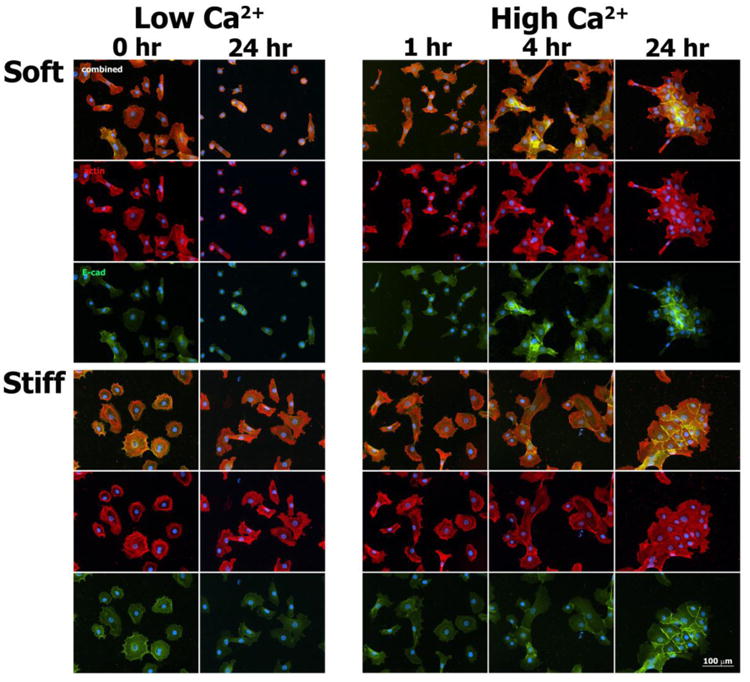
Immunofluorescence images of actin (red), E-cadherin (green), and nuclei (blue) in normal human epidermal keratinocytes cultured for select times on soft and stiff PA gels exposed to both Low Ca2+ and High Ca2+ conditions.
In High Ca2+, when two keratinocytes joined together on a soft gel, the couple that formed generally did not last long (152 ± 155 minutes, median 88 minutes) because either the cells released from each other and continued on as single cells or other cells quickly joined the couple to form a colony. In contrast, keratinocytes on stiff gels formed couples that endured longer (219 ± 157 minutes, median 198 minutes). The number of couples did not change significantly over time on either gel (Table 3). There was, however, a significant dependence on substrate stiffness (p < 0.001), with roughly twice as many couples found on stiff gels (3.3 ± 1.0 couples, or 21.7% ± 5.8% of the total cells) as were found on soft gels (1.5 ± 0.3 couples, or 10.6% ± 2.8%). It should be noted that a small number of couples (n=3 on soft gels, n=4 on stiff gels) persisted for the duration of the experiment and were excluded from these calculations.
The vast majority of keratinocytes on both types of PA gel ultimately formed colonies, with significantly more colonies (3.8 ± 1.0 versus 2.9 ± 1.3, p < 0.001) and more cells per colony (5.4 ± 1.2 and 3.6 ± 1.2, p<0.001) forming on soft rather than stiff gels, using keratinocyte counts averaged over the duration of the experiment (Fig. 1). At the conclusion of the experiment (t = 24 hours), the same trends were observed with 4.7 ± 1.2 colonies versus 3.0 ± 1.0 colonies and 6.1 ± 3.2 cells per colony versus 5.2 ± 2.3 cells per colony observed on soft versus stiff gels, respectively. Colonies also formed faster on soft gels. Two metrics were used to characterize the rate of colony formation (Table 2). First, the average time, tfirst, required for the first colony to form (excluding colonies already formed at t = 0) was calculated. It was found that the first colony formed faster (but not significantly, p = 0.08) on soft gels (57.3 ± 22.7 minutes) than on stiff gels (162.7 ± 74.9 minutes). The second metric calculated was the average time, t50%, required for at least 50% of the keratinocytes in the image to associate with a colony. This time also was shorter on soft compared to stiff gels at 4.5 ± 2.7 hours and 11.7 ± 5.5 hours, respectively, though again, not significantly (p = 0.1115).
In general, keratinocytes did not always form couples or colonies through mechanical contacts with their closest neighboring cells, an unexpected behavior that was particularly evident for cells cultured on stiff gels. To quantify this difference in keratinocyte behavior observed during the process of colony formation on soft versus stiff substrates, we defined an ad hoc analysis termed the distance rank (DR). When ranked ordered by the magnitudes of their respective internuclear separations, keratinocytes cultured on stiff gels formed couples or colonies with neighboring cells that had an average distance rank (DR) of 5.7 ± 5.5, median rank of 4, compared to an average DR on soft gels of 2.6 ± 2.8, median rank of 2 (Table 2).
In addition to the ordinal DR metric, we performed a second ad hoc analysis, termed the radius of cooperativity (RC), in an attempt to correlate the length scale of a cell with the degree of cooperativity in colony formation characterized by keratinocytes cultured on soft versus stiff substrates. Based on observed cell spread areas at time t = 0 (Table 1) for High Ca2+ conditions, we estimated nominal cell diameters (assuming circular spread areas) of ~40 μm and ~60 μm for keratinocytes cultured on soft and stiff substrates, respectively. Then, assuming a stiffness-independent mean nominal cell diameter of ~50 μm and hence a nominal cell couple diameter of ~100 μm, RC analysis was performed for radii of 125 μm and 175 μm, or ~1.5 and ~2.5 nominal cell diameters, respectively, from the peripheral margin of a hypothetical cell couple of interest (Table 2, Fig. 2). Keratinocytes joined with 77.8% ± 4.9% of the cellular entities (single cells, couples, or colonies) present within a 125 μm RC on soft gels, compared to 51.7% ± 12.1% for the same 125 μm RC on stiff gels (p < 0.03). Similarly, keratinocytes joined with 64.8% ± 2.8% of the cellular entities present within a 175 μm RC on soft gels, compared to 40.3% ± 10.9% for the same 175 μm RC on stiff gels (p < 0.019).
Fig. 2.
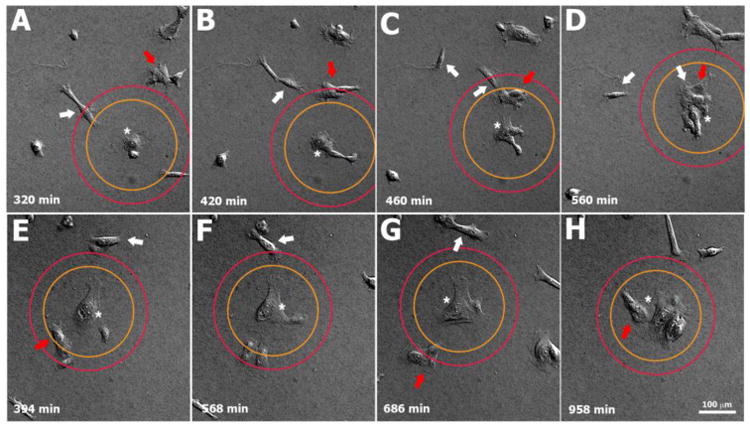
Representative images showing single keratinocytes, couples, and colonies entering the radius of cooperativity (RC) for radii of 125 μm (orange circle) and 175 μm (red circle) on soft (A-D) and stiff PA gels (E-F). The couple/colony analyzed in each example is indicated by an asterisk. On the soft gel (A-D), an approaching couple (white arrow) crosses the inner & outer RC at t = 320 min in close proximity to a small colony (red arrow) that just touches the outer RC. As the colony migrates into the inner RC at t = 420 and t = 460 min, keratinocytes of the first couple disengage from one another (two separate white arrows). One cell eventually exits the outer RC and the other cell merges with the entering colony (red arrow) to join the central colony (asterisk) at time t = 560 min. On a stiff gel (E-H), a small colony (red arrow) is present at the inner RC, and a cell couple (white arrow) is present at the outer RC at t = 394 min. The couple eventually exits both RC (leaving the field of view) without joining the central couple of interest (asterisk), while the small colony (red arrow) temporarily moves away from the couple of interest at t = 568 min and t = 686 min before finally merging with it at t = 958 min to form a small colony.
3.2 Substrate Displacements during Colony Formation
In addition to keratinocyte morphology and kinematics, differences in substrate deformations were also observed between keratinocytes cultured on soft versus stiff substrates. Under both High Ca2+ and Low Ca2+ conditions, keratinocytes cultured on stiff PA gels generated very small substrate displacements, as monitored by tracking the positions of embedded fluorescent microspheres. The single largest tracked displacement using a 10× objective (Movie S4) was 1.6 μm- a value below the estimated 2.7 μm algorithm measurement error at this magnification. Consequently, the microsphere displacements on stiff gels at this magnification were treated as effectively zero, and no further quantitative analysis was conducted. Adjunctive experiments performed on a stiff PA gel using a 20× objective with a 1.5× magnifier resulted in an average maximum displacement per time point of 1.39 ± 1.93 μm (0.62 μm estimated algorithm error), with 2.29 μm representing the single largest maximum displacement measured over the 24-hour duration of the experiment (Movie S6). These observations confirmed that small but measureable substrate displacements were generated by keratinocytes cultured on stiff substrates. However, at this magnification the field of view was markedly reduced, and ultimately deemed too restrictive for assessing collective keratinocyte behaviors during the process of colony formation.
For keratinocytes cultured on soft gels maintained in Low Ca2+ conditions as controls, microsphere displacements were much higher, but did not vary much over the 24-hour time course (Fig. 3, Movie S1). The overall average microsphere displacement was 4.2 ± 2.6 μm, with 17.9 μm representing the single largest microsphere displacement tracked. Under High Ca2+ conditions, keratinocytes generated microsphere displacements that were not only higher, but they also increased with duration of culture and in parallel with nascent epithelial sheet formation (Figs. 3, 4, Movie S3). Average displacements ranged from 8.7 ± 5.7 μm at t = 0 hours to 19.4 ± 21.2 μm at t = 24 hours (Movie S7). Here, the single largest displacement tracked was 113.5 μm, occurring at t = 24 hours.
Fig. 3.
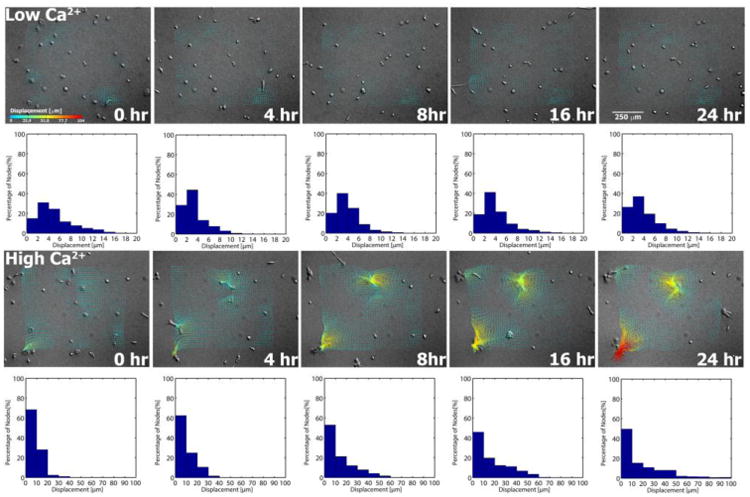
Cell tractions deform soft PA gels in a manner that is dependent on the calcium concentration of the culture medium and the extent of keratinocyte colony formation. Substrate displacements are determined by tracking microsphere displacements in Low Ca2+ and High Ca2+ experiments at the indicated time points (cf. Section 2.6). Displacements increase with time under High Ca2+ conditions, correlating with the extent of keratinocyte colony formation. Note the difference in the range of x-axis displacements indicated on the histograms associated with the Low Ca2+ and High Ca2+ measurements.
Fig. 4.
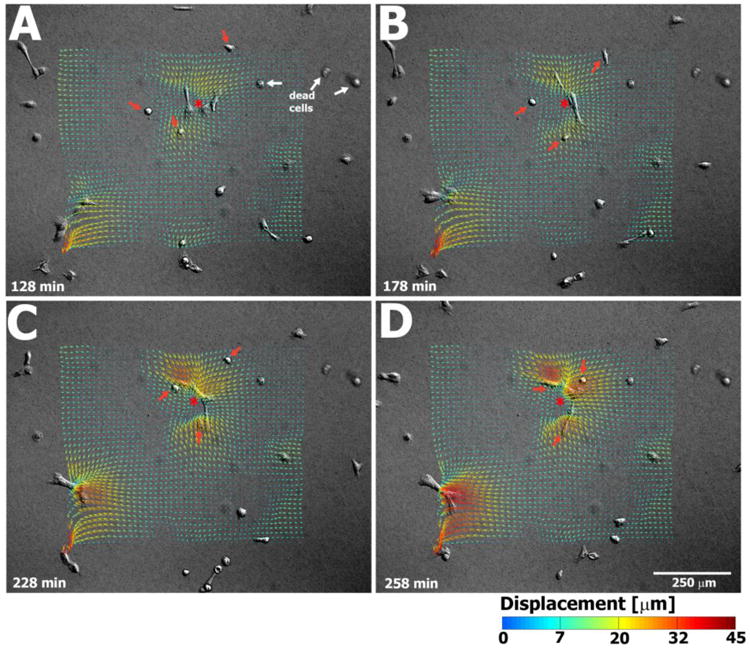
Selected frames show that in High Ca2+ conditions, keratinocyte colonies forming on soft PA gels generate large substrate displacements that appear to draw single keratinocytes inward towards a forming colony. Dead cells are indicated by white arrows. The relative positions of three selected individual keratinocytes are indicated by red arrows at all four time points with respect to a forming colony (indicated by an asterisk).
Two important experimental factors precluded quantitative traction force microscopy (TFM) analysis in our study, namely: (i) limitations in the detection and tracking of substrate displacements for our extremes in substrate stiffness, and (ii) the ill-defined and dynamic nature of the boundary conditions required to solve the inverse problem of calculating cell tractions from measured substrate displacements. With regards to the former, the soft and stiff formulations of our PA gels were not optimized for TFM analysis: substrate displacements observed in our stiff gels were so small that they fell within the uncertainty of our tracking algorithms, while the extremely large displacements observed in our soft gels invalidate many of the assumptions inherent to most forms of TFM analysis (infinitesimal strains and a linear elastic continuum). With regards to boundary conditions, note that keratinocytes were free to migrate in and/or out of the optical field of view throughout the 24-hour duration of our experiment. Thus, not only are the cellular tractions present at the boundaries of our observation window spatially uncertain, they are also temporally variable. These technical issues will be addressed in future work by using smaller cell numbers, more focused fields of view with higher power objectives, and TFM analysis that employs a large deformation formulation (26).
3.3 Keratinocyte Cytoskeletal Morphology
Immunofluorescent labeling of actin microfilaments, keratin intermediate filaments, desmoplakin (component of desmosomes), and E-cadherin (component of adherens junctions) within keratinocytes cultured on both soft and stiff PA gels revealed differences in cytoskeletal organization that were consistent with the dynamic cell morphologies observed in our time-lapse DIC images (Figs. 5, 6). In Low Ca2+ conditions (t = 0 hours), keratinocytes on both soft and stiff substrates assumed a predominantly rounded morphology, with cells on stiff substrates exhibiting a notably increased degree of cell spreading. Spindled morphologies were also observed, with an increased number density on soft compared to stiff substrates. With respect to our time-lapse DIC images, small rounded keratinocytes were observed to migrate over the surface of both types of gel, occasionally transitioning into an elongated spindled morphology before eventually condensing back into a rounded morphology and resuming their migratory behaviors (cf. t = 2 hours of Movie S1). This type of transitional morphologic behavior, though present, was relatively uncommon on stiff gels. Following 24 hours of culture in Low Ca2+ conditions, the number of keratinocytes adopting a small rounded-up morphology was dramatically increased on soft compared to stiff substrates.
For both substrate types under Low Ca2+ conditions, focal actin concentrations were noted at the cell peripheries, with thicker actin fibers indicative of stress fibers more clearly visualized in keratinocytes cultured on stiff substrates across all time points. At baseline (t = 0 hours, Low Ca2+), keratin intermediate filaments formed networks that centrifugally extended from a perinuclear cage-like structure. Following the calcium switch, microfilament organization within keratinocytes cultured on soft PA gels changed rapidly, marked by the formation of lamellipodial- and pseudopodial-like structures at t = 1 hour. At t = 24 hours following the calcium switch, cell-cell adherens junctions were formed between keratinocytes within colonies on both soft and stiff substrates, as marked by the punctate/linear staining of E-cadherin (Fig. 6). Within this same time frame, keratin intermediate filaments reorganized to form highly integrated networks that spanned multiple cell-to-cell contacts within colonies cultured on both soft and stiff substrates. These networks were associated with the formation of cell-cell desmosomes, as marked by the punctate staining pattern of desmoplakin (Fig. 5). Desmoplakin staining appeared more prominent on stiff versus soft substrates at t = 4 hours, suggestive of an increased rate of desmosome assembly.
Interestingly, keratinocytes found along the periphery of colonies cultured on soft substrates exhibited a spindled morphology with visible lamellipodial- and pseudopodial-like microfilament structures, suggestive that colonies on soft substrates are more actively seeking mechanical contact(s) with neighboring cells or colonies in order to incorporate them into the evolving epithelial sheet. Similar pseudopodial-like extensions were also observed in some single keratinocytes that were in close proximity to a nearby colony. By correlation, in our time-lapse DIC images (Fig. 7), single keratinocytes on soft gels were frequently observed to extend pseudopodial-like structures that were directed towards the colony it was attempting to join. In contrast to these findings, keratinocytes present along the periphery of colonies cultured on stiff substrates exhibited a more rounded morphology with little to no evident formation of pseudopodial-like microfilament structures. As noted in our DIC images, keratinocytes on stiff substrates frequently did not join a colony via directed orthogonal movements, but rather seemed to merge with its eventual colony via an increasingly tangential approach (Fig. 7).
Fig. 7.
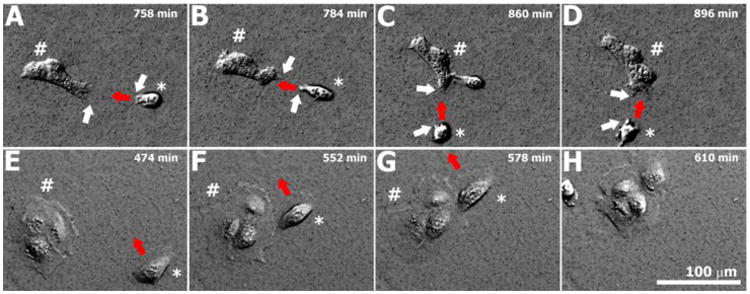
The characteristics of colony formation differ on soft (A-D) and stiff (E-H) gels. On soft gels (A-D), small pseudopodial-like projections (white arrows) extend outward from both the approaching cell (indicated by an asterisk) and its eventual cell of contact (indicated by number sign) within the colony. The approaching cell migrates directly (velocity vector indicated by red arrows) towards its contact cell in a process that appears to be mediated by these pseudopodial-like extensions. On stiff gels (E-H), pseudopodial-like projections were not observed between merging keratinocytes during the process of colony formation. Rather, migrating keratinocytes (asterisk) often approached their eventual cell of contact within a colony (number sign) via an almost tangential pathway, as can be seen by the velocity vectors (red arrows) indicated for the approaching keratinocyte labeled in (E), (F), and (G) that eventually joins the colony shown in (H).
In order to explore possible differences in cell-matrix adhesive contacts under various experimental conditions, immunofluorescence experiments (Fig. 8) were performed by co-labeling for β1 integrin, a component of focal adhesion contacts, and β4 integrin, a component of hemidesmosomes in vivo and hemidesmosome-like contacts in vitro (27). Under Low Ca2+ conditions, some staining of β1 integrin was observed over 24 hours of culture, whereas β4 integrin was diffusely expressed throughout the cytoplasm without any definitive foci of staining along the cell-matrix interface. After 24 hours of culture under High Ca2+ conditions, punctate foci of β1 integrin staining were observed in all keratinocytes belonging to a colony, independent of a given cell's position within the colony and independent of the stiffness of the PA gel. Staining for β4 integrin remained cytoplasmically diffuse in cells cultured on stiff PA gels for all time points. At t = 24 hours following the calcium switch, punctate staining of β4 integrin along the cell-matrix interface appeared within keratinocytes positioned along the periphery of colonies cultured on soft substrates (Fig. 9A). This staining pattern was not observed within colonies cultured on stiff gels (Fig. 9B).
Fig. 8.
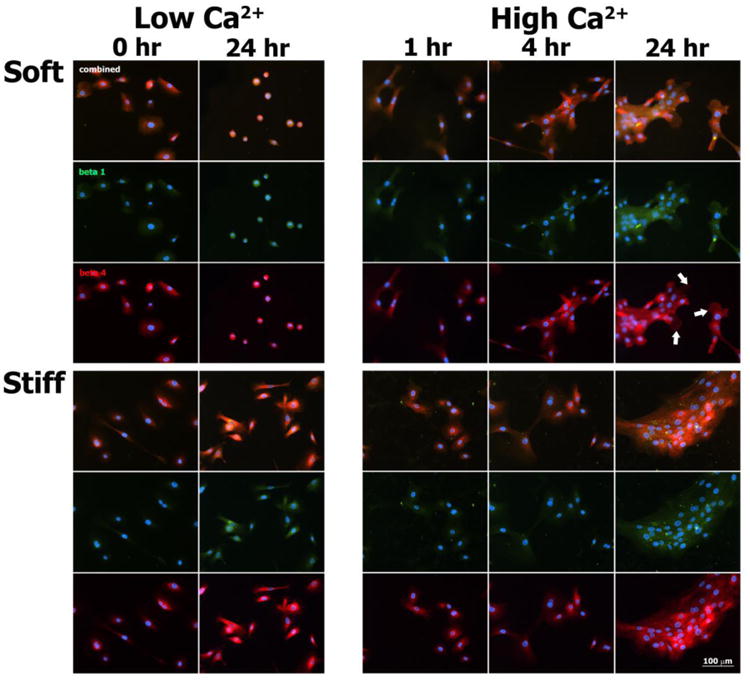
Immunofluorescence images of β4 (red), β1 (green), and nuclei (blue) in normal human epidermal keratinocytes cultured for select times on soft and stiff PA gels exposed to both Low Ca2+ and High Ca2+ conditions. White arrows indicate punctate staining of β4 on the colony periphery at 24 hours in High Ca2+ conditions on soft gels.
Fig. 9.
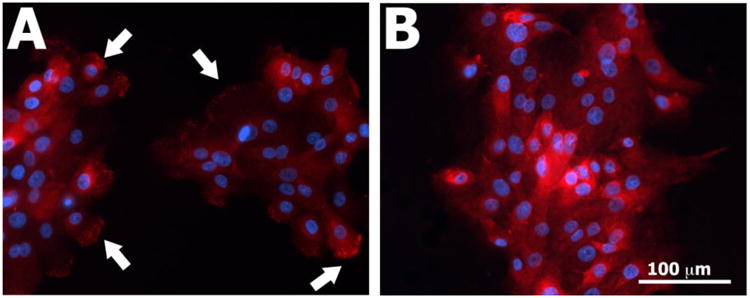
Immunofluorescence images of β4 (red) and nuclei (blue) in normal human epidermal keratinocytes cultured for 24 hours in High Ca2+ conditions on (A) soft and (B) stiff PA gels. White arrows highlight areas of punctate staining observed in peripheral keratinocytes within colonies cultured on soft gels.
Lastly, the average internuclear spacing of keratinocytes within colonies cultured under High Ca2+ conditions on soft substrates was diminished compared to the internuclear spacing of cells on stiff substrates. In some instances, this reduction in spacing might be due to the local three-dimensional stratification and differentiation of keratinocytes within the colony, as can be inferred from partially overlapping DAPI-stained nuclei (Figs. 5 & 6, soft substrate, t = 24 hours). In order to evaluate whether substrate-dependent keratinocyte differentiation played a role in the colony-forming behavior observed in our experiments, we also evaluated involucrin expression, a keratinocyte-specific differentiation marker (16), across select time points of culture under both Low Ca2+ and High Ca2+ conditions (Fig. 10). Under Low Ca2+ conditions, positive staining for involucrin was noted at t = 24 hours for a very small subset of cells cultured on both soft and stiff PA gels. At t = 4 and t = 24 hours following the calcium switch, positive involucrin staining was observed within keratinocytes cultured on both soft and stiff gels, with staining primarily localized to cells positioned within the center and stratified layers of each given colony. Involucrin staining was notably absent from peripheral cells of the colony and keratinocytes migrating as single cells. No definitive differences in involucrin staining were noted between soft and stiff gels.
Fig. 10.
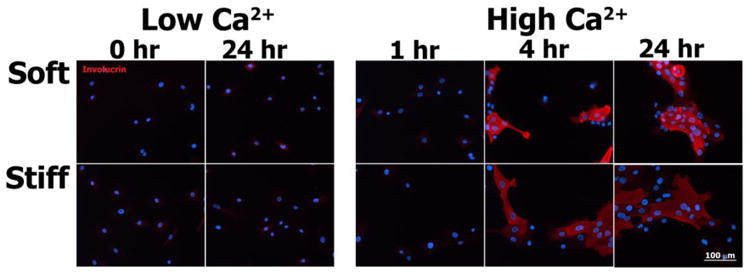
Immunofluorescence images of involucrin (red) and nuclei (blue) in normal human epidermal keratinocytes cultured for select times on soft and stiff PA gels exposed to both Low Ca2+ and High Ca2+ conditions.
4. Discussion
In qualitative agreement with Pelham's and Wang's seminal observations of the migratory behaviors of 3T3 fibroblasts and rat kidney epithelial cells (NRK-52E) (18), our experiments showed that normal human epidermal keratinocytes exhibit smaller spread areas but increased migration velocities when cultured on soft as opposed to stiff substrates. When compared to normal human keratinocytes cultured on type I collagen attached to an in vitro “observation chamber” (1.2 ± 0.7 μm/min; exact substrate material not specified), our observed migration velocities are strikingly similar in magnitude (28). In quantitative agreement with the experiments performed by Trappmann et al. (6), we observed similar keratinocyte spread areas on our nominal 1.2 kPa soft PA gels compared to their 0.5 kPa Pa gels. Additionally, the transient spindled morphologies we observed in keratinocytes cultured on our soft gels were also observed by Trappmann et al. in keratinocytes cultured on their 2 kPa gels.
Collectively, the effects of substrate stiffness on spread areas and migration velocities that we observed in our keratinocyte studies are in agreement with prior studies that utilized cells of both parenchymal and mesenchymal origin. Some have argued that these general observations can be attributed to the weak/unstable nature of focal contacts associated with cells cultured on soft substrates (18, 29). Interestingly, for fibroblasts, the apparent dependence on bulk substrate stiffness seems to disappear when cells are cultured on fibrous matrix (30). Trappmann et al. have reported a similar finding with cultured keratinocytes, proposing that cells respond to feedback from the mechanical tethering of individual near-field matrix fibers as opposed to any bulk mechanical property of the substrate (6). More recently, Wen et al. have reported that the differentiation of adipose-derived and bone marrow-derived stromal cells is regulated by matrix stiffness in a manner that is independent of protein tethering (31). Given the apparent discrepancies among these various studies, we pose that the mechanobiological mechanism by which keratinocytes sense and respond to perturbations in their mechanical environment remains an open question ripe for further investigation.
Although the migration rates of fully-formed keratinocyte sheets have been observed to be dependent on substrate stiffness (7), to the best of our knowledge, our work represents the first studies that have documented the effect of substrate stiffness on the migration velocities of individual human epidermal keratinocytes. Wang et al. cultured HaCaT epidermal cells (an immortalized human keratinocyte cells line) on polydimethylsiloxane (PDMS) substrates that were 16 kPa, 20 kPa, and 200 kPa in nominal stiffness. Using what is often referred to as a scratch assay, they found that a fully-formed keratinocyte sheet migrates to close an artificially created defect in the sheet at a faster rate when cultured on stiffer (200 kPa) versus softer substrates (16 kPa). In contrast, our study found that keratinocyte velocities were faster on soft (nominal E =1.2 kPa) as opposed to stiff (nominal E = 24 kPa) PA gels. Furthermore, other researchers have observed that the proliferation/growth of fully-formed epithelial sheets in vitro (Madin-Darby canine kidney epithelial cells) is effectively independent of substrate stiffness (12). These apparent contradictions can possibly be explained by more careful consideration of the collective number of cell-cell and cell-matrix contacts present, in addition to consideration of the biochemical milieu the keratinocytes are exposed to at the time the observations are made, i.e., it is possible that the effect of substrate stiffness depends on whether or not one assays (i) individual keratinocytes during their initial attempts at colony formation (nascent epithelial sheet formation) versus (ii) keratinocytes incorporated into a fully-developed epithelial sheet (associated with fully-formed cell-cell desmosomes and adherens junctions) versus (iii) keratinocytes within a fully-developed but physically damaged epithelial sheet surrounded by cytokines and other paracrine signals released from adjacent damaged cells.
As gleaned from our time-lapse DIC images, the process of colony formation involves a number of dynamic and interrelated mechanobiological phenomena that make precise quantification of keratinocyte behavior difficult: individual cells, couples, and colonies are moving both towards and away from each other via cell-matrix tractions imposed on their underlying substrate, all the while forming transient and sometimes permanent cell-cell junctions in an attempt to form a nascent epithelial sheet. To begin to quantify some of the collective behaviors that are more qualitatively apparent to the eye of the observer, we developed two ad hoc analyses, termed the distance rank (DR) and the radius of cooperativity (RC). Both DR and RC provide an indication of how close keratinocytes need to be to a forming colony in order to join that colony, and both metrics suggest that keratinocyte that keratinocytes cultured on soft PA gels form colonies in an increasingly cooperative process compared to the process of colony formation observed for keratinocytes cultured on stiff PA gels.
A cooperativity-like phenomenon has been qualitatively observed by other groups, specifically Guo et al. (32), where they observed the spontaneous formation of tissue-like “spheroids” in both fibroblasts and NRK-52E epithelial cells cultured on soft substrates (nominal E = 2.49 kPa). In a similar fashion, Reinhart-King et al. observed that individual endothelial cell migration becomes restricted when endothelial cells are cultured in close proximity to other cells on substrates with nominal stiffness ranging between 2.5 kPa and 5.5 kPa (33). With their migration velocities restricted, endothelial cells exhibit increasing cell-cell contact events that may represent a nidus for tissue formation. In their work, Rheinhart-King et al. postulated that this form of tissue genesis may arise via cell-cell mechanical communication that occurs through local substrate displacements.
The results of our study are also in agreement with the idea of cell-cell mechanical signaling generated via local substrate displacements, specifically, the enhanced cooperativity of nascent epithelial sheet formation that we observed in keratinocytes cultured on soft substrates (Fig 4). Under High Ca2+ conditions, keratinocyte colonies produced large substrate displacements, the magnitude of which increased temporally in correlation with the number of cells integrated into a given colony. Surprisingly, in comparing integrin expression between cells cultured on soft versus stiff substrates, we found a distinct difference in the expression of the β4 integrin subunit, specifically, the localization of β4 to the cell-matrix interface within keratinocytes positioned along the periphery of colonies on soft PA gels. In vivo, the α6β4 integrin (i.e., hemidesmosome) mechanically couples the keratin intermediate filament system to the basement membrane (27). In vitro, true ultrastructurally complete hemidesmosomes have not been demonstrated in primary keratinocyte cultures (27), and in our experiments, we did not perform any IF for co-staining of β4 integrin and keratin to see if these proteins also co-localized to the periphery of our cell colonies. However, recent work has suggested that α6β4 integrin also plays a role in the regulation of keratinocyte migration via signaling through Rac1 to the actin-severing protein cofilin present within the lamellipodia of a motile cell (34, 35). In other words, α6β4 integrins can interact (indirectly and possibly directly) with the microfilament network as opposed to being strictly confined to adynamic mechanical contacts with the keratin intermediate filament network. Thus, it is conceivable that the presence of β4 integrin in peripheral keratinocytes within colonies forming on soft gels is associated with the large substrate displacements generated by these colonies, though with respect to the results presented here, we can only speculate as to whether this association is one of correlation or causality.
It is important to note that presence of a soft substrate alone cannot account for the enhanced colony formation observed in our High Ca2+ experiments. If it did, then one might expect enhanced colony formation to occur in our Low Ca2+ control experiments, but this was not the case (Movie S1). We also considered whether the increase in calcium concentration associated with our High Ca2+ medium could in some way contribute to the differences in colony formation observed in our experiments via a direct effect on integrin function. Integrin binding is dependent on the presence of extracellular divalent cations, with preference for magnesium and manganese over calcium (36). Changes in the concentration of extracellular Mg2+ and Ca2+ have been shown to differentially influence β1 integrin-associated keratinocyte adhesion and migration on type I collagen, with calcium having a mild inhibitory effect at concentrations lower than 2 mM and a more prominent inhibitory effect at calcium concentrations greater than 2 mM (37, 38). Following the calcium switch to High Ca2+ medium, it is conceivable that the formation of cadherin-mediated cell-cell contacts occurs at the expense of diminished integrin functionality, as changes in cell-cell and cell-matrix contacts are both a cause and consequence of keratinocyte differentiation. Whatever role calcium-induced changes in integrin function might play in the process of keratinocyte colony formation, the keratinocytes cultured on both our soft and stiff gels would be affected equally. Thus, the observed differences in cooperativity should be due primarily to the effect of substrate stiffness.
Incorporating all of our observed experimental findings, we hypothesize that the enhanced cooperativity of colony formation (nascent keratinocyte sheet formation) observed in our soft gel experiments arises in the following fashion. First, increased calcium concentrations in our High Ca2+ experiments enable the formation of stronger cell-cell adhesive contacts (adherens junctions and desmosomes) that maintain intercellular adhesion within an evolving colony. Second, as cell-cell tension increases within an evolving colony, cell-substrate tractions along the perimeter of the colony are increased in order to maintain mechanical equilibrium. Third, local substrate displacements- associated with the localization of β4 integrin and its direct or indirect interactions with the microfilament network- develop at the periphery of the colony in response to the increased tractions exerted by the colony. Neighboring but unattached keratinocytes then sense local deformations in the substrate and preferentially migrate towards the colony (Fig. 4, Movie S7). Thus, by means of mechanical communication through deformations in the substrate, more and more keratinocytes are recruited to join the nascent epithelial sheet in a more directed manner that occurs on a stiff substrate. Whether the keratinocytes are responding directly to gradients in substrate tension, strain, or stiffness is unclear. With regard to the latter, although PA gels are generally regarded as linear elastic materials of constant stiffness, it has been reported by Boudou et al. that PA gels used for cell traction force microscopy can behave as nonlinear elastic materials, exhibiting a strain-stiffening response for substrate displacements of as little as 2 to 6 μm (39). Since the substrate displacements on the soft PA gels in High Ca2+ observed in this study were large (average of 19.4 ± 21.2 μm at t = 24 hours), it is conceivable that the keratinocytes on soft gels demonstrated enhanced cooperativity of colony formation as a result of a the formation of stiffness gradients in the substrate rather than displacement gradients. Such a mechanism would be consistent with reports of durotaxis observed in cells cultured in nonlinear fibrous gels (30, 40).
In closing, with regards to pathophysiological relevance, note that the stiffnesses of the PA gels used in this study are consistent with atomic force microscopy (AFM) measurements of the stiffness of the human papillary dermis, specifically, 0.82 kPa and 1.12 kPa (median elastic moduli) for specimens of papillary dermis extracted from breast and abdominal skin, respectively (41). These measurements provide a clearer picture of the substrate stiffnesses that keratinocytes might perceive in vivo, and they are substantially lower than values of elastic modulus reported from macroscopic tissue-level mechanical tests (42). Along similar lines, AFM measurements on wounded rat skin found that the elastic modulus of granulation tissue increased from 18.5 kPa at day 7 to 29.4 kPa at day 9 (43). Because the process of re-epithelialization during wound healing takes place on a bed of granulation tissue that changes its stiffness and biochemical composition as a function of time, we believe that keratinocyte colony formation (and hence nascent epithelial sheet development) is mediated, at least in part, by durotaxis occurring at the cellular level. Furthermore, the fibrous nature of granulation tissue and ECM likely extends the potential roles of durotaxis and mechanosensing across much larger distances than is observed on non-fibrous materials of comparable stiffness, such as PA gels (30, 40). If true, building from the results of our initial experiments, one can envision new wound care therapies that target keratinocyte mechanobiology with the goal of speeding-up the rate of re-epithelialization of chronic wounds.
5. Conclusion
As observed in our experiments, keratinocytes cultured on pepsin digested type I collagen coated soft PA gels exhibit (i) smaller spread contact areas, (ii) increased migration velocities, and (iii) increased rates of colony formation with more cells per colony than do keratinocytes cultured on stiff gels. Together with the differences observed in substrate displacements, distance rank (DR), and radius of cooperativity (RC), our findings are reflective of what we perceive as increasingly cooperative behavior of keratinocytes cultured on soft versus stiff gels during the process of colony formation, i.e., the observation that individual cells, couples, and colonies cultured on soft gels under High Ca2+ conditions seem to better coordinate their efforts to achieve local nascent epithelial sheet formation compared to the increasingly stochastic cell-cell contact events that lead to nascent sheet formation from similar collections of cells, couples, and colonies cultured on stiff substrates. Although more work is required to elucidate the specific mechanobiological mechanisms involved, we hypothesize that the differences in keratinocyte colony formation observed in our experiments are associated with an enhanced expression of β4 integrin along the periphery of colonies evolving on soft substrates which ultimately lead to increased cell-cell mechanical signaling generated via local substrate deformations.
Supplementary Material
Acknowledgments
Support for this project was provided by the National Institutes of Health (R03-AR063967) and the Roy J. Carver Charitable Trust (#14-4384). We thank Kelly Messingham for assistance with immunolabeling, and Janet Fairley, George Giudice, and Thomas Magin for insightful discussions on this work.
Footnotes
Conflicts of Interest: Hoda Zarkoob, Sandeep Bodduluri, Sailahari V. Ponnaluri, John C. Selby, and Edward A. Sander declare that they have no conflict of interest.
Ethical Standards: No human or animal studies or were carried out by the authors for this article.
References
- 1.Selby JC. Mechanobiology of Cell-Cell and Cell-Matrix Interactions. Springer; 2011. Mechanobiology of Epidermal Keratinocytes: Desmosomes, Hemidesmosomes, Keratin Intermediate Filaments, and Blistering Skin Diseases; pp. 169–210. [Google Scholar]
- 2.Martin P. Wound healing--aiming for perfect skin regeneration. Science. 1997;276(5309):75–81. doi: 10.1126/science.276.5309.75. [DOI] [PubMed] [Google Scholar]
- 3.Eming SA. Biology of Wound Healing. In: Bolognia JL, Jorizzo JL, Schaffer JV, editors. Dermatology. Third. Philadephia: Elsevier Saunders; 2012. [Google Scholar]
- 4.Evans ND, Oreffo RO, Healy E, Thurner PJ, Man YH. Epithelial mechanobiology, skin wound healing, and the stem cell niche. Journal of the mechanical behavior of biomedical materials. 2013;28:397–409. doi: 10.1016/j.jmbbm.2013.04.023. [DOI] [PubMed] [Google Scholar]
- 5.Mertz AF, Che Y, Banerjee S, Goldstein JM, Rosowski KA, Revilla SF, et al. Cadherin-based intercellular adhesions organize epithelial cell-matrix traction forces. Proceedings of the National Academy of Sciences of the United States of America. 2013;110(3):842–7. doi: 10.1073/pnas.1217279110. [DOI] [PMC free article] [PubMed] [Google Scholar]
- 6.Trappmann B, Gautrot JE, Connelly JT, Strange DG, Li Y, Oyen ML, et al. Extracellular-matrix tethering regulates stem-cell fate. Nature materials. 2012;11(7):642–9. doi: 10.1038/nmat3339. [DOI] [PubMed] [Google Scholar]
- 7.Wang Y, Wang G, Luo X, Qiu J, Tang C. Substrate stiffness regulates the proliferation, migration, and differentiation of epidermal cells. Burns. 2012;38(3):414–20. doi: 10.1016/j.burns.2011.09.002. [DOI] [PubMed] [Google Scholar]
- 8.Doyle AD, Wang FW, Matsumoto K, Yamada KM. One-dimensional topography underlies three-dimensional fibrillar cell migration. The Journal of cell biology. 2009;184(4):481–90. doi: 10.1083/jcb.200810041. [DOI] [PMC free article] [PubMed] [Google Scholar]
- 9.Watt FM, Jordan PW, O'Neill CH. Cell shape controls terminal differentiation of human epidermal keratinocytes. Proceedings of the National Academy of Sciences of the United States of America. 1988;85(15):5576–80. doi: 10.1073/pnas.85.15.5576. [DOI] [PMC free article] [PubMed] [Google Scholar]
- 10.Anon E, Serra-Picamal X, Hersen P, Gauthier NC, Sheetz MP, Trepat X, et al. Cell crawling mediates collective cell migration to close undamaged epithelial gaps. Proceedings of the National Academy of Sciences of the United States of America. 2012;109(27):10891–6. doi: 10.1073/pnas.1117814109. [DOI] [PMC free article] [PubMed] [Google Scholar]
- 11.Kim JH, Serra-Picamal X, Tambe DT, Zhou EH, Park CY, Sadati M, et al. Propulsion and navigation within the advancing monolayer sheet. Nature materials. 2013;12(9):856–63. doi: 10.1038/nmat3689. [DOI] [PMC free article] [PubMed] [Google Scholar]
- 12.Trepat X, Wasserman MR, Angelini TE, Millet E, Weitz DA, Butler JP, et al. Physical forces during collective cell migration. Nat Phys. 2009;5(6):426–30. [Google Scholar]
- 13.Kirsner RS, Marston WA, Snyder RJ, Lee TD, Cargill DI, Slade HB. Spray-applied cell therapy with human allogeneic fibroblasts and keratinocytes for the treatment of chronic venous leg ulcers: a phase 2, multicentre, double-blind, randomised, placebo-controlled trial. Lancet. 2012;380(9846):977–85. doi: 10.1016/S0140-6736(12)60644-8. [DOI] [PubMed] [Google Scholar]
- 14.Hunyadi J, Farkas B, Bertenyi C, Olah J, Dobozy A. Keratinocyte grafting: a new means of transplantation for full-thickness wounds. The Journal of dermatologic surgery and oncology. 1988;14(1):75–8. doi: 10.1111/j.1524-4725.1988.tb03343.x. [DOI] [PubMed] [Google Scholar]
- 15.Zamansky GB, Nguyen U, Chou IN. An immunofluorescence study of the calcium-induced coordinated reorganization of microfilaments, keratin intermediate filaments, and microtubules in cultured human epidermal keratinocytes. J Invest Dermatol. 1991;97(6):985–94. doi: 10.1111/1523-1747.ep12491899. [DOI] [PubMed] [Google Scholar]
- 16.Watt FM. Influence of cell shape and adhesiveness on stratification and terminal differentiation of human keratinocytes in culture. Journal of cell science Supplement. 1987;8:313–26. doi: 10.1242/jcs.1987.supplement_8.17. [DOI] [PubMed] [Google Scholar]
- 17.Leigh IM, Watt FM. The Keratinocyte Handbook. Cambridge England; New York, NY, USA: Cambridge University Press; 1994. The culture of human epidermal keratinocytes; pp. 43–51. [Google Scholar]
- 18.Pelham RJ, Jr, Wang Y. Cell locomotion and focal adhesions are regulated by substrate flexibility. Proceedings of the National Academy of Sciences of the United States of America. 1997;94(25):13661–5. doi: 10.1073/pnas.94.25.13661. [DOI] [PMC free article] [PubMed] [Google Scholar]
- 19.Cras J, Rowe-Taitt C, Nivens D, Ligler F. Comparison of chemical cleaning methods of glass in preparation for silanization. Biosensors and Bioelectronics. 1999;14(8):683–8. [Google Scholar]
- 20.Butler JP, Tolic-Norrelykke IM, Fabry B, Fredberg JJ. Traction fields, moments, and strain energy that cells exert on their surroundings. American journal of physiology Cell physiology. 2002;282(3):C595–605. doi: 10.1152/ajpcell.00270.2001. [DOI] [PubMed] [Google Scholar]
- 21.Aratyn-Schaus Y, Oakes PW, Stricker J, Winter SP, Gardel ML. Preparation of complaint matrices for quantifying cellular contraction. Journal of visualized experiments : JoVE. 2010;(46) doi: 10.3791/2173. [DOI] [PMC free article] [PubMed] [Google Scholar]
- 22.Raghupathy R, Witzenburg C, Lake SP, Sander EA, Barocas VH. Identification of regional mechanical anisotropy in soft tissue analogs. Journal of biomechanical engineering. 2011;133(9):091011. doi: 10.1115/1.4005170. [DOI] [PMC free article] [PubMed] [Google Scholar]
- 23.Chan SH, Võ DT, Nguyen TQ, editors. Acoustics Speech and Signal Processing (ICASSP), 2010 IEEE International Conference on. IEEE; 2010. Subpixel motion estimation without interpolation. [Google Scholar]
- 24.Tang X, Tofangchi A, Anand SV, Saif TA. A novel cell traction force microscopy to study multi-cellular system. PLoS computational biology. 2014;10(6):e1003631. doi: 10.1371/journal.pcbi.1003631. [DOI] [PMC free article] [PubMed] [Google Scholar]
- 25.Selby JC, Shannon MA. Mechanical response of a living human epidermal keratinocyte sheet as measured in a composite diaphragm inflation experiment. Biorheology. 2007;44(5-6):319–48. [PubMed] [Google Scholar]
- 26.Toyjanova J, Bar-Kochba E, Lopez-Fagundo C, Reichner J, Hoffman-Kim D, Franck C. High Resolution, Large Deformation 3D Traction Force Microscopy. PloS one. 2014;9(4) doi: 10.1371/journal.pone.0090976. [DOI] [PMC free article] [PubMed] [Google Scholar]
- 27.Tsuruta D, Hashimoto T, Hamill KJ, Jones JC. Hemidesmosomes and focal contact proteins: functions and cross-talk in keratinocytes, bullous diseases and wound healing. J Dermatol Sci. 2011;62(1):1–7. doi: 10.1016/j.jdermsci.2011.01.005. [DOI] [PMC free article] [PubMed] [Google Scholar]
- 28.Hartwig B, Borm B, Schneider H, Arin MJ, Kirfel G, Herzog V. Laminin-5-deficient human keratinocytes: defective adhesion results in a saltatory and inefficient mode of migration. Experimental cell research. 2007;313(8):1575–87. doi: 10.1016/j.yexcr.2007.02.003. [DOI] [PubMed] [Google Scholar]
- 29.Peyton SR, Putnam AJ. Extracellular matrix rigidity governs smooth muscle cell motility in a biphasic fashion. Journal of cellular physiology. 2005;204(1):198–209. doi: 10.1002/jcp.20274. [DOI] [PubMed] [Google Scholar]
- 30.Winer JP, Oake S, Janmey PA. Non-linear elasticity of extracellular matrices enables contractile cells to communicate local position and orientation. PloS one. 2009;4(7):e6382. doi: 10.1371/journal.pone.0006382. [DOI] [PMC free article] [PubMed] [Google Scholar]
- 31.Wen JH, Vincent LG, Fuhrmann A, Choi YS, Hribar KC, Taylor-Weiner H, et al. Interplay of matrix stiffness and protein tethering in stem cell differentiation. Nature materials. 2014;13(10):979–87. doi: 10.1038/nmat4051. [DOI] [PMC free article] [PubMed] [Google Scholar]
- 32.Guo WH, Frey MT, Burnham NA, Wang YL. Substrate rigidity regulates the formation and maintenance of tissues. Biophysical journal. 2006;90(6):2213–20. doi: 10.1529/biophysj.105.070144. [DOI] [PMC free article] [PubMed] [Google Scholar]
- 33.Reinhart-King CA, Dembo M, Hammer DA. Cell-cell mechanical communication through compliant substrates. Biophysical journal. 2008;95(12):6044–51. doi: 10.1529/biophysj.107.127662. [DOI] [PMC free article] [PubMed] [Google Scholar]
- 34.Hamill KJ, Hopkinson SB, DeBiase P, Jones JC. BPAG1e maintains keratinocyte polarity through beta4 integrin-mediated modulation of Rac1 and cofilin activities. Molecular biology of the cell. 2009;20(12):2954–62. doi: 10.1091/mbc.E09-01-0051. [DOI] [PMC free article] [PubMed] [Google Scholar]
- 35.Sehgal BU, DeBiase PJ, Matzno S, Chew TL, Claiborne JN, Hopkinson SB, et al. Integrin beta4 regulates migratory behavior of keratinocytes by determining laminin-332 organization. The Journal of biological chemistry. 2006;281(46):35487–98. doi: 10.1074/jbc.M606317200. [DOI] [PMC free article] [PubMed] [Google Scholar]
- 36.Lange TS, Kirchberg J, Bielinsky AK, Leuker A, Bank I, Ruzicka T, et al. Divalent cations (Mg2+, Ca2+) differentially influence the beta 1 integrin-mediated migration of human fibroblasts and keratinocytes to different extracellular matrix proteins. Experimental dermatology. 1995;4(3):130–7. doi: 10.1111/j.1600-0625.1995.tb00236.x. [DOI] [PubMed] [Google Scholar]
- 37.Lange TS, Bielinsky AK, Kirchberg K, Bank I, Herrmann K, Krieg T, et al. Mg2+ and Ca2+ differentially regulate beta 1 integrin-mediated adhesion of dermal fibroblasts and keratinocytes to various extracellular matrix proteins. Experimental cell research. 1994;214(1):381–8. doi: 10.1006/excr.1994.1271. [DOI] [PubMed] [Google Scholar]
- 38.Grzesiak JJ, Pierschbacher MD. Changes in the concentrations of extracellular Mg++ and Ca++ down-regulate E-cadherin and up-regulate alpha 2 beta 1 integrin function, activating keratinocyte migration on type I collagen. J Invest Dermatol. 1995;104(5):768–74. doi: 10.1111/1523-1747.ep12606983. [DOI] [PubMed] [Google Scholar]
- 39.Boudou T, Ohayon J, Picart C, Pettigrew RI, Tracqui P. Nonlinear elastic properties of polyacrylamide gels: implications for quantification of cellular forces. Biorheology. 2009;46(3):191–205. doi: 10.3233/BIR-2009-0540. [DOI] [PMC free article] [PubMed] [Google Scholar]
- 40.Rudnicki MS, Cirka HA, Aghvami M, Sander EA, Wen Q, Billiar KL. Nonlinear strain stiffening is not sufficient to explain how far cells can feel on fibrous protein gels. Biophysical journal. 2013;105(1):11–20. doi: 10.1016/j.bpj.2013.05.032. [DOI] [PMC free article] [PubMed] [Google Scholar]
- 41.Achterberg VF, Buscemi L, Diekmann H, Smith-Clerc J, Schwengler H, Meister JJ, et al. The nano-scale mechanical properties of the extracellular matrix regulate dermal fibroblast function. J Invest Dermatol. 2014;134(7):1862–72. doi: 10.1038/jid.2014.90. [DOI] [PubMed] [Google Scholar]
- 42.Ni Annaidh A, Bruyere K, Destrade M, Gilchrist MD, Ottenio M. Characterization of the anisotropic mechanical properties of excised human skin. Journal of the mechanical behavior of biomedical materials. 2012;5(1):139–48. doi: 10.1016/j.jmbbm.2011.08.016. [DOI] [PubMed] [Google Scholar]
- 43.Goffin JM, Pittet P, Csucs G, Lussi JW, Meister JJ, Hinz B. Focal adhesion size controls tension-dependent recruitment of alpha-smooth muscle actin to stress fibers. J Cell Biol. 2006;172(2):259–68. doi: 10.1083/jcb.200506179. [DOI] [PMC free article] [PubMed] [Google Scholar]
Associated Data
This section collects any data citations, data availability statements, or supplementary materials included in this article.