

Abstract
Objective
This study aims to examine the validity of the Framingham general cardiovascular disease (CVD) risk chart in a primary care setting.
Design
This is a 10-year retrospective cohort study.
Setting
A primary care clinic in a teaching hospital in Malaysia.
Participants
967 patients’ records were randomly selected from patients who were attending follow-up in the clinic.
Main outcome measures
Baseline demographic data, history of diabetes and smoking, blood pressure (BP), and serum lipids were captured from patient records in 1998. Each patient's Framingham CVD score was computed from these parameters. All atherosclerotic CVD events occurring between 1998 and 2007 were counted.
Results
In 1998, mean age was 57 years with 33.8% men, 6.1% smokers, 43.3% diabetics and 59.7% hypertensive. Median BP was 140/80 mm Hg and total cholesterol 6.0 mmol/L (1.3). The predicted median Framingham general CVD risk score for the study population was 21.5% (IQR 1.2–30.0) while the actual CVD events that occurred in the 10 years was 13.1% (127/967). The median CVD points for men was 30.0, giving them a CVD risk of more than 30%; for women it is 18.5, a CVD risk of 21.5%. Our study found that the Framingham general CVD risk score to have moderate discrimination with an area under the receiver operating characteristic curve (AUC) of 0.63. It also discriminates well for Malay (AUC 0.65, p=0.01), Chinese (AUC 0.60, p=0.03), and Indians (AUC 0.65, p=0.001). There was good calibration with Hosmer-Lemeshow test χ2=3.25, p=0.78.
Conclusions
Taking into account that this cohort of patients were already on treatment, the Framingham General CVD Risk Prediction Score predicts fairly accurately for men and overestimates somewhat for women. In the absence of local risk prediction charts, the Framingham general CVD risk prediction chart is a reasonable alternative for use in a multiethnic group in a primary care setting.
Strengths and limitations of this study.
The strength of our study is that it is done in a primary care setting where the cardiovascular disease (CVD) risk profiles are different from that in secondary care.
Another strength is that it examines the validity and applicability of the Framingham general CVD risk tool in a multiethnic primary care population.
Our sample size is large enough to give us a better picture of CVD risk of a multiethnic population in Asia where data about the use and applicability of any CVD risk prediction tool has not extensively been validated to particularly include non-fatal events.
Our study found the Framingham General CVD risk score to have a good calibration and hence, it can be used by all the three different ethnic groups.
However, most of our patients were already on treatment and this resulted in a seemingly overestimation of cardiovascular risk.
As this is a retrospective study, there will be missing data to some extent. However, we were able to compare the characteristics of those with missing data to those included in the analysis and found no clinical differences between them.
Introduction
Guidelines on management of cardiovascular (CV) diseases (CVDs) recommend assessing overall CV risk to determine the necessity of pharmacotherapy.1–9 To date, many CVD risk assessment tools have devised.10 The most well studied is the Framingham Coronary Heart Disease (CHD) risk prediction Chart.11 12 This tool has been validated in different populations and was found to overestimate risk particularly in women, the older age group, British men and European population and certain ethnicities with lower background risk of CVD, for example, the Chinese population.1 13–17
Furthermore, it has been criticised that the Framingham CHD risk score only predicts risk for fatal and non-fatal coronary events and does not take into account strokes as well as patients already receiving antihypertensive therapy, which is the case with many individuals.
Hence, the Framingham general CVD risk score tool for primary care was developed in 2008.18 This newer tool now includes strokes, heart failure and peripheral artery disease, and adjusts for patients already on antihypertensive therapy. However, this risk score chart tool has not been widely validated particularly in the communities with different races. Malaysia is a multiethnic country with a population of 30 million. The major ethnic group is the Malay (50.3%) followed by Chinese (21.7%), Indians (6.5%) and others (21.5%).19
Hence, our aim was to examine the validity of the Framingham general CVD in a multiethnic primary care population.
Materials and methods
Setting
This is a retrospective cohort study. We computed the Framingham general CVD risk score retrospectively in a randomly selected cohort of patients registered with an urban primary care clinic. This selected sample consisted of adult patients aged 30 years and older, who were free of any cardiovascular events at baseline and who had complete data needed to compute their overall CV risk. The study was conducted in an outpatient clinic of an academic teaching hospital.
Participants
There were 1536 patients in our original cohort. We excluded 563 patients as they did not have all the variables needed to calculate the Framingham general CVD risk score. Another six patients were excluded as we could not ascertain their CVD status by the end of 2007. Thus, a total of 967 patients (62.9%) were eligible for analysis (figure 1). Of these, 912 (94.3%) patients completed 10 years follow-up and only 55 (5.7%) patients defaulted follow-up. Of these, 26 (2.7%) had died with 19 (73%) deaths from non-CVD causes.
Figure 1.
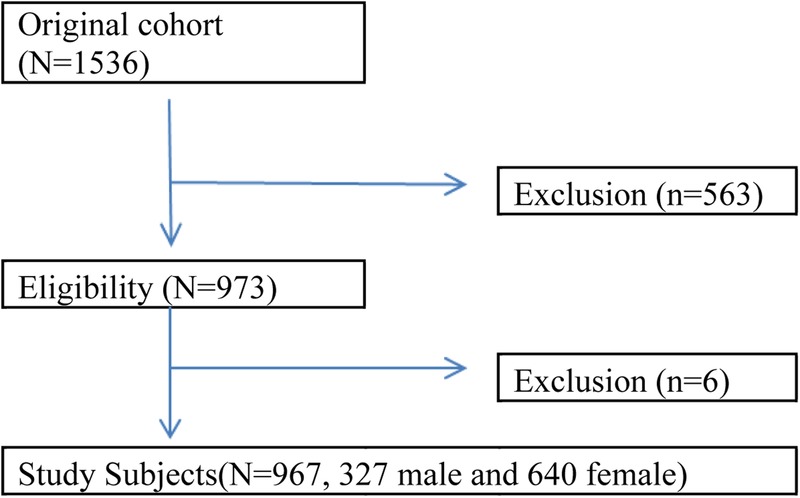
Flow chart of patients included in the analysis.
Inclusion criteria
All adult patients 30 years and older, without any cardiovascular events and with documented blood pressure (BP) readings whether they were on or not on treatment, total cholesterol, high-density lipoprotein (HDL) cholesterol, smoking status, and presence or absence of diabetes mellitus (DM) were eligible for this study. These parameters were needed to compute each individual's general CVD risk level.
Design
This sample was randomly selected using a computer-generated number based on the patient's unique registration number with the clinic. All patient records were in paper form.
Data collection
We extracted the patients’ sociodemographic data and clinical information based on the first entry in 1998 from their records manually, according to a predetermined proforma (clinical report form). Use of hypoglycaemic and lipid-lowering agents were also captured. Using age, SBP (systolic BP; treated or not treated) total cholesterol, HDL cholesterol levels, smoking and diabetes status, we computed each individual's general CVD risk score.
CVD events, namely, fatal and non-fatal CHD, fatal and non-fatal strokes, heart failure and peripheral artery disease were also captured from the records. For those who did not complete their subsequent 10-year follow-up at our clinic (n=24), we traced and examined the case records from the main hospital to determine their CVD outcome. For those patients who did not complete their follow-up in our clinic, we contacted them individually (n=31) to ascertain their CVD status and for any events fatal or non-fatal. Each CVD event was counted as one event in individuals who had more than one event during the 10-year follow-up. We further categorised the 10-year CVD risk as low (<10% 10-year CVD risk), medium (10–20% CVD risk), or high >20% CVD risk.20
Blood pressure (BP) was measured by our attending doctor using a mercury sphygmomanometer as part of the daily routine clinical practice. Diagnosis of hypertension was made in accordance with standard recommendations.7 Target control BP is defined as BP<140/90 mm Hg for patients without DM and <130/80 mm Hg for patients with DM. DM is defined as documented by the attending physician or the use of hypoglycaemic agents or both. Smokers were defined if they were still smoking. Non-smokers were those who never smoked or currently not smoking regardless of when they had stopped smoking. Total cholesterol, low-density lipoprotein (LDL) and HDL cholesterol were also collected. All blood tests were performed in our teaching hospital's laboratory, which is certified by the Royal College of Pathologists of Australasia standards.
Statistical analysis
All statistical analysis was carried out using the Statistical Package for Social Sciences (SPSS V.21). Continuous data are described with mean and SD if the distribution is normal. When the data is a skewed distribution, median and IQR (25–75th centile) are used. Categorical data are reported as proportions (percentage). The χ2 test (χ2) or Fisher exact tests were used for the categorical or dichotomous variables.
Discrimination
Discrimination is defined as the ability of the risk prediction model in distinguishing patients who suffered from a CVD event from those who do not use an overall c index. The c index is analogous to the area under the receiver operating characteristic curve (AUC). Discrimination is defined as good when c index is closer to 1, whereas a value of 0.5 implies that the risk score tool is no better than chance.21 A value of 0.75 is considered as good discrimination. Values between 0.51 and 0.74 are considered moderate and ≤0.5 as poor.22
Calibration
Calibration was used to assess if the observed 10-year CVD events differed significantly from the predicted CVD events.8 The calibration of the Framingham general CVD risk score was determined using Hosmer-Lemeshow test.23 A χ2 value of greater than 20 or a p value of less than 0.05 indicates poor calibration.
Results
A total of 967 of 1536 patient records from 1998 (baseline) were entered into our analysis.
Table 1 shows the demographic data of our cohort. Our study population was made up of three main ethnic groups, namely, the Chinese (45.4%), Malays (23.3%) and Indians (30.2%). The mean age was 56.9 (9.9) years and two-third (66.2%) were females. At baseline in 1998, over half (59.7%) had hypertension, less than half (43.3%) had diabetes and less than 10% (6.1%) were current smokers, 80.9% (n=339) of the patients with DM were receiving treatment with either oral hypoglycaemic agents and/or insulin. The mean SBP was 140.7±18.6 mm Hg and more than half (59.7%) of them were on antihypertensive agents. However, only 9.8% of the population (n=95) received statin therapy in 1998. We also compared the baseline characteristics for those who were entered into our analysis to the patients who were excluded. Basically, there were no significant differences between their baseline characteristics except for the smoking status and statin use.
Table 1.
Comparison of CV risk factors between study population and excluded patients as well as changes in CV risk factors in 1998 and 2007
| Study population | Excluded population | p Value | 2007 | |
|---|---|---|---|---|
| (n=973) | (n=563) | |||
| Age, year (mean) | 56.9±9.9 | 55.8±10.4 | 0.06 | 66.9±9.9 |
| Sex, female (n, %) | 640 (66.2) | 362 (64.3) | 0.45 | 640 (66.2) |
| Ethnicity (n, %) | 0.16 | |||
| Malay | 225 (23.3) | 155 (27.5) | 225 (23.3) | |
| Chinese | 438 (45.4) | 221 (39.3) | 438 (45.4) | |
| Indian | 291 (30.2) | 180 (32.0) | 291 (30.2) | |
| Others | 13 (1.2) | 7 (1.2) | 13 (1.2) | |
| DM (n, %) | 419 (43.3) | 260 (46.3) | 0.28 | 556 (57.5) |
| HbA1c, % (mean) | 7.8±1.9 | 7.9±1.9 | 0.28 | 7.5±1.7 |
| DM controlled with HbA1c ≤6.5% (n, %) | 113 (11.6) | 64 (11.4) | 0.89 | 168 (17.4) |
| Systolic BP, mm Hg (mean) | 140.7±18.6 | 139.0±19.7 | 0.22 | 134.9±16.5 |
| Use of antihypertensive agents (n, %) | 577 (59.7) | 308 (54.7) | 0.09 | 791 (81.8) |
| RAS blocker use (n, %) | 71 (7.3) | 27 (4.8) | 0.05 | 465 (48.1) |
| Total cholesterol, mmol/L (mean) | 6.1±1.1 | 5.8±1.1 | 0.06 | 4.9±1.0 |
| HDL cholesterol, mmol/L (mean) | 1.2±0.4 | 1.4±0.2 | 0.49 | 1.3±0.3 |
| LDL cholesterol, mmol/L (mean) | 3.0±0.8 | |||
| Statin use in 1998 (n, %) | 95 (9.8) | 32 (5.7) | 0.005 | 608 (62.9) |
| Smoker (n, %) | 59 (6.1) | 47 (8.3) | <0.001 | 59 (6.1) |
BP, blood pressure; CV, cardiovascular; DM, diabetes mellitus; HbA1c, glycated haemoglobin; HDL, high-density lipoprotein; LDL, low-density lipoprotein; RAS, renin-angiotensin system.
Table 1 also demonstrates the change in CVD risk factors between baseline and at the end of 10 years. In spite of the increase in the prevalence of diabetes from 43.3% to 46.3%, glycated haemoglobin (HbA1c) control actually improved from a mean of 7.8% to 7.5%. The mean SBP was reduced by 5.8 mm Hg, from 140.7 to 134.9 mm Hg. The control rate for BP improved from 41.3% to 55.6%. There was an increase in the use of renin-angiotensin system (RAS) blockers from 7.3% to 48.1%. The number of patients receiving statin increased significantly from 9.8% to 62.9% in 2007. There was also improvement in the lipid profile of patients at the end of 10 years compared with baseline. Mean total cholesterol was reduced from 6.1 to 4.9 mmol/L, while the mean HDL increased from 1.2 to 1.3 mmol/L.
Table 2 compares CVD risk factors at baseline and events rate at the end of 10 years in males and females. Generally, males had higher CV risk profiles than females. They were older and more of them were smokers; they had poorer control of BP and lipid profiles, but had a slighter better glucose profile. The CHD events were twice more common in males (13.5%) than in females (6.4%). Similarly, strokes were higher in males (6.1%) than in females (3.1%). In total, six CVD events were fatal in males and only one fatal in females.
Table 2.
Comparison CV risk factors in 1998 and events at the end of 10 years according to gender
| Male | Female | p Value | |
|---|---|---|---|
| (N=327) | (N=640) | ||
| Age, year (mean) | 57.7 (10.1) | 56.5 (9.7) | 0.07 |
| Hypertension | 217 (66.4) | 360 (56.3) | 0.002 |
| Systolic BP, mm Hg (mean) | 142.3 (17.6) | 139.9 (19.1) | 0.07 |
| Diastolic BP, mm Hg (mean) | 87.6 (10.4) | 83.3 (9.5) | <0.001 |
| BP control rate (N, %) | 22 (25.0)) | 66 (75.0) | <0.001 |
| Total cholesterol, mmol/L (mean) | 5.8 (1.1) | 6.2 (1.1) | <0.001 |
| HDL cholesterol, mmol/L (mean) | 1.1 (0.4) | 1.3 (0.3) | <0.001 |
| Triglyceride, mmol/L (mean) | 1.9 (1.0) | 1.6 (0.9) | <0.001 |
| LDL cholesterol, mmol/L (mean) | 3.4±0.9 | 3.8±1.1 | 0.04 |
| LDL cholesterol <2.6%, mmol/L (N, %) | 29 (46.8) | 33 (53.2)) | 0.03 |
| Smoking (N, %) | 51 (15.6) | 8 (1.3) | <0.001 |
| Diabetes | 143 (43.7) | 276 (43.1) | 0.89 |
| HbA1c % (mean) | 7.5 (1.6) | 7.9 (1.9) | 0.03 |
| HbA1c %≤6.5% (N, %) | 40 (12.2) | 71 (11.1) | 0.59 |
| Body mass index, kg/m2 (mean) | 26.6 (4.3) | 26.7 (4.9) | 0.73 |
| Events N (%) | Male (N=327) | Female (N=640) |
|
| n (%) | n (%) | ||
| Coronary heart disease, N=85 (8.8%) | 44 (13.5) | 41 (6.4) | <0.001 |
| Fatal myocardial infarction | 2 (0.6) | 1 (0.2) | 0.23 |
| Non-fatal myocardial infarction | 3 (0.9) | 4 (0.6) | 0.61 |
| New angina | 39 (11.9) | 36 (5.6) | 0.001 |
| Heart failure, N=7 (0.7%) | 1 (0.3) | 6 (0.9) | 0.27 |
| Cerebral vascular event, N=41 (4.2%) | 20 (6.1) | 20 (3.1) | 0.03 |
| Fatal stroke | 4 (1.2) | 0 (0.0) | 0.005 |
| Non-fatal stroke | 17 (5.2) | 20 (3.1) | 0.11 |
| Peripheral vascular disease N=0 (0%) | 0 (0.0) | 0 (0.0) | – |
BP, blood pressure; CV, cardiovascular; HbA1c, glycated haemoglobin; HDL, high-density lipoprotein; LDL, low-density lipoprotein.
Table 3 shows the risk categories of Framingham general CVD risk score and the CVD events that occurred. The median Framingham general CVD risk score for the study population was 21.1% (IQR 1.2–30.0%) with a 95% CI of 19.9% to 21.1%. The actual number of CVD events that occurred in the 10 years was 127 (13.1%), while the predicted number was 204 (21.1%). In males, their median risk score was 30.0% (95% CI 24.9% to 26.4%), while the events that occurred were 62 (19%). In females, their median risk score was 18.5% (95% CI 24.9% to 26.4%) while the events that occurred were 65 (10.2%).
Table 3.
Comparison of risk categories of Framingham general cardiovascular disease (CVD) risk score and CVD events in a 10-year interval (1998–2007)
| Framingham general CVD risk score in 1998, % | Total, N | Predicted CVD events (n, %) | Observed CVD event (n, %) | |
|---|---|---|---|---|
| All adults | ||||
| Median score: 21.1% | 967 | 204 (21.1) | 127 (13.1) | <0.001 |
| <10% | 148 | 9 (6.3) | 9 (6.1) | |
| 10–20% | 292 | 40 (13.7) | 25 (8.6) | |
| >20% | 527 | 158 (30.0) | 93 (17.6) | |
| Male | ||||
| Median score: 30.0% | 327 | 98 (30.0) | 62 (19.0) | 0.003 |
| <10% | 12 | 1 (6.3) | 1 (8.3) | |
| 10–20% | 56 | 9 (15.4) | 2 (3.6) | |
| >20% | 259 | 74 (28.7) | 59 (22.8) | |
| Female | ||||
| Median score: 18.5% | 640 | 118 (18.5) | 65 (10.2) | 0.098 |
| <10% | 136 | 9 (6.3) | 8 (5.9) | |
| 10–20% | 236 | 34 (14.4) | 23 (9.7) | |
| >20% | 268 | 72 (27.0) | 34 (12.7) | |
The number of events occurring in the low-risk group, in men and women, were consistent with the number predicted. In the medium risk group, the risk score tool overpredicted risk in men and women, but more so for men. In the high-risk group of men, the prediction of CVD events is consistent with the actual events that occurred. However, in females with high risk, the risk score tool overpredicted the CVD risk.
Table 4 shows the risk categories of Framingham general CVD risk score and medications used in a 10-year interval (1998–2007). Overall, the use of medications for CVDs was highest in the high-risk group in men and women at baseline. Nearly three-quarters of men and women in the high-risk group were already receiving antihypertensive at baseline. Medication use increased across all risk categories in men and women over 10 years; the greatest increase in use was the use of antihypertensive in females with medium risk (increment of 34%), and use of antilipid agents by females in high-risk groups (increment of 70%).
Table 4.
Comparison of risk categories of Framingham general CVD risk score and medications used in a 10-year interval (1998–2007)
| Sex | Framingham: CVD risk category in 1998 (%) | Anti-HPT agents |
Antilipid agents |
Hypoglycaemic agents |
|||
|---|---|---|---|---|---|---|---|
| (N, %) |
(N, %) |
(N, %) |
|||||
| 1998 | 2007 | 1998 | 2007 | 1998 | 2007 | ||
| Male (N=327) | Low risk score <10 | 4 (33) | 8 (80) | 1 (8) | 4 (40) | 6 (50) | 5 (50) |
| Medium risk score 10–20 | 29 (52) | 43 (78) | 5 (9) | 27 (49) | 19 (34) | 23 (43) | |
| High risk Score >20 | 184 (71) | 224 (94) | 19 (7) | 145 (60) | 143 (55) | 168 (70) | |
| Female (N=640) | Low risk score <10 | 45 (33) | 85 (66) | 17 (13) | 78 (60) | 59 (44) | 57 (44) |
| Medium risk score 10–20 | 120 (51) | 193 (85) | 29 (12) | 158 (69) | 112 (48) | 135 (59) | |
| High risk score >20 | 195 (73) | 238 (96) | 24 (9) | 196 (79) | 160 (60) | 187 (75) | |
CVD, cardiovascular disease; HPT, hypertensive.
The AUC for Framingham general CVD risk score was 0.63, showing moderate discrimination as seen in figure 2. The calibration for Framingham general CVD risk score was good as the Hosmer-Lemeshow test result was χ2=3.25, p=0.78.
Figure 2.
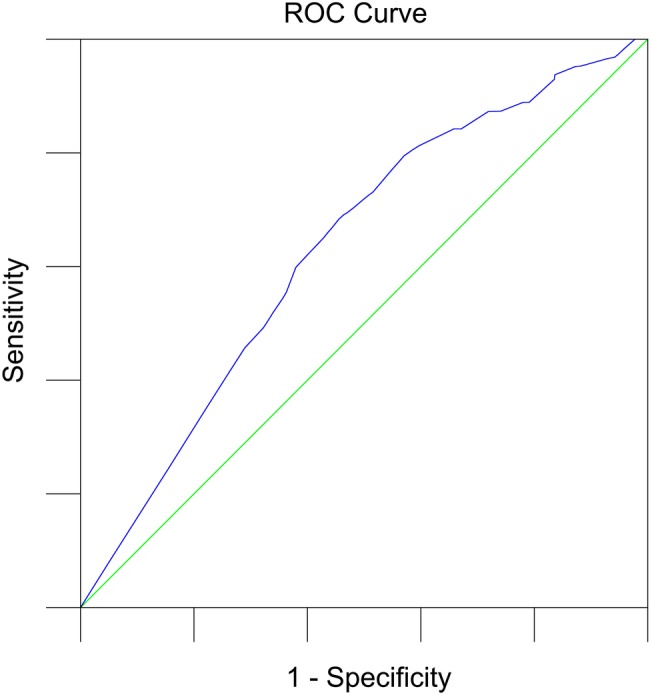
Receiver operating characteristic (ROC) and area under the curve for Framingham general cardiovascular disease risk score.
Table 5 shows the comparison between Framingham general CVD risk score and CVD events according to ethnicity. The Framingham general CVD risk score discriminates moderately well for Malay race (AUC 0.65, p=0.01), Chinese (AUC 0.60, p=0.03) and Indians (AUC 0.65, p=0.001). Males (AUC 0.63, p=0.002) seem to have a better discrimination index than females (AUC 0.58, p=0.04).
Table 5.
Comparison Framingham general CVD risk score and CVD events according to ethnicity and gender
| Framingham general CVD risk score (%) | CVD event |
AUC (95% CI) | p Value | ||
|---|---|---|---|---|---|
| Observed | Predicted | ||||
| N (%) | N (%) | ||||
| Overall (N=967) | 21.1 | 127 (13.1) | 204 (21.1) | 0. 63 (0.58 to 0.68) | <0.001 |
| Malay (N=225) | 18.5 | 26 (11.6) | 42 (18.5) | 0. 65 (0.53 to 0.77) | 0.014 |
| Chinese (N=438) | 23.2 | 45 (10.3) | 102 (23.2) | 0. 60 (0.52 to 0.68) | 0.027 |
| Indian (N=291) | 21.5 | 54 (18.6) | 63 (21.5) | 0. 65 (0.57 to 0.73) | 0.001 |
| Male (N=327) | 30.0 | 62 (19.0) | 98 (30.0) | 0.63 (0.56 to 0.70) | 0.002 |
| Female (N=640) | 18.5 | 65 (10.2) | 118 (18.5) | 0.58 (0.51 to 0.65) | 0.04 |
AUC, area under the receiver operating characteristic curve; CVD, cardiovascular disease.
Discussion
Our study shows the Framingham general cardiovascular risk score tool to have moderate discrimination and good calibration in an Asian population. These findings are not surprising as our study cohort are actually patients from a clinic and not subjects in the community. Hence, not unexpectedly, the overall CVD risk profile of our cohort is already high before CVD events have occurred, with the majority of them having underlying diabetes and/or hypertension. Therefore, a clustering of patients with higher risk and fewer patients with lower risk explain our finding of only moderate discrimination. Perhaps this risk prediction model may give a better discrimination in a general population of subjects, with a wider range of CV risk. Similarly, the overall CVD risk as predicted by the Framingham general CVD risk score tool for our cohort of primary care patients, was high in males and medium in females. This is again not a surprising finding as males in our cohort generally had higher CVD risk profiles (poorer BP and LDL<2.6%). Conseqeuently, they also had more CVD events and higher mortality rates. Thus, the Framingham CVD risk tool helps to identify appropriately patients at high risk where more needs to be done to reduce their risk . A recent study validated the Framingham cardiovascular risk score in Tehran, a Middle Eastern population, and found it also works very well.24
Inspite of the Framingham risk score seemingly overpredicting CVD risk to some extent, we feel that it is appropriate for use in our cohort. This is because the prediction is accurate for both men and women with low risk and for men with high risk as the predicted and the observed risk score belong to the same category of risk, that is, when the predicted risk is high, the observed risk is also high. In fact, one could argue that the tool underestimates risk as the majority of high-risk patients were already receiving one or another medication for the CVD; hence, their risk is expected to be reduced.
Our study found in general that this new risk tool overestimated risk in women. This is consistent with findings in the other studies which used other risk tools.1 13–17 While this appears as an overestimation, this may not be the case. It could be because of the increase in use of antihypertensive agents which would have lowered their risk. For example, a great increase in the use of anti-hypertensive agents was seen over the 10 years of follow-up.25 Similarly, while use of antihypertensive increased across all risk categories, the greatest increase was seen in both men and women with medium risk. Furthermore, at the end of 10 years, the achieved mean BP was lower and the control rate of BP higher in the medium risk-group compared to the high-risk group. The greater use of medication and better control of BP could have led to a greater reduction in CV events and hence, this lead to what appears to be like an overestimation of risk.
Our present study has several strengths and few limitations. First, the strength of our study is that it is done in the primary care setting where the CVD risk profiles is different from that in secondary care. Another strength of this study is that it examines the validity and applicability of the Framingham general CVD risk tool in a multiethnic primary care population. Second, our sample size is large enough to give us a better picture of CVD risk of a multiethnic population in Asia, where data about the use and applicability of any CVD risk prediction tool is lacking. Our study found that it did have a good fit and good calibration to be used by all the three different ethnic groups. Although it seems to be apparently overestimating risk, it must be remembered that this could be due to the treatment effect. Use of such a tool is of particular importance in the light of limited resources and the rapidly increasing CVD burden in the region as it can help identify those most at risk; these need to be treated in order to reduce their risk.
A limitation of our study is that the use of CV risk prediction tools are meant to be used to estimate overall CV risk in order to decide on treatment. Most of our patients were already on treatment and that would result in an overestimation of risk in most situations. However, based on current clinical practice, it would be unethical to do a study where patients at risk are not treated in order to derive a risk tool without treatment being on board. As this is a retrospective study, there will be missing data to some extent. However, we were able to compare the characteristics of those with missing data (and hence excluded from the analysis) to those included in the analysis and found no major clinical differences between them, suggesting there was no substantial bias.
Conclusions
The Framingham general CVD risk prediction tool is valid for use in primary care population. In the absence of local risk prediction tools, the Framingham CVD risk tool can be used as a surrogate to stratify risk and hence determine the indication for pharmacotherapy. Furthermore this Framingham general CVD risk prediction tool which is meant for use in primary care provides a good fit for use in a multiethnic population in Asia.
Acknowledgments
The author would like to acknowledge Department of Primary Care at the University of Malaya for providing the support during the data collection.
Footnotes
Contributors: YCC and SYWG contributed to the conceptualisation of the paper, data entry and writing of the manuscript. SMC, KC and HML contributed to the data analysis and writing of the manuscript. All the authors read and approved the final manuscript.
Funding: University of Malaya funded the research (UMRG 116/09HTM).
Competing interests: None declared.
Ethics approval: Ethics Committee of University of Malaya.
Provenance and peer review: Not commissioned; externally peer reviewed.
Data sharing statement: The data is deposited under the website of https://mynotebook.labarchives.com/, an open access repository under name of manuscript and the DOI link is 10.6070/H48W3B96.
References
- 1.Chia YC. Review of tools of cardiovascular disease risk stratification: interpretation, customisation and application in clinical practice. Singapore Med J 2011;52:116–23. [PubMed] [Google Scholar]
- 2.Jackson R, Lawes CM, Bennett DA et al. Treatment with drugs to lower blood pressure and blood cholesterol based on an individual's absolute cardiovascular risk. Lancet 2005;365:434–41. 10.1016/S0140-6736(05)17833-7 [DOI] [PubMed] [Google Scholar]
- 3.British Cardiac Society; British Hypertension Society; Diabetes UK; HEART UK; Primary Care Cardiovascular Society; Stroke Association. JBS 2: Joint British Societies’ guidelines on prevention of cardiovascular disease in clinical practice. Heart 2005;91(Suppl 5):v1–52. 10.1136/hrt.2005.079988 [DOI] [PMC free article] [PubMed] [Google Scholar]
- 4.Graham I, Atar D, Borch-Johnsen K et al. European guidelines on cardiovascular disease prevention in clinical practice: executive summary Fourth Joint Task Force of the European Society of Cardiology and Other Societies on Cardiovascular Disease Prevention in Clinical Practice. Eur Heart J 2007;28:2375–414. 10.1093/eurheartj/ehm316 [DOI] [PubMed] [Google Scholar]
- 5.Expert Panel on Detection, Evaluation, and Treatment of High Blood Cholesterol in Adults. Executive summary of the third report of the National Cholesterol Education Program (NCEP) expert panel on Detection, Evaluation, and Treatment of high blood cholesterol in adults (Adult Treatment Panel III). JAMA 2001;285:2486–97. 10.1001/jama.285.19.2486 [DOI] [PubMed] [Google Scholar]
- 6.Hippisley-Cox J, Coupland C, Vinogradova Y et al. Derivation and validation of QRISK, a new cardiovascular disease risk score for the United Kingdom: prospective open cohort study. BMJ 2007;335:136 10.1136/bmj.39261.471806.55 [DOI] [PMC free article] [PubMed] [Google Scholar]
- 7.Assmann G, Cullen P, Schulte H. Simple scoring scheme for calculating the risk of acute coronary events based on the 10-year follow-up of the prospective cardiovascular Münster (PROCAM) study. Circulation 2002;105:310–15. 10.1161/hc0302.102575 [DOI] [PubMed] [Google Scholar]
- 8.Woodward M, Brindle P, Tunstall-Pedoe H. Adding social deprivation and family history to cardiovascular risk assessment: the ASSIGN score from the Scottish Heart Health Extended Cohort (SHHEC). Heart 2007;93:172–6. 10.1136/hrt.2006.108167 [DOI] [PMC free article] [PubMed] [Google Scholar]
- 9.Conroy RM, Pyörälä K, Fitzgerald AP et al. Estimation ten-year risk of fatal cardiovascular disease in Europe: the SCORE project. Eur Heart J 2003;24:987–1003. 10.1016/S0195-668X(03)00114-3 [DOI] [PubMed] [Google Scholar]
- 10.Lloyd-Jones DM. Cardiovascular risk prediction basic concepts, current status, and future directions. Circulation 2010;121:1768–77. 10.1161/CIRCULATIONAHA.109.849166 [DOI] [PubMed] [Google Scholar]
- 11.Wilson PW, D'Agostino RB, Levy D et al. Prediction of coronary heart disease using risk factor categories. Circulation 1998;97: 1837–47. 10.1161/01.CIR.97.18.1837 [DOI] [PubMed] [Google Scholar]
- 12.Framingham Heart Study. 2014. https://www.framinghamheartstudy.org/risk-functions/coronary-heart-disease/10-year-risk.php (accessed 18 Nov 2014).
- 13.Liu J, Hong Y, D'Agostino RB Sr et al. Predictive value for the Chinese population of the Framingham CHD risk assessment tool compared with the Chinese Multi-Provincial Cohort Study. JAMA 2004;291:2591–9. 10.1001/jama.291.21.2591 [DOI] [PubMed] [Google Scholar]
- 14.Laurier D, Chau NP, Cazelles B et al. Estimation of CHD risk in a French working population using a modified Framingham model. J Clin Epidemiol 1994;47:1353–64. 10.1016/0895-4356(94)90079-5 [DOI] [PubMed] [Google Scholar]
- 15.Brindle P, Jonathan E, Lampe F et al. Predictive accuracy of the Framingham coronary risk score in British men: prospective cohort study. BMJ 2003;327:1267 10.1136/bmj.327.7426.1267 [DOI] [PMC free article] [PubMed] [Google Scholar]
- 16.Menotti A, Lanti M, Puddu P et al. Coronary heart disease incidence in northern and southern European populations: a reanalysis of the seven countries study for a European coronary risk chart. Heart 2000;84:238–44. 10.1136/heart.84.3.238 [DOI] [PMC free article] [PubMed] [Google Scholar]
- 17.Koller MT, Steyerberg EW, Wolbers M et al. Validity of the Framingham point scores in the elderly: results from the Rotterdam study. Am Heart J 2007;154:87–93. 10.1016/j.ahj.2007.03.022 [DOI] [PubMed] [Google Scholar]
- 18.D'Agostino RB Sr, Vasan RS, Pencina MJ et al. General cardiovascular risk profile for use in primary care the Framingham Heart Study. Circulation 2008;117:743–53. 10.1161/CIRCULATIONAHA.107.699579 [DOI] [PubMed] [Google Scholar]
- 19.Department of Statistics Malaysia. Population quick Info: current population estimate by ethnic group, Malaysia. http://statistics.gov.my/portal/index.php?option=com_content&id=471:population-finder&Itemid=111&lang=en (accessed 13 Feb 2015).
- 20.Chin CY, Pengal S. Cardiovascular disease risk in a semirural community in Malaysia. Asia Pac J Public Health 2009;21:410–20. 10.1177/1010539509343973 [DOI] [PubMed] [Google Scholar]
- 21.Vergouwe Y, Steyerberg EW, Eijkemans MJ et al. Validity of prognostic models: when is a model clinically useful? Semin Urol Oncol 2002;20:96–107. 10.1053/suro.2002.32521 [DOI] [PubMed] [Google Scholar]
- 22.Morris DE, Pepe MS, Barlow WE. Contrasting two frameworks for ROC analysis of ordinal ratings. Med Decis Making 2010;30:484–98. 10.1177/0272989X09357477 [DOI] [PMC free article] [PubMed] [Google Scholar]
- 23.Lemeshow S, Hosmer DW Jr. A review of goodness of fit statistics for use in the development of logistic regression models. Am J Epidemiol 1982;115:92–106. [DOI] [PubMed] [Google Scholar]
- 24.Khalili D, Hadaegh F, Soori H et al. Clinical usefulness of the Framingham cardiovascular risk profile beyond its statistical performance: the Tehran Lipid and Glucose Study. Am J Epidemiol 2012;176:177–86. 10.1093/aje/kws204 [DOI] [PubMed] [Google Scholar]
- 25.Chin CY, Mooi VLKCS. Antihypertensive prescribing pattern and blood pressure control among hypertensive patients over a ten year period in a primary care setting in Malaysia. Life Sci J 2013;10:2031–5. [Google Scholar]