Abstract
Study Objectives:
Sleep can affect quality of life (QOL). We examined the association between self-reported sleep time and QOL independent of perceived health status and depressive disorder using the EuroQol-5 Dimension (EQ-5D) and a visual analog scale (VAS).
Methods:
We used the nationwide cross-sectional survey data of 28,178 subjects from the Korea National Health and Nutrition Examination Survey (KNHANES) IV–V. Self-reported sleep time was assessed by average hours of sleep per day. QOL was measured using the EQ-5D and VAS. A generalized additive model and multiple linear regression analysis were used to estimate the effect of sleep time on the QOL while adjusting for potential confounding variables.
Results:
We found a significant inverted U-shaped relationship between sleep time and QOL using both the EQ-5D and VAS indices. Compared with subjects who slept 7 h/day, Korean men whose sleep time was very short (≤ 4 h/ day) or very long (≥ 10 h/day) had substantially worse QOL (−3.125 in EQ-5D, p < 0.001 and −4.387 on the VAS, p = 0.000 for ≤ 4 h/day; −1.763 in EQ-5D, p = 0.001 and −1.944 on the VAS for ≥ 10 h/day, all p = 0.038). A similar inverted U-shape was observed between sleep time and QOL in Korean women.
Conclusions:
Inappropriate sleep time (either short or long) in both men and women was significantly associated with lower QOL. In particular, such an association was more apparent among persons whose perceived health status was poor.
Citation:
Kim JH, Park EC, Yoo KB, Park S. The association between short or long sleep times and quality of life (QOL): results of the Korea National Health and Nutrition Examination Survey (KNHANES IV–V). J Clin Sleep Med 2015;11(6):625–634.
Keywords: EQ-5D, KNHANES, perceived health status, quality of life (QOL), sleep time, VAS
Sleep problems have been recognized as one of the most common issues in modern society and are pervasive in developed countries.1 Organisation for Economic Co-operation and Development (OECD) reported sleep time on an average day in min in 18 OECD countries. That figure for Koreans was about 470 min, which was the shortest among the surveyed nations.2
Common sleep problems include difficulty initiating sleep, difficulty maintaining sleep, time in bed, waking after sleep onset, sleep onset latency, sleep quality, time at which one goes to bed in the evening (retiring time), time at which lights are turned out with the intention to sleep (lights-out time), wake time in the morning (awakening time), and time at which one gets out of bed in the morning (arising time), as well as total sleep time.3,4 A number of studies have indicated that short and/or long sleep time could be an important indicator of perceived individual health status,5 and is related to an elevated suicide risk and an increased risk of chronic disease and all-cause mortality.6–8
Therefore, sleep disturbance may reduce quality of life (QOL) and can affect health outcome,9 which is defined as a person's self-reported satisfaction with his or her life.10 Preliminary evidence indicates that cross-cultural and ethnic differences exist in both QOL and sleep problems. Insufficient sleep contributes to decreasing functional status, fatigue, pain, wound healing, immune function, clinical anxiety, and depression.11–15 In patients with chronic disease, sleep disruption has been shown to be a chronic problem causing severe distress, resulting in greater QOL deficit.16–19 Similarly, sleep disturbances have been shown to adversely affect the QOL in patients with chronic disease.20 These results are in line with the assumption that sleep affects QOL.21
BRIEF SUMMARY
Current Knowledge/Study Rationale: While sleep times are important from the viewpoint of health management, few studies have examined the association between sleep time and health-related quality of life using well-established and commonly used generic instruments and the results have been controversial In this study, we examined the associations between self-reported total sleep times and quality of life independent of perceived health status and depressive disorder.
Study Impact: Our study found that there was an inverted U-shape association between sleep time and quality of life suggesting that inappropriate sleep time (either short or long) is related with worse quality of life. In particular, such an association was more apparent among persons whose perceived health status was poor.
Studies using the EuroQol-5 Dimension (EQ-5D) index, which is often used to measure QOL, have demonstrated lower scores in older individuals compared with younger individuals,22,23 in women than in men,22 and in individuals with lower socioeconomic status compared with individuals of higher socioeconomic status.24
However, although a variety of tools to measure QOL have been used in the previous studies, its results have been controversial,25 and few studies have examined the association between sleep time and QOL using indices such as the EQ-5D and a visual analog scale (VAS), which are well established and commonly used generic instruments for assessing health-related QOL. Therefore, in this study, we examined the associations between self-reported total sleep time and QOL independent of perceived health status and depressive disorder.
METHODS
Study Subjects
The data used in this study were obtained from the Korea National Health and Nutrition Examination Survey (KNHANES), which was conducted by the Korea Ministry of Health and Welfare and the Korea Centers for Disease Control and Prevention (KCDC). The fourth and fifth KNHANES was conducted over 3 y of 2007–2009 and 2010–2012, respectively. The KNHANES is composed of the Health Interview Survey, the Health Examination Survey, and the Nutrition Survey. The Health Interview Survey was performed using self-administered structured questionnaires to obtain information regarding sociodemographic characteristics, health status, health service use, and health behaviors. Trained interviewers visited each household and assisted the participants with specific items in the self-administered tool. The survey response rate was 71.2– 82.8% for 2007–2012.26,27 We used the fourth and fifth KNHANES data of adults age 19 y or older. After excluding 12,400 subjects age 18 years or younger and 9,872 subjects with missing information, 28,178 individuals were included in the analysis. All participants in this survey signed an informed consent form. Because KNHANES IV and V include secondary data released to the public for scientific use and do not contain private information, our study did not have to address ethical concerns.
Variables
Independent Variable of Main Interest
Sleep time referred to self-reported data in response to the question, “How many hours do you usually sleep per day?” Responses were categorized into seven groups: ≤ 4, 5, 6, 7, 8, 9, or ≥ 10 h. We considered 7 h as “appropriate sleep” time, ≤ 5 h as “short sleep” and ≥ 9 h as “long sleep”28, given the definition by the International Classification fo Sleep Disorder 2nd edition.
Dependent Variables: QOL Indices
EQ-5D
The EQ-5D is a brief, self-completed instrument for describing and evaluating quality of health states defined by the EQ-5D index. The EQ-5D asks respondents to simply “mark an X on the scale to indicate how your health is today” and then to “write the number you marked on the scale in the box below.” The descriptive system comprises five dimensions: (1) mobility, (2) self-care, (3) usual activities, (4) pain/discomfort, and (5) anxiety/depressive mood. Each dimension has five levels: no problem, slight problem, moderate problem, severe problem, and extreme problem. Respondents are asked to indicate their health state by placing a cross in the box close the most appropriate statement for each of the five dimensions. This decision results in a one-digit number expressing the level selected for that dimension. The digits for the five dimensions can be combined into a five-digit number describing the respondent's health state (EuroQol Group, http://www.euroqol.org).29
VAS
The VAS recorded the respondent's self-rated health on a 20-cm vertical scale with endpoints labeled “the best health you can imagine” and “the worst health you can imagine.” This information can be used as a quantitative measure of health as judged by the individual respondent.29
Covariates
Socioeconomic and Demographic Factors
Age, household income, residency region, occupation, and marital status were included as sociodemographic factors in the analysis. Equivalized household income was used by dividing the household monthly income by the square root of household size30 and grouped into four household income quartiles. Education level was categorized into four groups: elementary school or lower, middle school, high school, and college or higher. The residency regions were categorized into urban (administrative divisions of a city: Seoul, Daejeon, Daegu, Busan, Incheon, Kwangju, or Ulsan) or rural (not classified as a city). Occupational status was divided into three categories: white collar (administrative, engineering, scientific, teaching and related occupations, sales and related occupations, service occupation), blue collar (farming, forestry, fishing, and hunting occupations, craft and repair, operators, fabricators, and laborers), and unemployed (including housewife and student). Individuals were classified as married, single, and separated (including widowed, previously married and divorced).
Health Behavior Factors
Health risk and behavior factors such as frequency of alcohol use, smoking status, and number of walking days per week were included as covariates in our analyses.31 Smoking status was categorized into three groups: current smoker, former smoker, and never smoker. Frequency of alcohol use was further assessed by questioning the participants about their average frequency (days per week or month) of alcohol drinking during the last year. The “number of chronic disease(s)” variables included conditions such as high blood pressure, diabetes, stroke, myocardial infarction, and angina and was operationalized into four different categories depending on how many were present: 0, 1, 2, or > 2. Using the cutoffs suitable for our population according to a previous study,32 body mass index (BMI) was categorized into three groups: thin or normal (< 18.5 kg/m2); moderate weight (18.5–23.9 kg/m2); overweight (24–26.9 kg/m2); and obese (> 27 kg/m2) adults. In response to the question “Do you have major depression that a doctor diagnosed?”, depression was subcategorized as either “yes,” “no,” or “never sick.” The answer “yes” meant that the subject received a diagnosis of depression by a doctor, “no” meant that the subject has been feeling depressed but not received a diagnosis by a doctor, and “never sick” was those who have never been feeling depressed. Perceived physical health status was assessed with the question, “How do you usually perceive your health?” (“very good,” “good,” “normal,” “poor,” “very poor”). The responses “very good” and “good” were considered to indicate “good,” and “poor” and “very poor” were considered to indicate “poor.”
Statistical Analysis
The independent t test and Chi-square test were used for the univariate analysis. Multiple linear regression analysis and a generalized additive model (GAM) were used to analyze whether sleep time was related to QOL and what is the shape of the association while adjusting for potential confounding variables such as demographic factors, perceived health status, and mental disorders.
GAM provides a flexible and effective technique for modeling nonlinear data.33 Measured data have a discrete distribution, and the discreteness is particularly pronounced for QOL data such as the EQ-5D utilities.34 Therefore, we determined whether semiparametric modeling of the utility data could check for nonlinearity34 and used the GAM because it can help diagnose and accommodate nonlinearity. We further examined the subgroup analysis by perceived health status. Statistical Analysis Software version 9.2 (SAS Institute, Cary, NC, USA) was used for the data analysis.
RESULTS
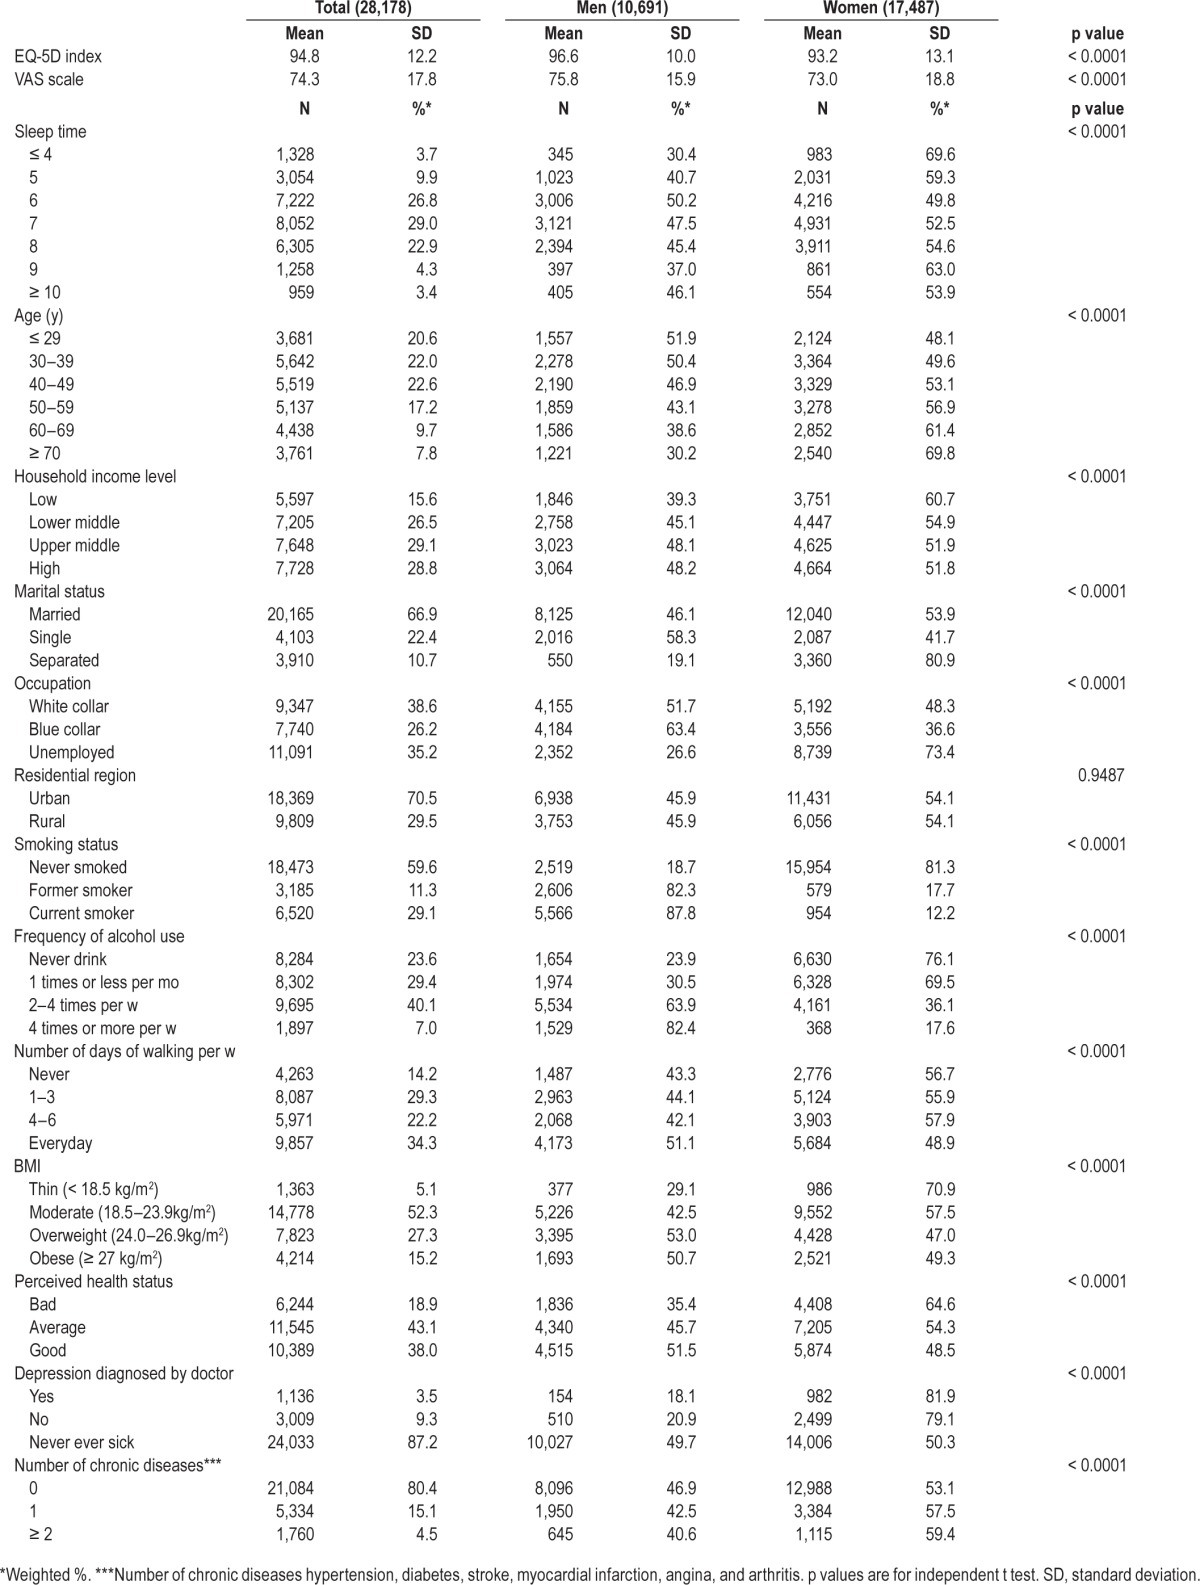
Table 1 presents the demographic characteristics of the study subjects. The 28,178 study participants included 10,691 men and 17,487 women. The average EQ-5D score was 96.6 (standard deviation [SD], 10.0), and the average VAS score was 75.8 (SD, 15.9) in men. The mean EQ-5D score was 93.2 (SD, 13.1), and the mean VAS score was 73.0 (SD, 18.8) in women. There were 2.5% of Korean men and 4.8% of Korean women who reported sleep time ≤ 4 h/day, and 2.0% of Korean men and 2.0% of Korean women reported sleep time ≥ 10 h/day. These results suggest that Korean women experienced more inappropriate sleep patterns than did men (Table 1). Furthermore, differences associated with other demographic characteristics were observed, including household income level, marital status, occupation, smoking status, alcohol consumption, and BMI. More women than men reported that their perceived health status was poor (64.6% of women and 35.4% of men), and more had received a diagnosis of depression (81.9% of women and 18.1% of men).
Table 1.
Demographic characteristics of the study participants.
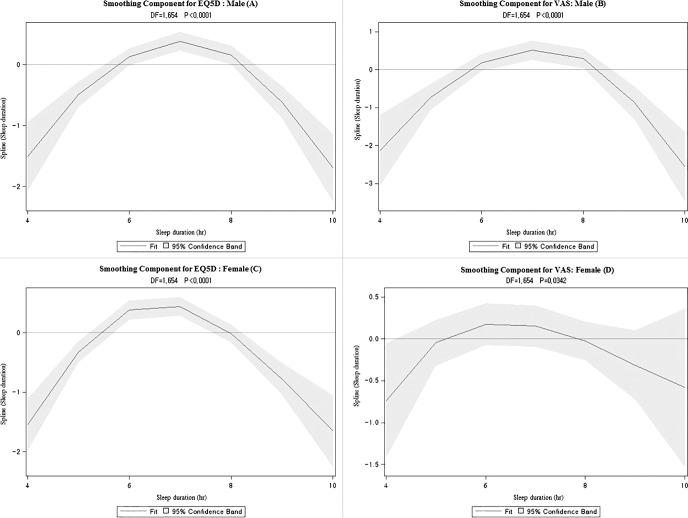
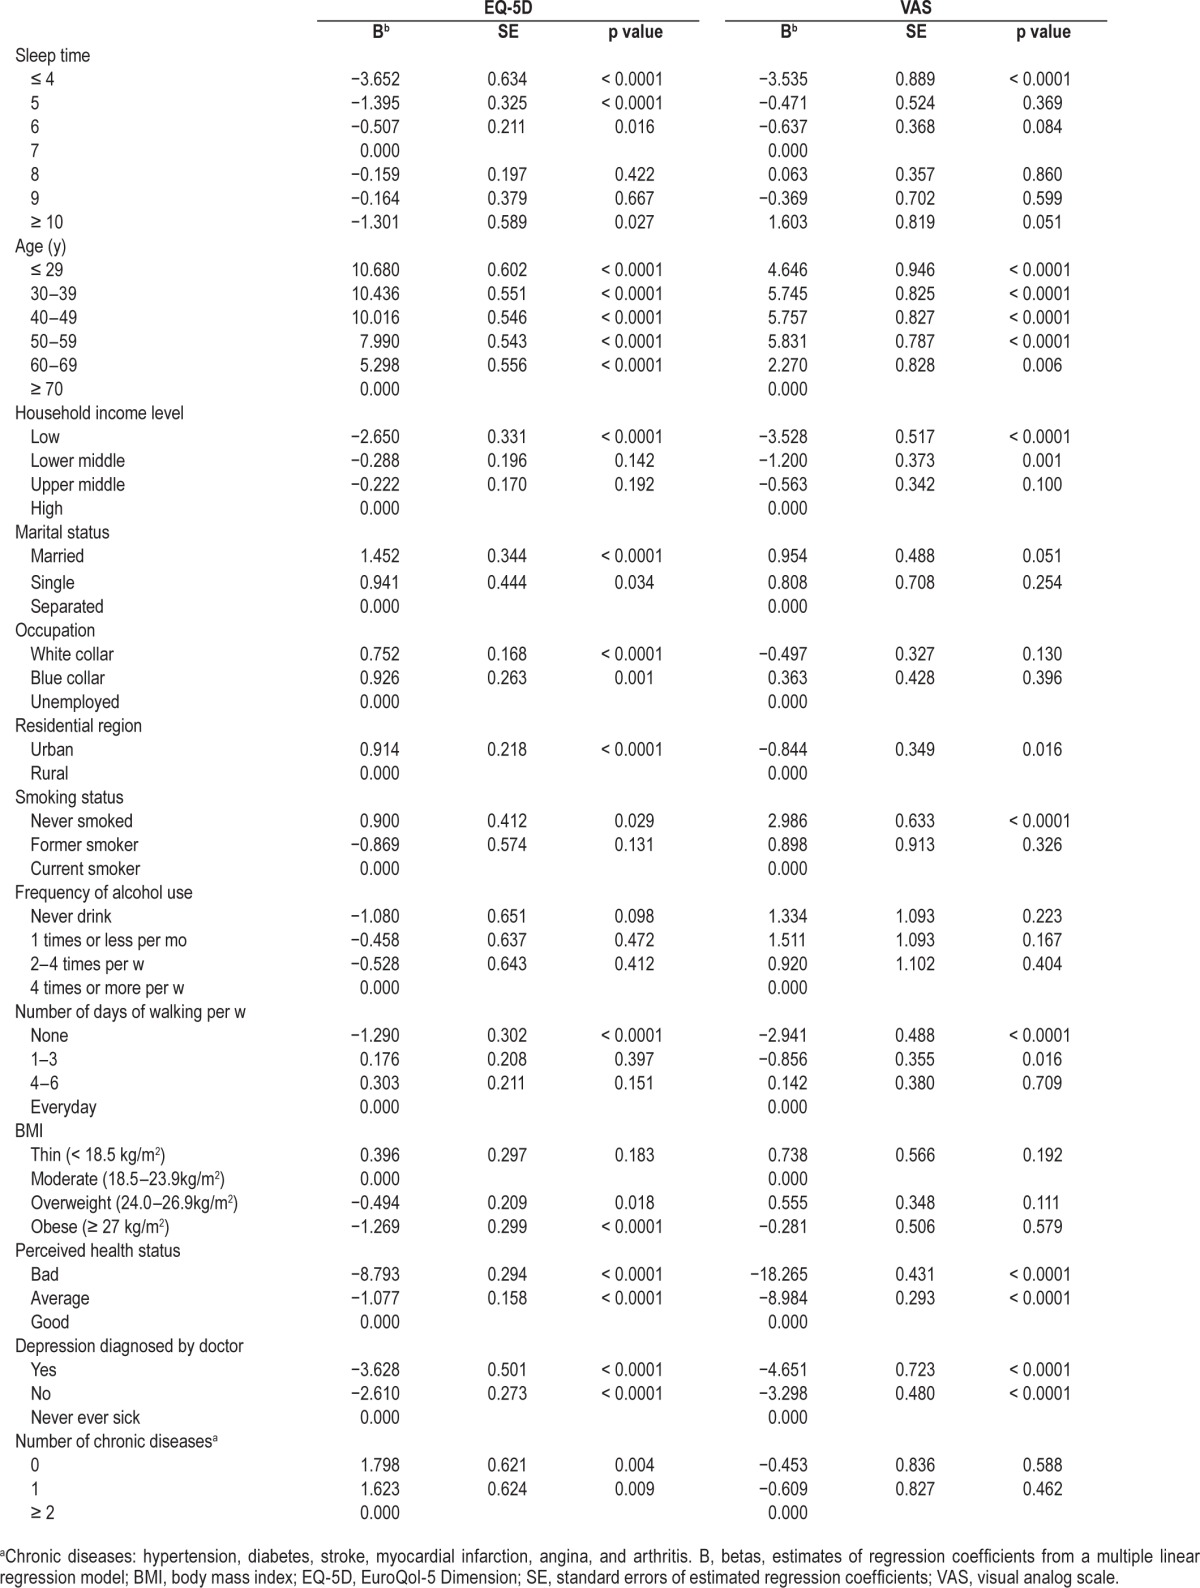
When we explored the smoothed nonlinear relationship between sleep time and QOL using GAM, an inverse U-shaped relationship was observed independent of health status, health behavior, and sociodemographic factors (Figure 1). Tables 2 and 3 present the estimated coefficients from multiple linear regression analyses after adjusting for potential confounding variables. Compared with subjects who slept 7 h/day, Korean men whose sleep time was very short (≤ 4 h/day) or very long (≥ 10 h/day) had significantly worse QOL (−3.125 on EQ-5D and −4.387 on VAS for ≤ 4 h/day; −1.763 on EQ-5D and −1.944 on VAS for ≥ 10 h/day, all p < 0.01) (Table 2). Compared with subjects who slept 7 h/day, Korean men whose sleep time was short (5 h/day) had significantly worse QOL (−1.648 on VAS for 5 h/day, p < 0.01) (Table 2). QOL was worse for women whose sleep was very short (≤ 4 h/day) compared with those who slept 7 h/day (−3.652 on EQ-5D and −3.535 on VAS, all p < 0.0001), which was similar to that of men. QOL was worse for women whose sleep time was short (5 h/day) compared to that for women who slept 7 h/day (−1.395 on EQ-5D, p < 0.00) (Table 3). Long sleep time was also significantly associated with lower QOL in women (−1.301 on EQ-5D for 10 h/day, p < 0.01) (Table 3). QOL in men with poor perceived health status was worse (−6.743 on EQ-5D and −16.735, all p < 0.0001) (Table 2) compared with subjects with good perceived health status. QOL in women with poor perceived health status was worse than that of subjects with good perceived health status (−8.793 on EQ-5D and −18.265, all p < 0.0001) (Table 3).
Figure 1. Association between sleep time and quality of life index using the generalized additive model.
(A) Differences in EQ-5D according to sleep time in males. (B) Differences in visual analog scale (VAS) according to sleep time in males. (C) Differences in EuroQol-5 Dimension (EQ-5D) according to sleep time in females. (D) Differences in VAS according to sleep time in females. From the generalized additive model (GAM) adjusted for age, household income level marital status, occupation, residential region, smoking status, frequency of alcohol use, number of days of walking per week, body mass index, perceived health status, depression diagnosed by doctor, and number of chronic disease. DF, degrees of freedom.
Table 2.
Factors associated with quality of life in Korean men.
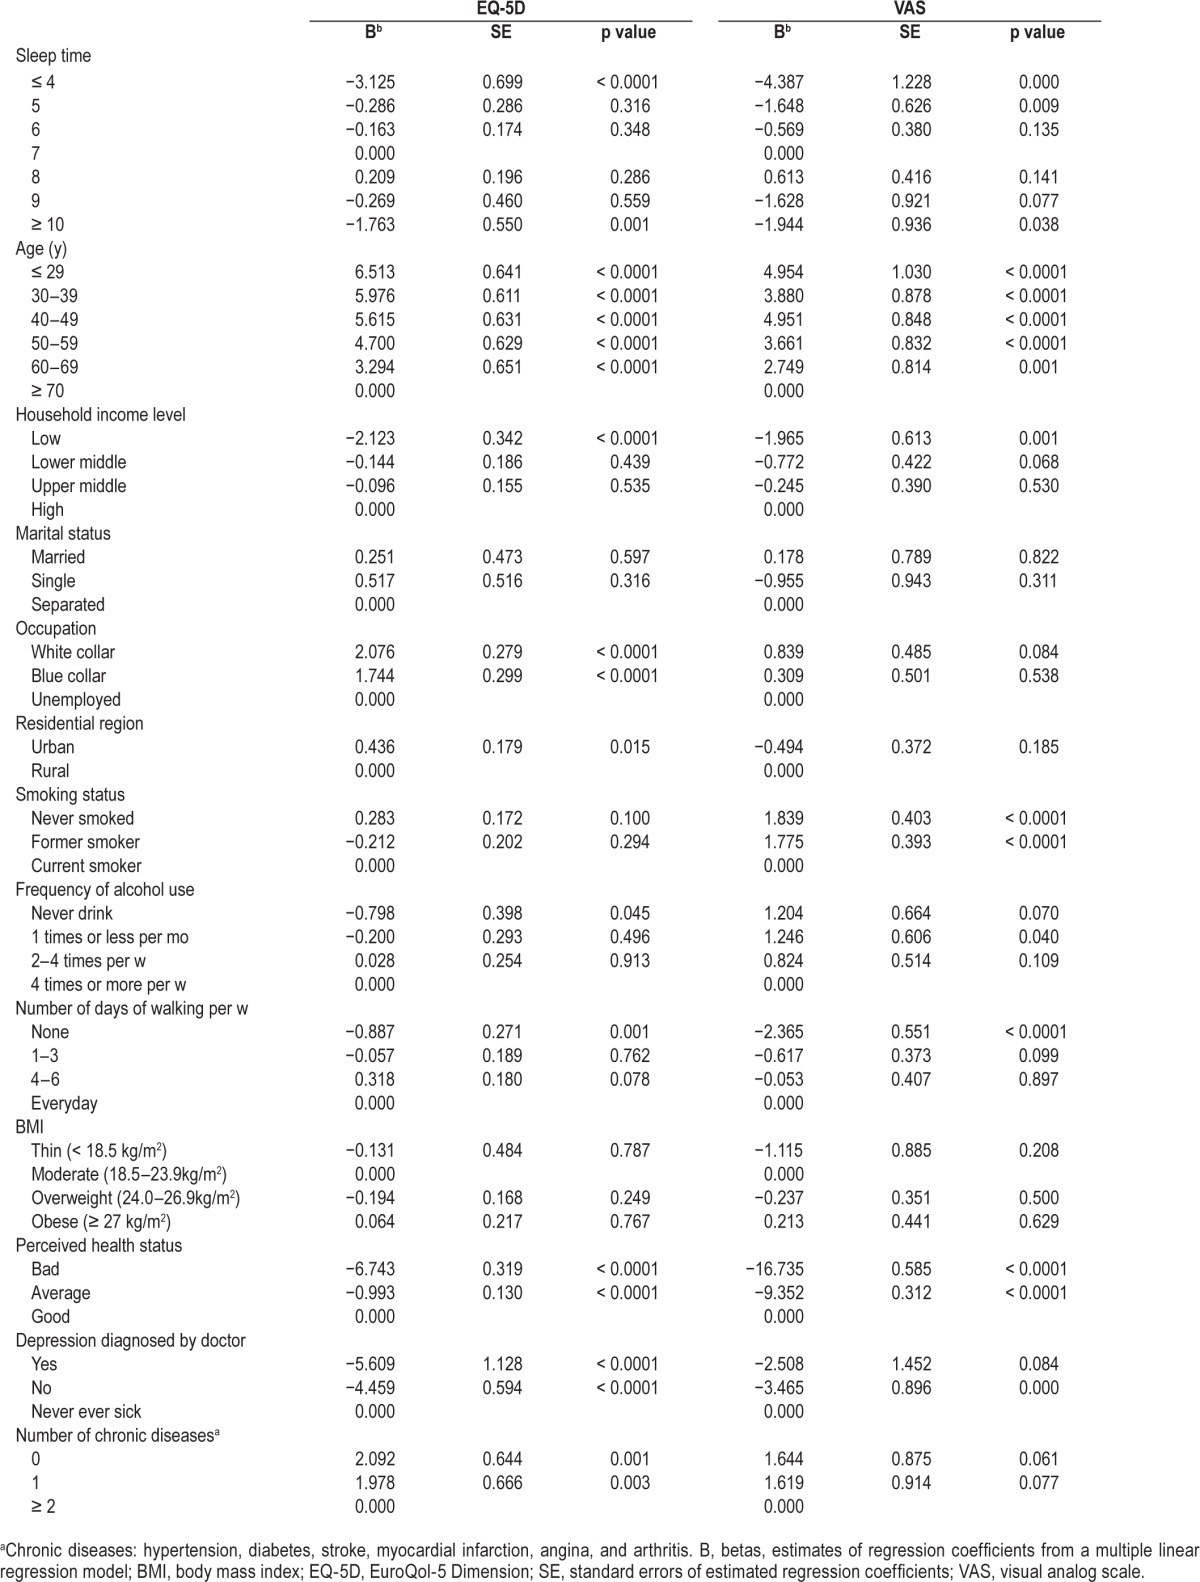
Table 3.
Factors associated with quality of life in Korean women.
The QOL indices were positive predictive factors of perceived health status in both males and females. Additionally, our pilot study indicated an interactive effect between perceived health status and sleep time. Therefore, we conducted a stratified analysis according to perceived heath status.
Tables 4 and 5 present the subgroup analysis by perceived health status. Among men whose perceived health status was good, sleep time was not related to significantly worse QOL than those who slept for 7 h/day. However, among men whose perceived health status was average, those who slept for less than 4h/day had significantly worse QOL than those who have had sleep 7h/day (−2.596 on EQ-5D, p = 0.008 for ≤ 4 h/day). The effect of too long or too short sleep time was even more apparent among men whose perceived health status was bad (−4.250 on EQ-5D, p = 0.013 and −7.087 on VAS, p = 0.012 for ≤ 4 h/day; −3.711 on EQ-5D for ≥ 10 h/day, p = 0.048) (Table 4).
Table 4.
Association between sleep time and quality of life by perceived health status in Korean men.
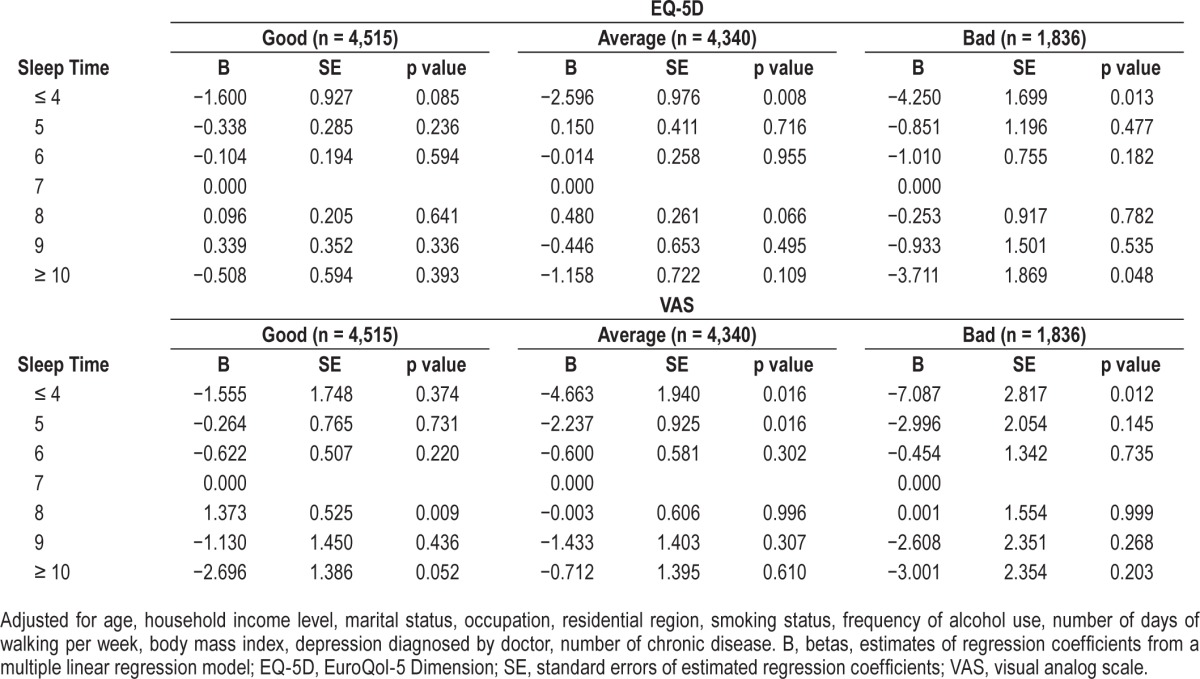
Table 5.
Association between sleep time and quality of life by perceived health status in Korean women.
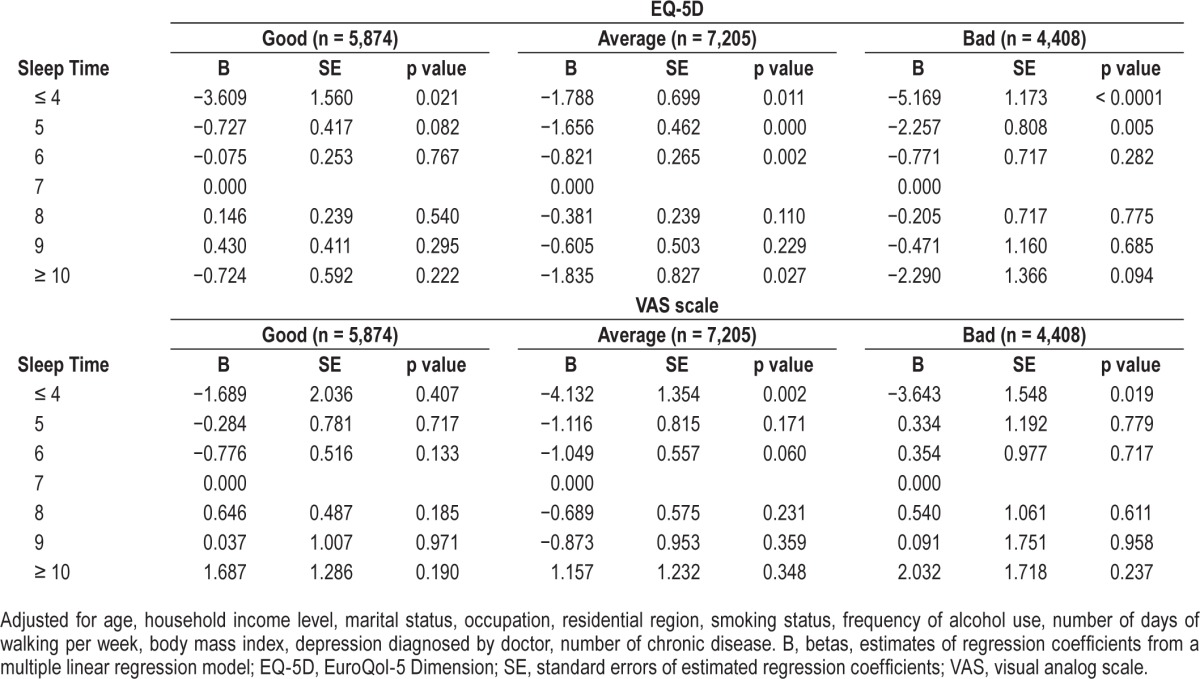
Women who have slept for less than 4 h/day had significantly worse QOL than those who have slept for 7 h/day in women with good perceived health status (−3.609 on EQ-5D, p = 0.021 for ≤ 4 h/day). Women who have slept for less than 4 h/day had significantly worse QOL than those who have slept for 7 h/day in women with average perceived health status (−1.788 on EQ-5D, p = 0.011 and −4.132 on VAS, p = 0.002 for ≤ 4 h/day). Women who have slept for more than 10 h/day had significantly worse QOL than those who have slept for 7 h/day in women with average perceived health status (−1.835 on EQ-5D, p = 0.027 for ≥ 10 h/day). Women who slept for less than 4 h/day had significantly worse QOL than those who slept for 7 h/day with bad perceived health status (−5.169 on EQ-5D, p < 0.0001 and −3.643 on VAS, p = 0.019 for ≤ 4 h/ day) (Table 5).
DISCUSSION
Although the tools used to measure QOL in this study are controversial,25 the EQ-5D is a common tool for measuring QOL,35 and when the range of quality is measured, a continuous visual change scale (VAS, 0–100 score) is typically used.36 In this study, we examined whether sleep time was associated with the QOL indices using multiple regression analysis.
According to an international comparative study on the use of time, adult Korean men work an average of 381 min per day, American men work 262 min per day, and German men work an average of 225 min per day. The average working time of adult Korean women is 217 min per day, whereas American women work an average of 179 min per day, and German women work an average of 124 min per day.31 These findings indicate that Korean adults work longer hours than adults in comparable nations and are therefore more likely to be sleep deprived.37
As our results were consistent with past studies,38 the QOL indices decreased with age. As perceived health status decreased, the likelihood of inappropriate sleep time (≤ 5 h/day or ≥ 9 h/day), compared with 7 h, increased, and both men and women with poor perceived health status showed significant deterioration in QOL.
Overall, this study is important as QOL was significantly decreased in those with poor sleep times and all domains were affected. Our results indicate that inappropriate sleep time (≤ 5 h/day or ≥ 9 h/day) in both men and women was strongly associated with lower QOL independent of perceived health status and depressive disorder. Given the smooth nonlinear relationship between sleep time and QOL, we used GAM model and the relationship between sleep time and the QOL indices (EQ-5D and VAS scores) showed an inverted U-shaped with a steep slope in both males and females (Figure 1). In particular, both males and females with poor perceived health status had significantly decreased EQ-5D index and VAS scores with a steep slope (Table 4 and Table 5). This trend had a larger effect on the reduction in QOL when sleep time was associated with increasingly poor sleep habits. Based on this result, poorer perceived health status and sleep time were associated with lower EQ-5D index and VAS scores.
Several studies have explored the association between sleep time and QOL. For example, one study39 examined 3,834 people age 60 y and older and found that both short and long sleep were associated with poor QOL. In addition, in a study of adults in the United States, a positive association was observed between both shorter and longer sleep time and poor perceived health compared with a sleep time of 7 h.11 In contrast, in another study40 273 people aged 40 to 64 y were interviewed and no association between sleep time and QOL was found. Studies exploring the association between disturbed sleep and QOL have examined the role of comorbid conditions,41,42 sex,42 and race/ethnicity.40 As subjective sleep sufficiency decreased, symptoms of depression increased, indicating a linear, inverse-proportional relationship,10,43 and Japanese individuals with sleep time of either < 6 or > 8 h tended to be more depressed than those with a sleep time of 6–8 h.10 Another sleep study reported that health was optimum with a sleep time of 7–8 h and was poorer for shorter or longer sleep time (U-shaped association).44 However, some studies have reported sex-specific differences in the presence of a U-shaped association.32,45 Still other studies have reported no U-shaped association.46
Therefore, in the current study, analyses were performed to determine with an inverted U-shaped association existed between sleep time and QOL indices and to identify the mechanism underlying any such association.43 Both the EQ-5D index and VAS scale showed an inverted U-shaped association, although this trend appeared stronger in males. Thus, ensuring appropriate sleep time appears to be important in improving QOL. Our results suggest that a universal association (inverted U-shaped association) exists between the QOL indices and sleep time independent of perceived health status and depressive disorder.
This study has some limitations. First, because it was a cross-sectional study, a causal relationship could not be established between the QOL indices and sleep time. Second, although many sleep problems exist, such as difficulty initiating or maintaining sleep (insomnia) and excessive daytime sleepiness, no objective methods of self-reported sleep time (total sleep time) were employed in this study to investigate the association between inappropriate sleep time and QOL. Third, there may have been recall bias and seasonal variation in the responses during the 5-y period of the study, which could have contributed to information bias. Fourth, although there was no pregnant woman in our data, it is possible that our data included some postpartum women who could not be identified due to lack of information in KNHANES data. Postpartum women are known to have fragmented sleep47 and results may be different; however, we believe the number of postpartum women would be minimal in our data and would not alter our analysis results. Fifth, we could not control for the potential confounding of anxiety and only considered depression among neurological dysregulation, whereas both anxiety and depression represent the neurological dysregulation that is reflected in sleep quality.48,49
The strength of this study is that it is the first to assess the relationship of sleep time with the EQ-5D index and VAS score independent of perceived health status and depressive disorder to report the existence of an inverted U-shaped association in Koreans. We also examined the relationship between various health-related factors and the QOL indices using a large, representative Korean sample. Finally, instead of fitting a linear dose-response relationship between sleep time and QOL indices, by employing GAM to our data, we could investigate the nonlinearity in the association between sleep time and EQ-5D index or VAS scores and succeeded to show the inverted-U shaped association.50 We suggest that a through longitudinal follow-up study be planned, as it is necessary to measure precise sleep time using objective methods to improve study reliability.
DISCLOSURE STATEMENT
This was not an industry supported study. The authors have indicated no financial conflicts of interest.
ABBREVIATIONS
- BMI
body mass index
- EQ-5D
EuroQol-5 Dimension
- GAM
generalized additive model
- KNHANES
Korea National Health and Nutrition Examination Survey
- OECD
Organisation for Economic Co-operation and Development
- QOL
quality of life
- SD
standard deviation
- VAS
visual analog scale
REFERENCES
- 1.Geiger SD, Sabanayagam C, Shankar A. The relationship between insufficient sleep and self-rated health in a nationally representative sample. J Environ Public Health. 2012;2012:518263. doi: 10.1155/2012/518263. [DOI] [PMC free article] [PubMed] [Google Scholar]
- 2.Organisation for Economic Co-operation and Development. How do people in the Asia/Pacific region spend their time? OECD. 2011 [Google Scholar]
- 3.Ram S, Seirawan H, Kumar SK, Clark GT. Prevalence and impact of sleep disorders and sleep habits in the United States. Sleep Breath. 2010;14:63–70. doi: 10.1007/s11325-009-0281-3. [DOI] [PubMed] [Google Scholar]
- 4.Hiestand DM, Britz P, Goldman M, Phillips B. Prevalence of symptoms and risk of sleep apnea in the US population: results from the national sleep foundation sleep in America 2005 poll. Chest. 2006;130:780–6. doi: 10.1378/chest.130.3.780. [DOI] [PubMed] [Google Scholar]
- 5.Schubert CR, Cruickshanks KJ, Dalton DS, Klein BE, Klein R, Nondahl DM. Prevalence of sleep problems and quality of life in an older population. Sleep. 2002;25:889–93. [PubMed] [Google Scholar]
- 6.Buxton OM, Marcelli E. Short and long sleep are positively associated with obesity, diabetes, hypertension, and cardiovascular disease among adults in the United States. Soc Sci Med. 2010;71:1027–36. doi: 10.1016/j.socscimed.2010.05.041. [DOI] [PubMed] [Google Scholar]
- 7.Sabanayagam C, Shankar A. Sleep duration and cardiovascular disease: results from the National Health Interview Survey. Sleep. 2010;33:1037–42. doi: 10.1093/sleep/33.8.1037. [DOI] [PMC free article] [PubMed] [Google Scholar]
- 8.Shankar A, Koh WP, Yuan JM, Lee HP, Yu MC. Sleep duration and coronary heart disease mortality among Chinese adults in Singapore: a population-based cohort study. Am J Epidemiol. 2008;168:1367–73. doi: 10.1093/aje/kwn281. [DOI] [PMC free article] [PubMed] [Google Scholar]
- 9.Sandadi S, Frasure HE, Broderick MJ, Waggoner SE, Miller JA, von Gruenigen VE. The effect of sleep disturbance on quality of life in women with ovarian cancer. Gynecol Oncol. 2011;123:351–5. doi: 10.1016/j.ygyno.2011.07.028. [DOI] [PubMed] [Google Scholar]
- 10.Yokoyama E, Saito Y, Kaneita Y, et al. Association between subjective well-being and sleep among the elderly in Japan. Sleep Medicine. 2008;9:157–64. doi: 10.1016/j.sleep.2007.02.007. [DOI] [PubMed] [Google Scholar]
- 11.Berger AM, VonEssen S, Kuhn BR, et al. Adherence, sleep, and fatigue outcomes after adjuvant breast cancer chemotherapy: results of a feasibility intervention study. Oncol Nurs Forum. 2003;30:513–22. doi: 10.1188/03.ONF.513-522. [DOI] [PubMed] [Google Scholar]
- 12.Winningham ML, Nail LM, Burke MB, et al. Fatigue and the cancer experience: the state of the knowledge. Oncol Nurs Forum. 1994;21:23–36. [PubMed] [Google Scholar]
- 13.Lee KA. Sleep and fatigue. Annu Rev Nurs Res. 2001;19:249–73. [PubMed] [Google Scholar]
- 14.Ford DE, Kamerow DB. Epidemiologic-study of sleep disturbances and psychiatric-disorders. An opportunity for prevention. JAMA. 1989;262:1479–84. doi: 10.1001/jama.262.11.1479. [DOI] [PubMed] [Google Scholar]
- 15.Fiorentino L, Ancoli-Israel S. Sleep dysfunction in patients with cancer. Curr Treat Options Neurol. 2007;9:337–46. [PMC free article] [PubMed] [Google Scholar]
- 16.Espie CA, Fleming L, Cassidy J, et al. Randomized controlled clinical effectiveness trial of cognitive behavior therapy compared with treatment as usual for persistent insomnia in patients with cancer. J Clin Oncol. 2008;26:4651–8. doi: 10.1200/JCO.2007.13.9006. [DOI] [PubMed] [Google Scholar]
- 17.Fortner BV, Stepanski EJ, Wang SC, Kasprowicz S, Durrence HH. Sleep and quality of life in breast cancer patients. J Pain Symptom Manage. 2002;24:471–80. doi: 10.1016/s0885-3924(02)00500-6. [DOI] [PubMed] [Google Scholar]
- 18.Palesh OG, Roscoe JA, Mustian KM, et al. Prevalence, demographics, and psychological associations of sleep disruption in patients with cancer: University of Rochester Cancer Center-Community Clinical Oncology Program. J Clin Oncol. 2010;28:292–8. doi: 10.1200/JCO.2009.22.5011. [DOI] [PMC free article] [PubMed] [Google Scholar]
- 19.Savard J, Simard S, Ivers H, Morin CM. Randomized study on the efficacy of cognitive-behavioral therapy for insomnia secondary to breast cancer, part II: Immunologic effects. J Clin Oncol. 2005;23:6097–106. doi: 10.1200/JCO.2005.12.513. [DOI] [PubMed] [Google Scholar]
- 20.Vena C, Parker KP, Allen R, Bliwise DL, Jain S, Kimble L. Sleep-wake disturbances and quality of life in patients with advanced lung cancer. Oncology Nursing Forum. 2006;33:761–9. doi: 10.1188/06.ONF.761-769. [DOI] [PubMed] [Google Scholar]
- 21.Chiu HF, Xiang YT, Dai J, et al. Sleep duration and quality of life in young rural Chinese residents. Behav Sleep Med. 2013;11:360–8. doi: 10.1080/15402002.2013.764524. [DOI] [PubMed] [Google Scholar]
- 22.Burstrom K, Johannesson M, Diderichsen F. Swedish population health-related quality of life results using the EQ-5D. Quality of Life Research. 2001;10:621–35. doi: 10.1023/a:1013171831202. [DOI] [PubMed] [Google Scholar]
- 23.Johnson JA, Coons SJ. Comparison of the EQ-5D and SF-12 in an adult US sample. Qual Life Res. 1998;7:155–66. doi: 10.1023/a:1008809610703. [DOI] [PubMed] [Google Scholar]
- 24.Franks P, Gold MR, Fiscella K. Sociodemographics, self-rated health, and mortality in the US. Soc Sci Med. 2003;56:2505–14. doi: 10.1016/s0277-9536(02)00281-2. [DOI] [PubMed] [Google Scholar]
- 25.Lee YK, Nam HS, Chuang LH, et al. South Korean time trade-off values for EQ-5D health states: modeling with observed values for 101 health states. Value Health. 2009;12:1187–93. doi: 10.1111/j.1524-4733.2009.00579.x. [DOI] [PubMed] [Google Scholar]
- 26.Moon SH, Lee DT, Son Y. Adherence to Health-Related Lifestyle Behavior Recommendations and Association with Quality of Life among Cancer Survivors and Age-Matched Controls in Korea. Asian Pac J Cancer Prev. 2013;14:2949–54. doi: 10.7314/apjcp.2013.14.5.2949. [DOI] [PubMed] [Google Scholar]
- 27.Kang HT, Lee J, Linton JA, Park BJ, Lee YJ. Trends in the prevalence of chronic kidney disease in Korean adults: the Korean National Health and Nutrition Examination Survey from 1998 to 2009. Nephrol Dial Transplant. 2013;28:927–36. doi: 10.1093/ndt/gfs535. [DOI] [PubMed] [Google Scholar]
- 28.American Academy of Sleep Medicine. International classification of sleep disorders. 2nd ed. Westchester, IL: American Academy of Sleep Medicine; 2005. [Google Scholar]
- 29.Thaweethamcharoen T, Vasuvattakul S, Noparatayaporn P. PUK35 EQ-5D (UK and Thai preference weights), SF-6D, and VAS scores in dialysis Thai patients. Value in Health. 2012;15:A158–9. [Google Scholar]
- 30.Kim JH, Kim KR, Cho KH, Yoo KB, Kwon JA, Park EC. The association between sleep duration and self-rated health in the Korean general population. J Clin Sleep Med. 2013;9:1057–64. doi: 10.5664/jcsm.3082. [DOI] [PMC free article] [PubMed] [Google Scholar]
- 31.Kim JH, Park EC, Cho WH, Park CY, Choi WJ, Chang HS. Association between total sleep duration and suicidal ideation among the Korean general adult population. Sleep. 2013;36:1563–72. doi: 10.5665/sleep.3058. [DOI] [PMC free article] [PubMed] [Google Scholar]
- 32.Kojima M, Wakai K, Kawamura T, et al. Sleep patterns and total mortality: a 12-year follow-up study in Japan. J Epidemiol. 2000;10:87–93. doi: 10.2188/jea.10.87. [DOI] [PubMed] [Google Scholar]
- 33.Yang L, Qin GY, Zhao NQ, Wang CF, Song GX. Using a generalized additive model with autoregressive terms to study the effects of daily temperature on mortality. BMC Medical Research Methodology. 2012;12:165. doi: 10.1186/1471-2288-12-165. [DOI] [PMC free article] [PubMed] [Google Scholar]
- 34.Pullenayegum EM, Wong HS, Childs A. Generalized additive models for the analysis of EQ-5D utility data. Med Decis Making. 2013;33:244–51. doi: 10.1177/0272989X12465354. [DOI] [PubMed] [Google Scholar]
- 35.Rabin R, de Charro F. EQ-5D: a measure of health status from the EuroQol Group. Ann Med. 2001;33:337–43. doi: 10.3109/07853890109002087. [DOI] [PubMed] [Google Scholar]
- 36.Jo MW, Lee SI. General population time trade-off values for 42 EQ-5D health states in South Korea. J Prev Med Public Health. 2007;40:169–76. doi: 10.3961/jpmph.2007.40.2.169. [DOI] [PubMed] [Google Scholar]
- 37.Kim O-S, LK-Y, LY-S, Cho H-K, Lee S-M. A comparative study of life time use for Korean, American, and German adults. Korea National Statistical Office. 2005 [Google Scholar]
- 38.Johnson JA, Pickard AS. Comparison of the EQ-5D and SF-12 health surveys in a general population survey in Alberta, Canada. Med Care. 2000;38:115–21. doi: 10.1097/00005650-200001000-00013. [DOI] [PubMed] [Google Scholar]
- 39.Faubel R, Lopez-Garcia E, Guallar-Castillon P, et al. Sleep duration and health-related quality of life among older adults: a population-based cohort in Spain. Sleep. 2009;32:1059–68. [PMC free article] [PubMed] [Google Scholar]
- 40.Jean-Louis G, Kripke DF, Ancoli-Israel S. Sleep and quality of well-being. Sleep. 2000;23:1115–21. [PubMed] [Google Scholar]
- 41.Engleman HM, Douglas NJ. Sleep. 4: Sleepiness, cognitive function, and quality of life in obstructive sleep apnoea/hypopnoea syndrome. Thorax. 2004;59:618–22. doi: 10.1136/thx.2003.015867. [DOI] [PMC free article] [PubMed] [Google Scholar]
- 42.Baldwin CM, Kapur VK, Holberg CJ, Rosen C, Nieto FJ Sleep Heart Health Study Group. Associations between gender and measures of daytime somnolence in the Sleep Heart Health Study. Sleep. 2004;27:305–11. doi: 10.1093/sleep/27.2.305. [DOI] [PubMed] [Google Scholar]
- 43.Kaneita Y, Ohida T, Uchiyama M, et al. The relationship between depression and sleep disturbances: a Japanese nationwide general population survey. J Clin Psychiatry. 2006;67:196–203. doi: 10.4088/jcp.v67n0204. [DOI] [PubMed] [Google Scholar]
- 44.Wingard DL, Berkman LF. Mortality risk associated with sleeping patterns among adults. Sleep. 1983;6:102–7. doi: 10.1093/sleep/6.2.102. [DOI] [PubMed] [Google Scholar]
- 45.Tamakoshi A, Ohno Y. Self-reported sleep duration as a predictor of all-cause mortality: results from the JACC Study, Japan. Sleep. 2004;27:51–4. [PubMed] [Google Scholar]
- 46.Kaplan GA, Seeman TE, Cohen RD, Knudsen LP, Guralnik J. Mortality among the elderly in the Alameda County Study: behavioral and demographic risk factors. Am J Public Health. 1987;77:307–12. doi: 10.2105/ajph.77.3.307. [DOI] [PMC free article] [PubMed] [Google Scholar]
- 47.Berndt C, Diekelmann S, Alexander N, Pustal A, Kirschbaum C. Sleep fragmentation and false memories during pregnancy and motherhood. Behav Brain Res. 2014;266:52–7. doi: 10.1016/j.bbr.2014.02.030. [DOI] [PubMed] [Google Scholar]
- 48.Sandor P, Shapiro CM. Sleep patterns in depression and anxiety: theory and pharmacological effects. J Psychosom Res. 1994;38(Suppl 1):125–39. doi: 10.1016/0022-3999(94)90143-0. [DOI] [PubMed] [Google Scholar]
- 49.Ressler KJ, Nemeroff CB. Role of serotonergic and noradrenergic systems in the pathophysiology of depression and anxiety disorders. Depress Anxiety. 2000;12(Suppl 1):2–19. doi: 10.1002/1520-6394(2000)12:1+<2::AID-DA2>3.0.CO;2-4. [DOI] [PubMed] [Google Scholar]


