

ABSTRACT
Wild-type mammalian orthoreovirus serotype 3 Dearing (T3wt) is nonpathogenic in humans but preferentially infects and kills cancer cells in culture and demonstrates promising antitumor activity in vivo. Using forward genetics, we previously isolated two variants of reovirus, T3v1 and T3v2, with increased infectivity toward a panel of cancer cell lines and improved in vivo oncolysis in a murine melanoma model relative to that of T3wt. Our current study explored how mutations in T3v1 and T3v2 promote infectivity. Reovirions contain trimers of σ1, the reovirus cell attachment protein, at icosahedral capsid vertices. Quantitative Western blot analysis showed that purified T3v1 and T3v2 virions had ∼2- and 4-fold-lower levels of σ1 fiber than did T3wt virions. Importantly, using RNA interference to reduce σ1 levels during T3wt production, we were able to generate wild-type reovirus with reduced levels of σ1 per virion. As σ1 levels were reduced, virion infectivity increased by 2- to 5-fold per cell-bound particle, demonstrating a causal relationship between virion σ1 levels and the infectivity of incoming virions. During infection of tumorigenic L929 cells, T3wt, T3v1, and T3v2 uncoated the outer capsid proteins σ3 and μ1C at similar rates. However, having started with fewer σ1 molecules, a complete loss of σ1 was achieved sooner for T3v1 and T3v2. Distinct from intracellular uncoating, chymotrypsin digestion, as a mimic of natural enteric infection, resulted in more rapid σ3 and μ1C removal, unique disassembly intermediates, and a rapid loss of infectivity for T3v1 and T3v2 compared to T3wt. Optimal infectivity toward natural versus therapeutic niches may therefore require distinct reovirus structures and σ1 levels.
IMPORTANCE Wild-type reovirus is currently in clinical trials as a potential cancer therapy. Our molecular studies on variants of reovirus with enhanced oncolytic activity in vitro and in vivo now show that distinct reovirus structures promote adaptation toward cancer cells and away from conditions that mimic natural routes of infection. Specifically, we found that reovirus particles with fewer molecules of the cell attachment protein σ1 became more infectious toward transformed cells. Reduced σ1 levels conferred a benefit to incoming particles only, resulting in an earlier depletion of σ1 and a higher probability of establishing productive infection. Conversely, reovirus variants with fewer σ1 molecules showed reduced stability and infectivity and distinct disassembly when exposed to conditions that mimic natural intestinal proteolysis. These findings support a model where the mode of infection dictates the precise optimum of reovirus structure and provide a molecular rationale for considering alternative reovirus structures during oncolytic therapy.
INTRODUCTION
Mammalian orthoreovirus (reovirus) is a nonenveloped, icosahedral virus in the Reoviridae family (1). Reovirus is nonpathogenic in humans and has long served as a safe model system for understanding icosahedral virus structure and replication. Although reovirus encodes only 12 proteins (8 structural and 4 nonstructural), its structure and steps required to establish infection are remarkably intricate and complex (depicted in Fig. 5A) (reviewed in references 2 and 3). The reovirus genome consists of 10 double-stranded RNA (dsRNA) segments, 4 small (S1 to S4), 3 medium (M1 to M3), and 3 large (L1 to L3). The genome is encapsidated by two concentric protein layers, an inner capsid composed of the σ2 and λ1 proteins and an outer capsid containing the σ3 and μ1/μ1C proteins. Trimeric σ1 cell attachment proteins anchored at reovirion vertices by λ2 pentamers facilitate binding to cells through sialic acid and junctional adhesion molecule A (JAM-A) (4, 5). Following subsequent endocytosis, reovirus-containing endosomes traffic to lysosomes, where cleavage of outer capsid proteins is facilitated by cathepsins B and L (6, 7). Specifically, the outermost protein, σ3, is completely degraded, while the underlying μ1C protein is cleaved into a membrane-penetrating fragment called δ. The resulting infectious subviral particles (ISVPs) penetrate the endocytic membrane, consequently losing δ and σ1 and ultimately delivering reovirus cores (inner capsid plus genome) into the cytoplasm. In the natural intestinal niche of reovirus infection, membrane-penetrating ISVPs are generated extracellularly by the digestive enzymes trypsin and chymotrypsin. In fact, ISVPs are more infectious than whole virions (8–10), demonstrating the exquisite adaptation of reovirus to enteric infections.
FIG 5.

T3wt, T3v1, and T3v2 exhibit similar rates of intracellular uncoating, but T3v1 and T3v2 show an earlier loss of σ1. (A) Schematic representation of reovirus proteins σ1, λ1, λ2, and λ3 in the context of reovirus virions. Steps of reovirus uncoating include the degradation of σ3, cleavage of μ1C to δ, cleavage of the σ1 head (σ1C) during the formation of ISVPs, and release of δ and σ1 tail (σ1N) during the formation of transcriptionally active core particles. (B) Diagrammatical depiction of the approach to separate virion-associated and dissociated proteins, along with nomenclature for σ1 proteolytic fragments labeled in panel B and C immunoblots. A total of 5 × 10¹² T3wt particles/ml were treated with 14 μg/ml chymotrypsin for the indicated durations. Virion-associated (pellet [P]) and dissociated (supernatant [S]) fractions were separated by high-speed ultracentrifugation and subjected to Western blot analysis with the indicated antibodies. (C, left) L929 cells were mock infected (−) or exposed to equivalent numbers of T3v1, T3v2, and T3wt particles (+ Reo.) at 4°C for 1 h, and viruses were then permitted to enter for 1 h and incubated at 37°C in the presence of 50 μg/ml cycloheximide to stop de novo protein synthesis. At the indicated times postentry, cell lysates were subjected to high-speed centrifugation. Virion-associated (pellet) and dissociated (supernatant) fractions were subjected to Western blot analysis with the indicated antibodies. T3wt digested in vitro for 120 min (in vitro) was included in each immunoblot to indicate the location of reovirus proteins and as a cross-blot loading control. (Top right) Sum of band intensities for full-length σ1 and σ1 tail associated with virions, relative to T3wt at 2 h p.i. (± standard deviations; n = 4). Levels of T3v1 and T3v2 were significantly different from those of T3wt at 2 and 4 h p.i. (**, P < 0.01 by t test). (Bottom right) Percent μ1C plus δ release or σ1 release calculated as the percentage of protein in the supernatant versus that in the supernatant-plus-pellet fraction for the corresponding time points (± standard deviations; n = 5, 4, and 3 for T3wt, T3v1, and T3v2, respectively). Mean values for all three virions at a given time point were not significant (by analysis of variance).
Unlike other mammalian viruses, members of the Reoviridae family do not fully disassemble during the infection process; that is, the genome remains inside the inner capsid. Maintaining reovirus genomes within a core particle presumably functions to conceal genomic dsRNAs that would otherwise potently activate antiviral signaling. Within the core, the viral polymerase λ3 transcribes positive-sense viral RNAs, which are subsequently capped and released through channels created by pentameric λ2 proteins at each core vertex. De novo protein production, inner capsid assembly, and dsRNA synthesis then produce new cores that amplify RNA and protein synthesis through secondary rounds of replication. Ultimately, outer capsid proteins are assembled onto progeny cores to produce fully assembled virions, which are then released from infected cells (1).
During studies on basic reovirus biology, reovirus was discovered to possess an intrinsic specificity toward cancer cells over normal cells (11–17). Reovirus shows potent antitumor activity in a wide assortment of in vivo cancer models (18–22) and is being examined in numerous phase I/II and III human clinical trials (23–30). All trials currently use the reovirus serotype 3 (T3) Dearing strain in its wild-type form (here referred to as T3wt). Since reovirus evolved under the distinct pressures posed by the enteric and respiratory routes of infection, it may have acquired characteristics that are optimized for these niches. Accordingly, we and others have postulated that wild-type reovirus may not be optimally suited for replication in cancer cells, suggesting that a search for better-adapted variants might prove useful. Previously, we isolated two reovirus variants, namely, variant 1 (T3v1) and variant 2 (T3v2), that replicate more robustly than T3wt on a variety of human and mouse transformed cell lines. Both variants maintained their specificity for cancer cells over normal cells, suggesting that restrictions imposed by normal cells (such as antiviral signaling) are still effective at prohibiting virus infection (13, 31, 32). In addition, by using an aggressive in vivo melanoma model, both variants were found to have improved tumor clearance and animal survival relative to T3wt (31).
Initial characterizations found that T3v1 and T3v2 had higher numbers of PFU per particle than did T3wt (31). The enhanced infectivity of T3v2 was linked to a single mutation in the S1 genome segment encoding the σ1 cell attachment protein. T3v1 was found to have three missense mutations, one each in the λ3 polymerase, the λ2 turret protein that anchors σ1 at virion vertices, and the inner capsid protein λ1. Per cell-associated particle, T3v1 and T3v2 infected a greater proportion of cancer cells than did T3wt, resulting in ∼3- to 4-fold-higher viral RNA levels, protein levels, and viral titers at each round of replication (∼24 h). These findings demonstrated that T3v1 and T3v2 are better adapted to cancer cell infection than T3wt and suggested a possible utility of reovirus variants for oncolysis (31). However, the mechanisms for the improved infectivity of cancer cells remained unclear.
This study aimed to further explore molecular differences between T3wt and variant virions and arrive at a rationale for why the variants have improved infectivity. Here, we show that the two variants share an important feature: both variants have significantly reduced levels of σ1 cell attachment proteins on virions relative to those of T3wt. We also show that when σ1 levels are reduced on wild-type reovirus virions, they become increasingly infectious toward tumorigenic cells; hence, there is a causal relationship between σ1 levels on virions and infectivity. Conversely, in vitro digestion of virus by using chymotrypsin, mimicking intestinal proteolysis, rendered both variants less infectious than T3wt. Our findings suggest that optimal adaptation of reovirus to a particular environmental niche requires an exquisite fine-tuning of virion structure.
MATERIALS AND METHODS
Cell lines and virus.
L929, A549, and H1299 cells were purchased from the American Type Culture Collection (ATCC). All cells were cultured according to ATCC recommendations. Mammalian orthoreovirus serotype 3 Dearing (here referred to as T3wt) corresponds to the T3/Human/Ohio/Dearing/1955 strain (T3D) of reovirus (33, 34), and a seed stock from 1994 was generously provided by Patrick Lee (Dalhousie University). Genomic divergence relative to the earliest reported sequences of T3D was previously described (31). Viruses were propagated from seed stocks rather than being serially passaged, to preserve genetic identity. T3wt, T3v1, T3v2, and reassortants were propagated in L929 cells, extracted with Vertrel XF (Dymar Chemicals), and purified by ultracentrifugation on cesium chloride (CsCl) gradients, as previously described (31, 35). Reovirus titers were obtained by titration on L929 cells, using a 1% (wt/vol) crystal violet solution to visualize plaques after 4 days postinfection (p.i.), as previously described (16).
Western blot analysis.
Western blot analysis was performed as previously described (16, 31), using rabbit polyclonal antireovirus (to visualize μ1, μ1C, δ, and σ3) and anti-σ1C (σ1 tail domain), generously provided by Patrick Lee and Roy Duncan (Dalhousie University). Mouse monoclonal antibodies to σ3 were purchased from the Developmental Studies Hybridoma Bank (4F2). Rabbit anti-σ1N (σ1 head domain) was generously donated by Terence Dermody (Vanderbilt University). Rabbit antibodies were generated against reovirus core proteins (including λ1/2 and σ2) by ProSci Inc., using CsCl-purified reovirus cores generated by in vitro chymotrypsin digestion, as described below. Mouse monoclonal β-actin (C4) antibody (Santa Cruz) was used to normalize gel loading. Secondary antibodies (Jackson ImmunoResearch Laboratories Inc.) conjugated directly to Alexa Fluor 647 or to horseradish peroxidase in conjunction with a chemiluminescence (ECL-2) substrate (Thermo Scientific) were used for detection. Immunoblots were imaged by fluorescence on an ImageQuant LAS4010 imager (GE Healthcare Life Sciences), and densitometric analysis was performed by using ImageQuant TL software (GE Healthcare Life Sciences). For quantitative analysis, band intensities were plotted relative to the lysate dilution to generate polynomial equations for standard samples, and the relative quantities for the remaining samples were extrapolated and averaged.
Double-stranded genomic RNA visualization.
For dsRNA genome visualization, purified virions were diluted 1:1 in 2× protein sample buffer (Bio-Rad), heated at 65°C for 5 min, and subjected to SDS-PAGE at 6 mA (per gel) for 22 h prior to visualization with ethidium bromide staining, using the ImageQuant LAS4010 imager (GE Healthcare Life Sciences).
Reovirus immunoprecipitation.
For each sample, 50 μl protein G magnetic beads (Millipore) was washed twice with wash buffer (phosphate-buffered saline [PBS]–0.1% Triton X-100) and incubated with 15 μl antibody to antireovirus, anti-σ1N, or normal rabbit serum (NRS; Sigma) for 1 h at room temperature (RT), with constant mixing. Excess antibody was removed by washing twice in wash buffer. Equivalent particle numbers of T3wt, T3v1, and T3v2 (standardized by quantitative Western blot analysis) were incubated with the bead-antibody mixtures for 2 h at RT and washed three times with wash buffer. Antibody-bound (pellet) and unbound (first supernatant) fractions were resuspended in protein sample buffer and subjected to SDS-PAGE and Western blot analysis as described above.
Reovirus binding assays.
To quantify average reovirus-cell binding, L929 cells at 100% density were prechilled for 40 min and exposed to serial dilutions of reovirus at 4°C for 1 h with gentle agitation every 5 min. Three washes with ice-cold PBS were used to remove unbound reovirus, and cell lysates were processed for SDS-PAGE and Western blot analysis with polyclonal antireovirus antibodies, as described above. To determine per-cell reovirus binding, L929 cells were detached by using Cellstripper (Cellgro), quenched with minimum essential medium (MEM) supplemented with 10% fetal bovine serum (FBS), and diluted to a cell concentration of 5 × 10⁵ cells/ml. All subsequent steps were performed at 4°C. Aliquots of 1 ml of cells were incubated for 30 min, followed by the addition of reovirus for 1 h. Cells were washed twice with PBS supplemented with 5% FBS following reovirus binding and incubations with primary antibody and secondary antibody. Cells were incubated with polyclonal antireovirus antibody and Alexa Fluor-conjugated goat anti-rabbit secondary antibody for 45 min each. Following washing after incubation with the secondary antibody, cells were fixed with 4% paraformaldehyde for 45 min. Samples were analyzed by using a FACSCanto instrument (BD Biosciences). To cleave N-acetylneuraminic acid (sialic acid), L929 cells were treated with 20 mU neuraminidase from Vibrio cholerae (catalog number N7885; Sigma) per 5 × 10⁵ cells in 400 μl PBS for 1 h at 37°C. Untreated controls were subjected to similar conditions. Cells were pelleted at 500 × g for 5 min in the presence of 10% FBS and processed for reovirus binding as described above.
Agarose gel separation of whole reovirus.
Purified reoviruses (5 × 10¹⁰ particle equivalents estimated by optical density readings) diluted in 5% Ficoll and 0.05% bromophenol blue were subjected to electrophoresis on a 0.7% agarose gel with 0.5 μg/ml ethidium bromide in TAE buffer (40 mM Tris-HCl, 5 mM sodium acetate, 1 mM EDTA [pH 7.5]) for 12 h at room temperature (36). Reovirus species were visualized by UV transillumination on the ImageQuant LAS4010 imager (GE Healthcare Life Sciences) or by Coomassie staining (Thermo Scientific).
Intracellular reovirus disassembly and σ1 release assays.
L929 cells were exposed to serum-free MEM either alone (mock) or containing equivalent particle numbers of T3wt, T3v1, and T3v2 (calculated by using Coomassie blue staining for total viral protein) at a multiplicity of infection (MOI) equivalent to 50 for T3wt. Excess virus was removed by three washes with PBS, and cells were incubated in MEM supplemented with 50 μg/ml cycloheximide (Sigma-Aldrich). Cell lysates were collected immediately (0 h p.i.) or after incubation at 37°C for 2, 4, and 6 h in PBS–0.1% Triton X-100–protease inhibitor cocktail (Sigma). After centrifugation at 800 × g for 10 min at 4°C to remove nuclei and debris, cytoplasmic fractions were subjected to centrifugation at 100,000 × g for 90 min at 4°C to separate virion-associated (pellet) from virion-dissociated (supernatant) proteins. Equivalent loading ratios of pellet and supernatant fractions were subjected to SDS-PAGE and Western blot analysis.
Dicer-substrate RNA knockdown of reovirus proteins.
Dicer substrate small interfering RNA (DsiRNA) (Integrated DNA Technologies) sequences were designed (Table 1). DsiRNAs targeting the vaccinia virus G7L and F17R genes were used as nontargeting negative controls. H1299 and A549 cells were transfected with 7.5 μl of 2 μM DsiRNAs and 4 μl of Lipofectamine 2000 (Life Technologies) per 12-well equivalent (1 ml), according to the manufacturer's instructions, for 9 to 13 h, followed by wild-type reovirus infection for 12 h at a T3wt dose empirically established to produce ∼40% infection under nontransfected conditions (1.2 × 10⁶ and 3.0 × 10⁵ PFU per confluent 24-well plate of A549 and H1299 cells, respectively). For cesium chloride virus extraction, H1299 cells were transfected in a 150-cm2 dish for 9 h, followed by infection with T3wt (1.2 × 10⁸ PFU) for 24 h. Virus was extracted and purified as indicated above.
TABLE 1.
Dicer substrate RNA sequences
| DsiRNA | Sequence |
|---|---|
| S1-2 sense | 5′-GGACUUGAUUCGAGUGUUACCCA-3′ |
| S1-2 antisense | 3′-ACCUGAACUAAGCUCACAAUGGGUCA-5′ |
| S1-4 sense | 5′-AGAGCAUGUGGAUAGGAAUUGUC-3′ |
| S1-4 antisense | 3′-CGUCUCGUACACCUAUCCUUAACAGAG-5′ |
| S2-2 sense | 5′-GUACGACUGCGAUGAUUAUCCAU-3′ |
| S2-2 antisense | 3′-ACAUGCUGACGCUACUAAUAGGUAAA-5′ |
| S2-5 sense | 5′-AGAUCAGACUCAACAGUUUAAGA-3′ |
| S2-5 antisense | 3′-CGUCUAGUCUGAGUUGUCAAAUUCUCC-5′ |
| G7L sense | 5′-GAACCAACUAGAUUCAUCAAAUAAA-3′ |
| G7L antisense | 3′-UUUAUUUGAUGAAUCUAGUUGGUUCUC-5′ |
| F17R sense | 5′-UACCAAAGAAGGAAGAUAUCUGGTT-3′ |
| F17R antisense | 3′-AACCAGAUAUCUUCCUUCUUUGGUAUU-5′ |
Flow cytometric and immunohistochemical analyses of productive reovirus infection.
At 12 or 15 h p.i., flow cytometry was performed to quantify the percentage of cells able to establish a productive reovirus infection. Briefly, cells were detached by using trypsin, washed once with PBS, and fixed with 4% paraformaldehyde for 30 min on ice. Cells were washed once in PBS and incubated in blocking buffer (PBS–1% Triton X-100–3% bovine serum albumin [BSA]) for 1 h at room temperature. Following hour-long incubations with primary antireovirus antibody (1:5,000 in blocking buffer) and secondary anti-rabbit Alexa Fluor 647-conjugated antibody (1:3,000 in blocking buffer), cells were washed three times in PBS–0.1% Triton X-100 and subjected to flow cytometry by using a FACSCanto instrument (BD Biosciences). Data were analyzed by using FCS Express software (De Novo Software). Immunocytochemical staining for reovirus protein expression was performed on methanol-fixed cells by using polyclonal antireovirus antibodies (1:10,000) and mouse anti-rabbit alkaline phosphatase-conjugated secondary antibodies (1:5,000). Cells were incubated with antibodies diluted in blocking buffer (PBS–0.1% Triton X-100–3% BSA), washed extensively with PBS–0.1% Triton X-100, and processed with nitroblue tetrazolium–5-bromo-4-chloro-3-indolyl-phosphate (NBT/BCIP) in 10 mM Tris-HCl (pH 9.5).
Chymotrypsin-mediated reovirus disassembly and σ1 release.
CsCl-purified T3wt, T3v1, and T3v2 reovirus preparations were diluted to equal particle numbers based on band intensities of μ1C and σ3 during quantitative gel electrophoresis. Approximately 5 × 10¹² particles/ml (estimated by determining the optical density at 260 nm [OD260]) were treated with 14 μg/ml chymotrypsin (dissolved in 1 mM HCl and 2 mM CaCl2) in reaction buffer (150 mM NaCl, 15 mM MgCl2, and 10 mM Tris [pH 7.4]) for the indicated durations. Reactions were terminated by the addition of 5× final protease inhibitor cocktail (Sigma) on ice, and the mixtures were subjected to plaque titration or SDS-PAGE and Coomassie blue staining. To monitor the release of σ1, samples were subjected to centrifugation at 100,000 × g for 90 min at 4°C, and pellet (virion-bound) and supernatant (dissociated) proteins were analyzed as described above for whole-cell lysates.
In vitro reovirus core transcription reactions and transfection.
To purify reovirus cores, chymotrypsin digestion and high-speed centrifugation were used, as described above, but the pellet fraction was confirmed to have cores and equilibrated to equivalent amounts for T3wt, T3v1, and T3v2 by quantitative SDS-PAGE and Coomassie blue staining. Approximately 2 × 10¹¹ particles (estimated based on an OD260 of 1 per 4.4 × 10¹² core particles/ml [37]) resuspended in Tris-HCl (pH 8.0) were added to in vitro transcription reaction mix (2 mM ATP, 2 mM GTP, 2 mM CTP, 2 mM UTP, 100 mM Tris-HCl [pH 8.0], 10 mM MgCl2, 100 μg/ml pyruvate kinase, 3.3 mM phosphoenolpyruvate, 1.28 U/ml RNase inhibitor), as previously described (38). For negative-control samples, ATP was omitted. Reaction mixtures were incubated at 40°C for the indicated durations, and aliquots were removed and added to 500 μl TRIzol LS (Invitrogen) containing 5 ng/ml green fluorescence protein (GFP) RNA generated by using T7 RiboMAZ in vitro transcription reactions (Promega) (according to the manufacturer's instructions) for normalization. RNA was purified according to the instructions for TRIzol LS but with 0.1 mg/ml glycogen (Invitrogen) to assist in RNA pellet visualization. Reovirus S4 and GFP RNA levels were then determined by quantitative reverse transcription-PCR using random-primer cDNA synthesis (Moloney murine leukemia virus [MMLV]; Invitrogen) and SYBR green real-time PCR master mixes (Invitrogen), as previously described (31). Values were normalized to GFP values and are presented relative to T3wt values at the 0-h reaction time. For transfection, 2.4 × 10⁸ or 1.2 × 10⁹ core particles in 250 μl of optiMEM (Invitrogen) were mixed with 10 μl Lipofectamine 2000 (Invitrogen) in 240 μl of optiMEM for 20 min at RT. A total of 1 × 10⁶ H1299 cells per 6-well equivalent in 2 ml medium were treated with 500 μl of the core-Lipofectamine mixture, incubated at 37°C for 4 h, and then returned to their normal medium. At 18 h p.i., cells were subjected to flow cytometric analysis with reovirus-specific antiserum, as described above.
RESULTS
Reovirus variants with enhanced infectivity toward tumor cells have reduced levels of σ1 per virion.
T3v1 and T3v2 have higher infectivities per particle toward a panel of cancer cells (Fig. 1A) (31), suggesting that there is an inherent difference between these particles and T3wt virions. While T3v1 has a mutation in the extravirion “flap” domain of λ2 involved in anchoring σ1, the mutation in σ1 of T3v2 (S18I) resides in the N-terminal domain anchored within λ2. Accordingly, we hypothesized that both mutations could affect the association of λ2 and σ1 in virions (31, 39). To address this possibility, levels of σ1 relative to the levels of the major structural proteins μ1C and σ3 were assessed on fresh cesium chloride (CsCl) gradient-purified virions by quantitative Western blot analysis (Fig. 1B). T3v1 and T3v2 particles contained 45% ± 17% and 22% ± 10% virion-associated σ1 relative to that for T3wt. Intracellular levels of σ1 were equivalent for all three viruses, suggesting that mutations in T3v1 and T3v2 reduced σ1-virion interactions rather than access to the σ1 protein (Fig. 1C). The σ1 protein consists of an N-terminal virion-anchoring domain, a long heptad repeat “tail” domain involved in σ1 trimerization, a flexible “neck” domain that can undergo proteolytic cleavage and bind carbohydrates, and a globular C-terminal “head” domain that binds cellular junctional adhesion molecule A (JAM-A) (5, 40–47). Both σ1 head- and σ1 tail-specific antibodies showed lower σ1 levels on T3v1 and T3v2 than T3wt, suggesting that σ1 was intact for all three viruses (Fig. 1C).
FIG 1.

Reovirus variants T3v1 and T3v2 have reduced levels of σ1 per virion. (A, left) Comparison of plaque sizes of T3wt, T3v1, and T3v2 on L929 cells at 4 days postinfection stained with crystal violet. (Right) L929 cells were exposed to equivalent particle doses of T3wt, T3v1, and T3v2 (at 1 and 1/3 dilutions), and productively infected (dark-stained) L929 cells were visualized by immunocytochemical analysis with polyclonal antireovirus antibodies at 15 h postinfection. (B) Levels of σ1, μ1C, and σ3 in fresh CsCl gradient-purified preparations of T3wt, T3v1, and T3v2 determined by quantitative Western blot analysis. Relative protein quantities were extrapolated from polynomial equations generated from one-third dilutions of T3wt. The average number of σ1 molecules per virion was calculated as quantities of σ1/[0.5 · (μ1C + σ3)]. The graph presents average relative σ1 levels per particle for four independent preparations of T3v1 and T3v2 relative to T3wt (± standard deviations). One-way analysis of variance with Bonferroni's multiple-comparison posttest indicated that means were significantly different (***, P < 0.001). (C) Similar to panel B but with total protein lysates of L929 cells infected with T3wt, T3v1, and T3v2 or viruses purified from these lysates by high-speed centrifugation through a sucrose cushion. Antibodies to the σ1 head (C terminus) and tail (N terminus) confirm that σ1 molecules are intact. (D) Same as panel B but using extracellular virions purified from the medium of infected L929 cells. (E) Agarose gel electrophoresis of T3wt, T3v1, and T3v2 virions. The quantity of σ1 proteins per virion (0 to 12 particles) was postulated based on previously reported characterizations (36).
Reovirus is commonly depicted as having σ1 trimers uniformly protruding from each vertex, as suggested by stoichiometric analysis of σ1 levels in virions (37, 48). However, in 1994, Larson et al. observed that wild-type reovirus populations could be segregated into 13 bands by agarose gel electrophoresis and that each band had distinct σ1 levels (0 to 12 σ1 per particle) (36). Virions with fewer than three σ1 trimers were found to be incapable of binding to cells. Importantly, virions purified with three or more σ1 trimers were suggested to exhibit equal infectivities, regardless of absolute σ1 levels. In view of our current discovery that reovirus variants with improved infectivity had reduced levels of σ1 per virion, we revisited the precise compositions of T3v1, T3v2, and T3wt virus preparations. Reovirus is commonly purified from infected-cell pellets, a procedure that concentrates lysates for subsequent CsCl density gradient centrifugation. Accordingly, it was possible that changes in levels of σ1 per virion reflected the capture of incompletely assembled particles. When σ1 levels on mature virions released into the medium were assessed, extracellular T3v1 and T3v2 particles still showed dramatically lower levels of virion-associated σ1 protein (Fig. 1D).
Since Western blot analysis determines only the average σ1 levels per virion, we postulated three potential models to explain the reduced levels of σ1 in T3v1 and T3v2: (i) that T3v1 and/or T3v2 has a mixture of virions devoid of σ1 and complete with σ1 at each vertex, (ii) that all T3v1 and/or T3v2 particles have a low but uniform level of σ1, or (iii) that T3v1 and/or T3v2 has a mixture of viruses with various levels of σ1 trimers albeit tending toward reduced σ1 levels relative to those of T3wt. All three models could produce an average reduction in σ1 levels relative to those of other structural proteins within a virus preparation. During agarose gel electrophoresis, T3wt had predominantly slow-migrating species, while T3v1 and T3v2 has successively faster-migrating species (Fig. 1E). Based on the studies by Larson et al., our results supported the third model, namely, that all virus preparations have some virus particles devoid of σ1 (fast migrating), that T3wt has mostly virions with complete σ1 trimers per virion (slow migrating), and that T3v1 and T3v2 have progressively lower levels of σ1 per virion.
Intermediate levels of σ1 on reovirions are sufficient for cell attachment.
Since σ1 is the major cell attachment protein of reovirus, we evaluated whether reduced σ1 levels on T3v1 and T3v2 virions impact their ability to bind cells. Tumorigenic L929 mouse fibroblasts were treated with T3v1, T3v2, and T3wt at equivalent particle doses at 4°C to permit cell association without entry. Half-dilutions of each virus were used to obtain quantitative binding results and ensure subsaturation. The proportion of cell-bound virions was assessed by either Western blot analysis for reovirus μ1C and σ3 proteins (Fig. 2A) or flow cytometry (Fig. 2C) for four independent virus preparations. Binding assays showed equivalent quantities of cell-associated virus for T3wt and T3v1, suggesting that both viruses have similar levels of virions with sufficient σ1 for cell binding (Fig. 2A and C). For a preparation of T3v1 that had slightly reduced binding relative to that of T3wt, the unbound virus fraction consisted of virions with only very low levels (0 to 2) of σ1 (Fig. 2B). Conversely, only 0.47 ± 0.15 particles of T3v2 could attach to cells relative to T3wt (Fig. 2A), consistent with T3v2 having a higher proportion of virions with very low levels of σ1 (Fig. 1E).
FIG 2.

T3v2 shows reduced binding to L929 cells as a result of having a proportion of virions with no σ1. (A) L929 cells were exposed to equivalent particle numbers of T3wt, T3v1, and T3v2 (at four one-half dilutions) for 1 h at 4°C. Following extensive washing, cell-bound virus was detected by Western blot analysis with antireovirus antibodies. Relative levels of bound virions were extrapolated from polynomial equations generated by T3wt protein band intensities. The histogram shows relative binding values for three independent virus preparations ± standard deviations (significant differences by one-way analysis of variance are indicated [***, P < 0.001]). (B) L929 cells were exposed to T3v1 for 1 h at 4°C. Unbound virus was pelleted at 100,000 × g for 90 min, and equivalent volumes of input and unbound virus fractions were separated by agarose gel electrophoresis. (C) Per-cell binding efficiency quantified by flow cytometry. L929 cells in suspension were either left untreated or treated with neuraminidase and then exposed to equivalent particle numbers of T3wt, T3v1, and T3v2 as described above for panel A. Cell-associated virions were detected with polyclonal antireovirus and Alexa Fluor-conjugated secondary antibodies (APC-A, fluorescence intensity in APC channel). Representative histograms for binding to untreated (top) or neuraminidase-treated (bottom) cells are shown. The bar graph summarizes per-cell binding efficiency relative to that of T3wt on untreated cells (set to 100%) (± standard deviation; n = 3; **, P < 0.01 by one-way analysis of variance). (D) Virions were immunoprecipitated (I.P.) with anti-σ1, antireovirus, or normal NRS, and antibody-bound and supernatant fractions were then subjected to Western blot analysis (WB) with antireovirus, anti-σ3, or anti-σ1, as indicated. Electrophoresis of 1 and 3 sample volumes provided data for qualitative and quantitative assessments of relative band intensities. Percent immunoprecipitation was calculated as the average intensities for reovirus bands immunoprecipitated with anti-σ1 relative to antireovirus, times 100. The histogram shows percent immunoprecipitations for three independent virus preparations (± standard deviations; **, P < 0.01 by one-way analysis of variance). Percent unbound virus represents the average intensities of reovirus bands in the supernatant following immunoprecipitation with anti-σ1 relative to NRS, times 100.
T3wt cell attachment has been shown to depend on σ1-sialic acid binding (41, 49–51). To determine if T3v1 and T3v2 also depend on sialic acid binding, L929 cells were treated with neuraminidase, followed by virion binding at 4°C and subsequent quantification of bound virions by using flow cytometry. Levels of T3wt, T3v1, and T3v2 binding were reduced by 2.9-, 7.5-, and 6.6-fold, respectively, following neuraminidase treatment (Fig. 2C), suggesting that T3v1 and T3v2 rely on sialic acid binding similarly to wild-type reovirus. This is not surprising, since mutations in λ2 of T3v1 and in σ1 of T3v2 are distal from the σ1 neck and head domains implicated in receptor binding and are therefore unlikely to modulate receptor specificity. The increased reliance on sialic acid levels by T3v1 and T3v2, indicated by a more drastic loss of binding upon neuraminidase treatment, may reflect a benefit of higher σ1 levels under conditions where receptor availability is limited.
In congruence with having reduced numbers of virions capable of binding to cells, T3v2 preparations were also found to have a greater proportion of virions devoid of σ1 by immunoprecipitation analysis. Antibodies specific to σ1 were used to separate σ1-containing virions (pellet) from virions devoid of σ1 (supernatant). Polyclonal antireovirus antibodies served as a positive control to pull down all intact virions, while normal rabbit serum (NRS) served as a negative control. The proportion of virions pulled down by σ1- versus reovirus-specific antibodies indicated the fraction of virions that contained σ1 (average percent immunoprecipitation in the antibody-bound fraction) (Fig. 2D). Reciprocally, the proportion of virions that remained in the supernatant after σ1 pulldown, relative to that in NRS, reflected the fraction of virions devoid of σ1 (average percentage in the supernatant) (Fig. 2D). On average, 84.0% ± 16%, 89.7% ± 13.4%, and 42.7% ± 23.1% T3wt, T3v1, and T3v2 viruses, respectively, were immunoprecipitated with σ1-specific antibodies, which mirrored closely the number of virions capable of binding cells (Fig. 2A and C). Specifically, these studies suggested that T3wt has predominantly high levels of σ1, T3v1 virions have 56% fewer σ1 molecules than T3wt but an equivalent cell binding efficiency, and T3v2 preparations contain a mixture of virions containing no σ1 that cannot bind cells and virions with significantly fewer σ1 molecules than T3wt. More generally, these results support that a continuum of structures is possible for reovirus with respect to σ1 levels and demonstrate that variants of reovirus can achieve distinct and heritable levels of σ1 (see Fig. 7).
FIG 7.
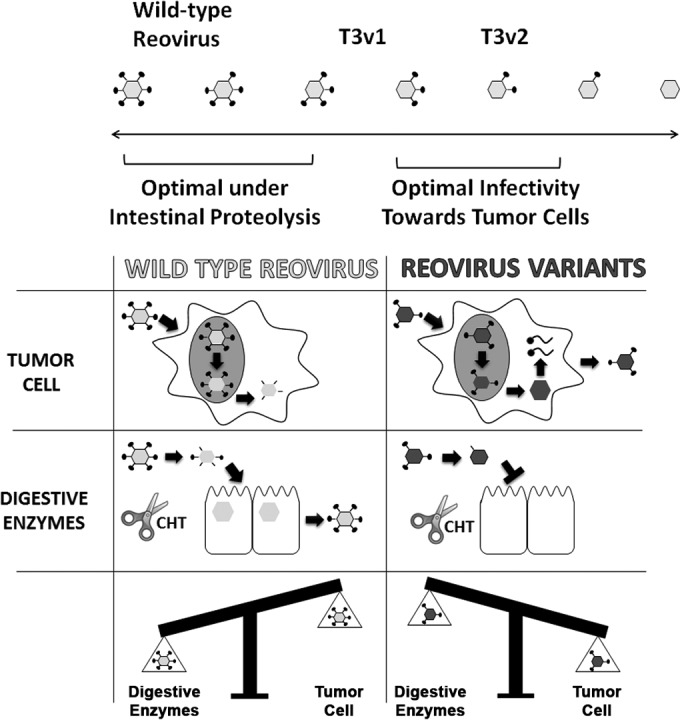
Structural adaptation of reovirus promotes infectivity in a new therapeutic niche. T3v1 and T3v2 exhibit enhanced infectivity toward a panel of cancer cells and antitumor activity in vivo (31). T3v1 and T3v2 have progressively fewer σ1 molecules per virion than does T3wt, with T3v2 also having a higher proportion of σ1-less virions. During intracellular uncoating in tumor cells, reduced σ1 virion levels promote the rapid onset of replication and a 3- to 4-fold increased probability of establishing infection. Conversely, compared to T3wt virus, T3v1 and T3v2 show reduced stability and infectivity, and σ1 retention by T3v2, under conditions that mimic intestinal proteolysis (chymotrypsin [CHT] [scissors]). Optimal infectivity toward natural versus therapeutic niches may therefore require distinct reovirus structures and σ1 levels.
Establishing infection, viral protein synthesis, and progeny virus assembly are likely independent of σ1.
T3v1 and T3v2 exhibit enhanced infectivity toward cancer cells that corresponds with improved in vivo oncolysis relative to that of T3wt (31). While the reduction of σ1 on T3v1 and T3v2 suggested a correlation between virion σ1 levels and infectivity toward transformed cells, it did not establish a direct (causal) relationship. Since previous studies by Larson et al. (36) suggested that reovirus particles with various σ1 levels were equally infectious (as long as they had the 3 σ1 trimers needed for binding), we remained open to the possibility that mutations in T3v1 and T3v2 conferred benefits to reovirus replication beyond simply changing σ1 levels on incoming virions. For example, weaker σ1-λ2 interactions could promote postentry stages of virus replication, such as by stalling the full assembly of progeny cores to favor secondary rounds of macromolecular synthesis. In addition to its well-characterized role in cell binding, σ1 has also been implicated in reovirus-induced apoptosis (52) and may have additional uncharacterized functions. Therefore, to test the effects of σ1 levels on reovirus replication directly (i.e., in the absence of mutations found in T3v1 and T3v2), we evaluated whether reducing σ1 expression by using dicer substrate RNAs (DsiRNAs) affects the infectivity of wild-type reovirus.
The effects of silencing de novo σ1 expression were evaluated by using H1299 lung cancer and A549 lung cancer cells. L929 cells are poorly transfected and were not used for DsiRNA transfection experiments. Fluorescently labeled DsiRNAs showed that 90.4% and 98.8% of A549 and H1299 cells, respectively, were successfully transfected with DsiRNAs (data not shown). DsiRNAs targeting the reovirus S1 genome segment were used to knock down σ1 expression. Silencing of reovirus σ2 served as a positive control, as σ2 is critical for the assembly of progeny cores and knockdown of σ2 was expected to reduce productive infection. DsiRNAs targeting the vaccinia virus genes G7L and F17R (irrelevant to our system) were used as negative controls. Cells transfected with DsiRNAs were allowed to recover for 9 to 13 h prior to infection with wild-type reovirus. Productive infection was then determined at 12 to 15 h p.i., which represents an intermediate time point during the ∼24-h reovirus replication cycle and, importantly, a time point where the percentage of H1299 cells productively infected by reovirus has plateaued (data not shown).
As expected, DsiRNA-mediated knockdown of σ2 (S2-2 and S2-5 DsiRNAs) reduced not only σ2 levels but also the expression levels of other reovirus proteins (μ1C, σ3, and λ1/2) (Fig. 3A), the percentage of cells productively infected (Fig. 3B), the quantity of viral proteins per cell (mean fluorescence intensity [MFI]) (Fig. 3C), and progeny viral titers (Fig. 3D). Knockdown of σ1 by using DsiRNAs was also highly efficient (83 to 95% σ1 loss) in A549 and H1299 cells (Fig. 3A). However, reduced σ1 levels in both cell lines did not alter the expression levels of other reovirus proteins (μ1C, σ3, and λ1/2) (Fig. 3A) or the extent of productive infection (Fig. 3B). These findings suggested that newly synthesized σ1 negligibly affects (positively or negatively) the efficiency of establishing infection or viral protein expression. Moreover, since σ1 depletion by DsiRNAs was below the 2- to 4-fold reduction of σ1-λ2 interactions in T3v1 and T3v2, the reductions of σ1-λ2 associations at postentry steps are unlikely to explain why these variants have improved infectivity.
FIG 3.
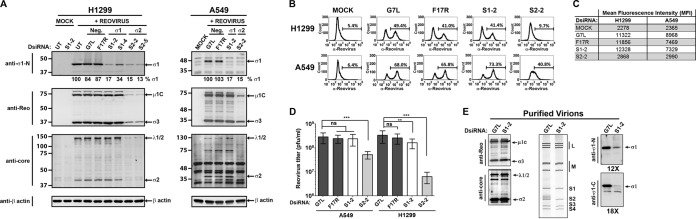
Knockdown of de novo σ1 expression does not alter establishment of productive reovirus infection. H1299 and A549 cells were left untransfected (UT) or transfected with dicer substrate RNAs (DsiRNAs) specific to vaccinia virus F17R and G7L (negative controls), the reovirus S1 genome segment that encodes σ1 (S1-2 and S1-4), or the reovirus S2 genome segment that encodes σ2 (S2-2 and S2-5). At 9 h p.i., cells were either mock infected with medium alone (Mock) or infected with wild-type reovirus (T3wt) at a dose empirically calculated to productively infect ∼40% of cells. (A) At 12 h postinfection, lysates were collected and subjected to Western blot analysis with the antibodies indicated. Relative quantities of σ1 are shown. (B) The percentage of reovirus protein-expressing cells at 12 h p.i. was assessed by flow cytometry with polyclonal antireovirus antibodies. The marker indicates the population of cells staining positive for reovirus protein expression relative to uninfected controls, and the percentage of positive cells is indicated above each marker. (C) Mean fluorescence intensities for the marked populations on the histograms shown in panel B. (D) Total reovirus titers at 12 h p.i. under the conditions specified for two independent experiments, each in duplicate, as determined by a standard plaque assay. ns, not significant; ***, P < 0.001; **, P < 0.01 by one-way analysis of variance. (E) Reovirus particles were purified from H1299 cells transfected with S1-2 or G7L DsiRNA and infected with T3wt at 12 h p.i. by high-speed ultracentrifugation. Virions were subjected to Western blot analysis with the specified antibodies. RNA extracted from purified virions was subjected to SDS-PAGE, and reovirus dsRNAs were visualized by ethidium bromide staining.
Despite the almost complete knockdown of σ1, progeny virus titers remained high in S1-specific DsiRNA (S1-DsiRNA)-transfected cells (Fig. 3D). This was surprising, since progeny virions purified from S1-DsiRNA-transfected and T3wt-infected cells had an almost complete loss of σ1 relative to the other outer capsid structural proteins μ1C and σ3 (Fig. 3E). The purified virions also had a complete dsRNA genome (Fig. 3E), suggesting that DsiRNAs could target S1 mRNAs destined for translation but not RNAs used for the assembly of new virions in viral factories. These findings showed that σ1 levels on wild-type virions could be experimentally adjusted by using S1-specific DsiRNAs.
Reduced σ1 levels on incoming reovirions provide a direct benefit to establishing infection.
Having established a strategy to manipulate σ1 levels on wild-type reovirus, we proceeded to test whether mutations in T3v1 and T3v2 per se are important for increased infectivity or whether the consequential reduction of σ1 on virions was the critical change. To obtain a spectrum of virion-associated σ1 levels, S1-DsiRNAs were mixed with increasing amounts of control G7L DsiRNA, while maintaining a constant total DsiRNA concentration. Similar levels of virions were purified from DsiRNA-transfected, T3wt-infected H1299 cells at all ratios of DsiRNAs, indicated by equivalent levels of the major structural proteins μ1C and σ3 (Fig. 4A). However, as the fraction of S1-DsiRNAs decreased from 33% (condition 1) to 17% (condition 2), 8% (condition 3), 4% (condition 4), 2% (condition 5), or 0% (control condition [condition C]) of total DsiRNA, the level of σ1 on purified virions increased (Fig. 4A). Using agarose gel electrophoresis, we determined the distribution of σ1 levels of virions generated by using S1-DsiRNAs (conditions C, 4, and 1) (Fig. 4B). Under condition C, the number of σ1 trimers on the virions ranged from 12 to 10. The majority of virions generated under condition 4 and condition 1 had between 12 and 5 and between 5 and 0 σ1 trimers, respectively. Although heterogeneous, condition 1 and condition 4 generated virions with progressively lower levels of σ1 trimers than those of virions generated under condition C. Since T3wt was used during the infection, it is important to note that the only difference between virions purified under conditions 1 to 5 and condition C is σ1 levels (Fig. 4B).
FIG 4.

Reduced σ1 levels on wild-type reovirus enhance productive infection. (A and B) H1299 cells transfected with decreasing amounts of S1-2 DsiRNA, from 33% (condition 1) to 17% (condition 2), 8% (condition 3), 4% (condition 4), 2% (condition 5), or 0% (condition C) of total DsiRNA. G7L DsiRNA (negative control) was used to bring the total DsiRNA mixtures to equivalent concentrations under all conditions. (A) Virions were purified by high-speed centrifugation and subjected to Western blot analysis for levels of reovirus proteins, as indicated. Levels of σ1 for T3wt with control G7L DsiRNA are set to 100%, and relative levels of σ1 under other conditions are provided. (B) Following Vertrel extraction, virions were purified by cesium chloride gradient centrifugation, and 5 × 10¹⁰ particles were subjected to agarose gel electrophoresis followed by Coomassie blue staining. (C) One-quarter dilutions of virion preparations from panel A were exposed to L929 cells for 1 h at 4°C, followed by extensive washing. Samples were processed either immediately for assessment of per-cell binding or after 15 h for assessment of the percentage of cells infected with reovirus. After incubation with polyclonal antireovirus antibody and Alexa Fluor-conjugated secondary antibody, samples were analyzed by using flow cytometry. Relative per-cell binding efficiencies were calculated from polynomial equations generated from data for control condition C. Representative histograms for infectivity and binding are shown. (D) To calculate relative infectivity per equivalent bound particle, the percentage of reovirus-infected cells was divided by the per-cell binding efficiency. (E) After 15 h of infection similar to that described above for panel C, immunocytochemical staining was performed to visualize reovirus-infected cells by using polyclonal antireovirus antibody. Representative data from 3 independent virus preparations are shown.
Purified virions under each S1-DsiRNA condition were assessed for binding and infectivity (Fig. 4C). Virion binding per cell was assessed by using flow cytometry following virus incubation with L929 cells in suspension at 4°C. As the concentration of S1-DsiRNA increased from condition 5 to condition 1, per-cell virion binding was reduced relative to that under condition C. Virions under condition 1 had ∼30% binding per cell compared to virions under condition C. Since agarose gel electrophoresis demonstrated that a majority of virions under condition 1 had very low σ1 levels, reduced binding was expected (Fig. 4B and C). The percentage of reovirus-infected cells was determined at 15 h p.i. by using flow cytometry. Conditions 1 to 5 generated virions with infectivity greater than that under condition C, with virions under condition 4 having the highest infectivity (Fig. 4C). Immunocytochemical staining confirmed that virions with reduced σ1 levels under conditions 4 and 5 established infection in a high proportion of cells relative to the control (Fig. 4E). Assessment of virion binding and infectivity per cell enabled the calculation of specific infectivity per equivalent cell-bound particle. The fold increase in virion infectivity was directly proportional to the reduction in σ1 levels. Bound virions under condition 1 were 4.8-fold more infectious than those under condition C (Fig. 4D). Results similar to those described above were found for virions generated from S1-DsiRNA transfection in A549 cells (data not shown). Together, this work demonstrated that reduced virion-associated σ1 levels can directly promote infectivity of reovirus toward L929 cells. The optimal level of σ1, which was 3- to 4-fold lower than that for the wild type, reflected a balance between having sufficiently high quantities of σ1 for cell binding and having sufficiently low quantities to promote infectivity. Furthermore, since the genomes of T3wt virions with fewer σ1 molecules were of wild-type sequence, these findings suggested that reduced σ1 levels confer a benefit to incoming virions in the primary stages of reovirus replication.
Relative to T3wt, T3v1 and T3v2 exhibit similar rates of uncoating during intracellular proteolysis but achieve loss of σ1 early.
The increased infectivity of reovirions with reduced levels of σ1 molecules suggested that incoming virions achieved some benefit during early steps of establishing infection. Previously, T3v1 and T3v2 were shown to produce ∼3-fold-higher levels of viral RNAs than those of T3wt at 6 h postinfection (p.i.) (31). These findings suggested that fewer σ1 trimers (or weaker σ1-λ2 interactions) might enhance the entry of reovirus or the transition from fully assembled virions into transcriptionally active core particles. Other laboratories have characterized mutations in the reovirus outer capsid proteins σ3 and μ1C that enhance the proteolysis of outer capsid proteins and promote disassembly under in vitro conditions (53–55). We sought to determine whether T3v1 and T3v2 might similarly exhibit improved disassembly and thereby enhance infectivity.
Reovirus capsid disassembly is mediated by intestinal trypsin or chymotrypsin during natural enteric infection or by lysosomal proteases (cathepsins B, S, and L) (6, 7) during infection of cultured cells (Fig. 5A) (reviewed in reference 2). The transition from whole virions to transcription-competent cores requires the complete degradation of the σ3 outer capsid protein and cleavage of the underlying μ1C to the membrane-penetrating δ fragment, to produce infectious subviral particles (ISVPs). As δ is removed from ISVPs during membrane penetration, a conformational shift triggers the “opening” of λ2 turrets, release of σ1, and activation of the inner core λ3 polymerase. At this point, the partially uncoated virion (core) can transcribe and release progeny RNAs for the onset of replication. In addition to monitoring σ3 and μ1C processing, we required an assay that also monitors the release of δ and σ1 from virions during core formation, which could be promoted by a weaker σ1-λ2 association.
We first established a strategy to monitor the cleavage and release of σ1 trimers from T3wt reovirions using in vitro proteolysis with chymotrypsin and then applied this strategy to investigate σ1 release during cell culture infection. At incremental times during in vitro proteolysis, virion-associated versus dissociated proteins were separated by high-speed ultracentrifugation (Fig. 5B). σ3 was removed from reovirions and degraded completely, followed by the cleavage of μ1C to δ and complete degradation of the δ fragment. Antibodies specific to the C-terminal head versus the N-terminal tail of σ1 demonstrated that σ1 was first cleaved into two similar-sized fragments (σ1-N1 and σ1-C1) (Fig. 5B), as was previously demonstrated for some strains of reovirus (10, 56, 57). Importantly, the σ1 head and σ1 tail were both released from T3wt virions in vitro, discerned by their increased proportions in supernatants versus virion pellet fractions. σ1 was also further processed into a smaller C-terminal fragment (σ1-N2) coincident with release, suggesting that a protease-sensitive region is exposed when the σ1 tail dissociates from virions.
The cleavage-and-release assay was then adapted to monitor reovirus disassembly within cells at different times postinfection (Fig. 5C). T3wt, T3v1, and T3v2 virions were bound to L929 cells at 4°C to achieve similar cell-bound particle equivalents. Viruses were then permitted to uncoat at 37°C for 0, 2, 4, and 6 h and assessed for outer capsid protein (σ1, σ3, and μ1C) cleavage and release. As a control, the inner capsid proteins λ1 and σ2 fractionated exclusively with the virion pellet and sustained relatively stable levels, supporting the integrity of virion cores during disassembly. The efficiency of μ1C-to-δ cleavage for T3v1 and T3v2 was similar to that for T3wt. Distinct from in vitro conditions, the δ fragment dissociated from reovirions that accumulated in the supernatant fraction rather than undergoing complete degradation, suggesting protection from further proteolysis likely attributed to insertion into lysosomal membranes or dissociation in the cytoplasm. The efficiencies of δ release, calculated as the percentage of μ1C plus δ in the supernatant versus total (pellet plus supernatant) fractions, were similar for T3wt, T3v1, and T3v2. These results suggest that mutations in T3v1 and T3v2 do not promote the rate of intracellular outer capsid disassembly.
The cleavage and release of σ1 were also monitored with tail- and head-specific antibodies. Cleavage of σ1 into N- and C-terminal fragments was almost complete by 2 h of infection. The N-terminal σ1 tail was not cleaved to the smaller σ1-N2 fragment seen in vitro, in agreement with the paradigm that σ1 is released from virions after penetration into the cytoplasm. All three viruses also released the σ1 tail fragment into the supernatant fraction between 4 and 6 h p.i. However, because they started with fewer σ1 molecules per virion, T3v1 and T3v2 had >50% fewer σ1 tails occluding their vertices at 4 h p.i. than did T3wt. Since the cleavage and release of the other outer capsid proteins (σ3, μ1C, and δ) were similar among the three viruses, the early depletion of σ1 in itself likely accounts for the increased viral RNA synthesis by T3v1 and T3v2 between 3 and 6 h postinfection (31).
Reovirus variants with reduced σ1 levels show decreased stability and infectivity under conditions that mimic intestinal proteolysis.
A fundamental question was raised by the findings that T3v1 and T3v2 have an improved capacity to productively infect cells: why are reduced σ1 levels on virions not the dominant phenotype in natural reovirus populations? Even early studies by Larson et al. found that wild-type reovirus was a mixed population without bias toward fewer σ1 molecules per virion (36). To explore this question, we queried the fate of T3wt versus T3v1 and T3v2 under conditions that mimic natural infection of the intestine or respiratory tract, where reovirus particles are exposed to extracellular proteases that facilitate uncoating (48, 58, 59).
In vitro digestion of T3wt, T3v1, and T3v2 particles with chymotrypsin was used to recapitulate intestinal proteolysis. Virion particle numbers were standardized by quantitative Western blot analysis, and particles were treated with a common chymotrypsin concentration (Fig. 6A). Aliquots were removed at intermittent times, reactions were terminated with protease inhibitors, virions were analyzed for outer capsid digestion by SDS-PAGE and Coomassie blue staining (Fig. 6A), and infectivity was analyzed by plaque titration (Fig. 6B) and/or the release of σ1 following high-speed centrifugation and Western blot analysis (Fig. 6C). Despite having similar rates of uncoating within cells (Fig. 5C), T3v1 and T3v2 showed faster uncoating (i.e., cleavage of μ1C to δ and transition to cores) when exposed to chymotrypsin (Fig. 6A). Moreover, although titers varied between independent experiments, the overall trend suggested that both variants lost infectivity more rapidly than did T3wt (Fig. 6B). Note that the initial increase in PFU at 15 min of chymotrypsin digestion is common with the production of ISVPs, since δ promotes direct membrane penetration (8, 9). As explored in Discussion, the reduced stability of T3v1 and T3v2 under chymotrypsin treatment might reflect a fitness cost during natural enteric or respiratory tract infection and could explain the preservation of higher σ1 levels per virion in the natural reovirus population.
FIG 6.

Reovirus variants with reduced σ1 levels show decreased stability and infectivity under intestinal proteolysis conditions. CsCl-purified T3wt, T3v1, and T3v2 reovirus preparations were diluted to equal particle numbers based on band intensities of μ1C and σ3 during quantitative gel electrophoresis. A total of 5 × 10¹² particles/ml (estimated by the OD260) were treated with 14 μg/ml chymotrypsin for the indicated durations. (A) Degradation of σ3 and μ1C cleavage to δ, as hallmarks of reovirus outer capsid disassembly, were monitored by SDS-PAGE and Coomassie blue staining. The core proteins σ2 and λ1/2 remained intact. (B) Titers of T3v1, T3v2, and T3wt following chymotrypsin digestion were determined by plaque titration on L929 cells. The percentage of virus titers remaining after chymotrypsin digestion, relative to that in untreated samples (100%), was calculated for three independent experiments. Differences in means found to be significant by analysis of variance and Bonferroni's multiple-comparison test are indicated (*, P < 0.05; **, P < 0.01; ***, P < 0.001). (C) Cleavage and release of σ1 following chymotrypsin digestion of T3v1, T3v2, and T3wt were monitored by Western blot analysis with head- and tail-specific σ1 antibodies. Virus-associated and dissociated proteins were purified by high-speed centrifugation, as described in the legend of Fig. 3C. Results are representative of four independent experiments. (D) Cores produced at 120 min of chymotrypsin digestion (under conditions similar to those described above for panel C) were purified by high-speed centrifugation and restandardized to equal core numbers for T3wt, T3v1, and T3v2 by electrophoresis and Coomassie blue staining. Equivalent numbers of cores were then subjected to in vitro transcription reactions for 0, 90, and 180 min. Reactions were terminated with an equal volume of TRIzol spiked with GFP mRNA, to permit normalization following RNA extraction and cDNA synthesis. Levels of reovirus S4 relative to GFP RNA levels were monitored by quantitative reverse transcription-PCR and are presented as means ± standard deviations (n = 3 for T3wt and T3v1; n = 2 for T3v2). One-way analysis of variance with Bonferroni's multiple-comparison test indicates significant differences between T3wt and T3v1 (P < 0.05) and between T3wt and T3v2 (P < 0.01) at 180 min. Transcription reaction mixtures with T3wt cores in the absence of ATP served as negative controls. (E, left) Equal numbers of T3wt, T3v1, and T3v2 (as described above for panel D) were added to H1299 cells in the presence or absence of the transfection reagent Lipofectamine 2000. At 15 h p.i., cells were paraformaldehyde fixed and stained with reovirus-specific antibodies. The proportion of cells positive for reovirus protein expression by flow cytometry is indicated. (Right) Percent infection by cores in the presence of the transfection reagent for two independent experiments, with two core-to-Lipofectamine 2000 ratios per experiment. Significant differences in means (line) determined by analysis of variance and Bonferroni's multiple-comparison test are indicated.
The rates of σ1 dissociation of T3wt, T3v1, and T3v2 were compared. For both T3wt and T3v2, σ1 molecules were cleaved into σ1 head and tail fragments, which progressively moved into virion-dissociated supernatant fractions following high-speed centrifugation (Fig. 6C). An unexpected but highly reproducible finding was that the σ1 tail did not dissociate from T3v1 particles. This finding suggests a unique structure for T3v1 relative to T3v2 and T3wt upon chymotrypsin digestion, one that continues to “trap” σ1 trimers within λ2 turrets. Since the structure of cores cannot be easily deduced, two indirect assays were utilized to explore possible implications of chymotrypsin digestion in core structures of T3wt, T3v2, and T3v2. Pure reovirus cores were previously shown to be competent for viral RNA synthesis in vitro (38). T3wt, T3v1, and T3v2 cores purified after 120 min of chymotrypsin digestion were therefore repurified, restandardized to equal particle numbers by quantitative Western blot analysis, and subjected to in vitro transcription reactions. At 0, 90, and 180 min, reactions were terminated with TRIzol, reaction mixtures were spiked with a constant dose of in vitro-synthesized GFP mRNA for normalization, and total RNA was extracted. Quantitative reverse transcription-PCR was performed for reovirus S4 RNAs and GFP RNAs. Reactions performed in the absence of ATP served as negative controls and resulted in S4 RNA levels similar to those obtained at 0 h. By 180 min, T3wt cores produced by chymotrypsin digestion exhibited significantly more transcription activity than did both T3v1 and T3v2 cores (Fig. 6D).
Finally, we tested the extent of productive infection established by T3wt, T3v1, and T3v2 cores (Fig. 6E). Since core particles cannot penetrate cellular membranes and are therefore not directly infectious, delivery into H1299 cell cytoplasm was mediated by Lipofectamine 2000 (Invitrogen). In the absence of a transfection reagent, cells did not become productively infected, demonstrating a lack of contamination by whole virions and ISVPs. In the presence of a transfection reagent, T3wt cores displayed an improved capacity to establish productive infection over T3v1 and T3v2 cores produced in vitro. Interestingly, the ability of T3v1 cores to establish infection at all, given the retention of σ1 (Fig. 6C) and low transcription activity (Fig. 6D), suggests that the cationic liposome-forming quality of Lipofectamine 2000 and/or intracellular conditions likely promoted the release of the σ1 necessary for reovirus RNA synthesis. Overall, these results suggest that chymotrypsin imposes distinct structural changes on T3v1 and T3v2, relative to wild-type reovirus and relative to intracellular proteolysis. Moreover, while T3v1 and T3v2 were more infectious toward tumor cells due to reduced σ1 levels, they exhibited a more rapid loss of infectivity under conditions that mimic intestinal proteolysis.
DISCUSSION
Reovirus variants T3v1 and T3v2 were previously found to exhibit enhanced infectivity toward numerous cancer cell lines in vitro and improved tumor clearance in vivo (31). The current analysis demonstrated that T3v1 and T3v2 achieve a more optimal number of σ1 molecules per virion to establish infection in tumor cells, where proteolytic disassembly occurs intracellularly (Fig. 7). In contrast, T3v1 and T3v2 showed a more rapid loss of infectivity when exposed to intestinal extracellular proteolysis conditions. These studies indicate that the optimal number of σ1 molecules on reovirus particles depends on the mode of infection and can be heritably fine-tuned through mutations in the N-terminal tail of σ1 or the flap domain of λ2.
To establish infection, reovirus must partially uncoat into transcriptionally active core particles devoid of σ1. Since reovirus vertices become unoccluded sooner for T3v1 and T3v2 in our uncoating assays, the simplest explanation for why reduced σ1 levels favor reovirus infectivity during intracellular uncoating is that establishing infection is a time-sensitive event. Since numerous studies have demonstrated complex conformational changes coincident with reovirus core formation (60–67), it is also possible that λ2 turrets that never associate with σ1 are better “poised” to achieve the “transcriptionally active state.” Either a faster or more complete transition to transcriptionally active cores would account for the increased levels of reovirus RNA synthesized at 6 h p.i. by T3v1 and T3v2 relative to those of T3wt and the increased probability of establishing infection (31).
Several publications dating as far back as 1968 (48) and as recent as 1998 (37) suggest approximately complete occupancy of reovirus vertices by σ1 trimers using 3H and 35S amino acid stoichiometric analysis. The finding by Larson et al. that reovirus preparations consist of particles with 0 to 12 σ1 trimers was the first indication (to our knowledge) that σ1 levels can vary on particles. Recently, Nygaard et al. thoroughly compared the pathogeneses of two reovirus isolates in a murine model of respiratory infection (68). Differences in pathogenesis were attributed to two polymorphisms in σ1: one in the tail region (nucleotide 77) that produces an amino acid change in both σ1 and the second overlapping nonstructural protein σ1-small (σ1s) and one in the head domain of σ1. Their analysis showed a clear influence of σ1s on pathogenesis, but intriguingly, the less pathogenic isolate (T3DF) also had fewer σ1 molecules. It would therefore be interesting to revisit the status and implication of σ1 levels in other natural and laboratory-adapted strains of reovirus.
Reovirus evolved under gastrointestinal and respiratory selective pressures (69), has high seroprevalence (70), and is seemingly well adapted for these natural routes of infection. The discovery that T3v1 and T3v2 variants replicate more efficiently than T3wt in cell culture and animal tumors raised an interesting question: why did these mutations (or low σ1 levels per virion) not naturally prevail among reovirus quasispecies? To begin addressing the implication of mutations in T3v1 and T3v2 for natural enteric infections, T3v1, T3v2, and T3wt were treated with the intestinal protease chymotrypsin. During chymotrypsin digestions, T3v1 and T3v2 disassembly intermediates had a more rapid loss of infectivity and characteristics distinct from those of T3wt, such as σ1 retention by T3v1. Nibert et al. (56) previously found that concomitant with chymotrypsin-mediated σ1 cleavage, reovirus serotype 3 Dearing lost the capacity for efficient cell binding and infectivity. The rapid loss of infectivity of T3v1 and T3v2 upon chymotrypsin treatment may therefore also reflect the reduced levels of σ1 and, therefore, increased vulnerability to the unfavorable effects of σ1 cleavage. When uncoating intracellularly, the negative effects of σ1 cleavage on binding would be overcome, allowing the benefits of reduced σ1 levels for establishing infection to prevail.
The need to be highly stable in the extracellular environment yet sufficiently unstable to disassemble within cells presents an essential paradox for all viruses. All three viruses showed similar thermal stabilities by differential scanning fluorimetry (data not shown) and disassembled with equal efficiencies during intracellular uncoating, emphasizing the distinct response to chymotrypsin proteolysis. Unique reovirus structures may be required to achieve an optimal balance, depending on the mode of uncoating (i.e., intracellular versus extracellular). Since T3v2 has a single mutation that impacts σ1 only and provides a heritable means to reduce σ1 levels on virions at each stage of replication, comparison to T3wt during natural infection in vivo (peroral [59, 71] or intranasal [68] models) could directly address the role of σ1 levels on virions in natural routes of infection.
It remains a mystery why T3v1 cores generated by chymotrypsin continue to trap σ1 (Fig. 6C) and whether this represents a biologically relevant disassembly intermediate during the transition of reovirus ISVPs to cores. Chandran et al. found no major differences by cryo-transmission electron microscopy (TEM) in the arrangement of core proteins μ1 and λ3 and core-facing domains of λ2 among reovirions reconstituted in vitro in the presence or absence of σ1 (72), so it is likely that in addition to reducing σ1 levels, mutations in T3v1 and T3v2 contribute to conformational differences that impinge on proteolysis by chymotrypsin. We predict that when disassembly to cores is mediated exclusively by chymotrypsin, the mutation in the T3v1 λ2 flap domain restricts λ2 “opening” and the release of σ1. Furthermore, since σ1 could easily dissociate from T3v1 particles during intracellular uncoating (Fig. 5C), our findings suggest that the chymotrypsin-mediated transition to cores may impose distinct changes of the virion structure (e.g., opening of λ2 turrets in T3v1) compared to core formation resulting from intracellular cathepsin-mediated proteolysis and membrane penetration-induced uncoating. Such differences may reflect unique specificities of the proteases and/or the contribution of membranes versus degradation as a means of completely removing outer capsid proteins. Accordingly, it would also be interesting to compare high-resolution structures of T3v1, T3v2, and T3wt disassembly intermediates generated by extracellular versus intracellular uncoating conditions.
Finally, while current human clinical trials focus on wild-type reovirus, the possibility of using “next-generation” reovirus variants to promote the specificity and/or efficiency of oncolysis warrants consideration. In addition to T3v1 and T3v2, other reovirus variants with attributes favorable for oncolytic therapy have been described. For example, reovirus with a truncated σ1 (i.e., devoid of the JAM binding head domain) was demonstrated to have infectivity equal to that of wild-type reovirus in cancer cells, with reduced host toxicity (73). Reovirus mutants with increased sensitivity to interferon (IFN) may also provide improved specificity for IFN-insensitive cancers over normal cells (17). While the already well-defined nonpathogenic nature of wild-type reovirus in humans provides a strong premise for its continued application, other oncolytic viruses, such as vaccinia and herpes simplex viruses, have demonstrated the benefit of genetic modification for improving specificity and potency. Since T3v1 and T3v2 have demonstrated in vivo oncolytic enhancement over wild-type reovirus (31), and as their mechanism for improved infectivity toward transformed cells is now understood, the utility of these variants to improve reovirus oncolysis seems promising.
ACKNOWLEDGMENTS
We thank Patrick Lee and Terence Dermody for generously supplying critical antireovirus and anti-σ1 head antibodies and for valued discussions on reovirus biology. We are grateful to Jim Smiley and Don Stoltz for critical readings of the manuscript. We thank Dorothy Kratochwil-Otto for assistance with flow cytometry and other members of our laboratory and members of the laboratories of David Evans and Mary Hitt for sharing expertise and reagents.
REFERENCES
- 1.Dermody TS, Parker JS, Sherry B. 2013. Orthoreoviruses, p 1305–1347. In Knipe DM, Howley PM, Cohen JI, Griffin DE, Lamb RA, Martin MA, Racaniello VR, Roizman B (ed), Fields virology, 6th ed Lippincott Williams & Wilkins, Philadelphia, PA. [Google Scholar]
- 2.Danthi P, Guglielmi KM, Kirchner E, Mainou B, Stehle T, Dermody TS. 2010. From touchdown to transcription: the reovirus cell entry pathway. Curr Top Microbiol Immunol 343:91–119. doi: 10.1007/82_2010_32. [DOI] [PMC free article] [PubMed] [Google Scholar]
- 3.Danthi P, Holm GH, Stehle T, Dermody TS. 2013. Reovirus receptors, cell entry, and proapoptotic signaling. Adv Exp Med Biol 790:42–71. doi: 10.1007/978-1-4614-7651-1_3. [DOI] [PMC free article] [PubMed] [Google Scholar]
- 4.Helander A, Silvey KJ, Mantis NJ, Hutchings AB, Chandran K, Lucas WT, Nibert ML, Neutra MR. 2003. The viral sigma1 protein and glycoconjugates containing alpha2-3-linked sialic acid are involved in type 1 reovirus adherence to M cell apical surfaces. J Virol 77:7964–7977. doi: 10.1128/JVI.77.14.7964-7977.2003. [DOI] [PMC free article] [PubMed] [Google Scholar]
- 5.Barton ES, Forrest JC, Connolly JL, Chappell JD, Liu Y, Schnell FJ, Nusrat A, Parkos CA, Dermody TS. 2001. Junction adhesion molecule is a receptor for reovirus. Cell 104:441–451. doi: 10.1016/S0092-8674(01)00231-8. [DOI] [PubMed] [Google Scholar]
- 6.Ebert DH, Deussing J, Peters C, Dermody TS. 2002. Cathepsin L and cathepsin B mediate reovirus disassembly in murine fibroblast cells. J Biol Chem 277:24609–24617. doi: 10.1074/jbc.M201107200. [DOI] [PubMed] [Google Scholar]
- 7.Golden JW, Bahe JA, Lucas WT, Nibert ML, Schiff LA. 2004. Cathepsin S supports acid-independent infection by some reoviruses. J Biol Chem 279:8547–8557. doi: 10.1074/jbc.M309758200. [DOI] [PubMed] [Google Scholar]
- 8.Spendlove RS, Schaffer FL. 1965. enzymatic enhancement of infectivity of reovirus. J Bacteriol 89:597–602. [DOI] [PMC free article] [PubMed] [Google Scholar]
- 9.Nibert ML, Odegard AL, Agosto MA, Chandran K, Schiff LA. 2005. Putative autocleavage of reovirus mu1 protein in concert with outer-capsid disassembly and activation for membrane permeabilization. J Mol Biol 345:461–474. doi: 10.1016/j.jmb.2004.10.026. [DOI] [PubMed] [Google Scholar]
- 10.Chappell JD, Barton ES, Smith TH, Baer GS, Duong DT, Nibert ML, Dermody TS. 1998. Cleavage susceptibility of reovirus attachment protein sigma1 during proteolytic disassembly of virions is determined by a sequence polymorphism in the sigma1 neck. J Virol 72:8205–8213. [DOI] [PMC free article] [PubMed] [Google Scholar]
- 11.Coffey MC, Strong JE, Forsyth PA, Lee PW. 1998. Reovirus therapy of tumors with activated Ras pathway. Science 282:1332–1334. doi: 10.1126/science.282.5392.1332. [DOI] [PubMed] [Google Scholar]
- 12.Strong JE, Coffey MC, Tang D, Sabinin P, Lee PW. 1998. The molecular basis of viral oncolysis: usurpation of the Ras signaling pathway by reovirus. EMBO J 17:3351–3362. doi: 10.1093/emboj/17.12.3351. [DOI] [PMC free article] [PubMed] [Google Scholar]
- 13.Marcato P, Shmulevitz M, Pan D, Stoltz D, Lee PW. 2007. Ras transformation mediates reovirus oncolysis by enhancing virus uncoating, particle infectivity, and apoptosis-dependent release. Mol Ther 15:1522–1530. doi: 10.1038/sj.mt.6300179. [DOI] [PubMed] [Google Scholar]
- 14.Alain T, Kim TS, Lun X, Liacini A, Schiff LA, Senger DL, Forsyth PA. 2007. Proteolytic disassembly is a critical determinant for reovirus oncolysis. Mol Ther 15:1512–1521. doi: 10.1038/sj.mt.6300207. [DOI] [PMC free article] [PubMed] [Google Scholar]
- 15.Smakman N, van den Wollenberg DJ, Borel RI, Hoeben RC, Kranenburg O. 2005. Sensitization to apoptosis underlies KrasD12-dependent oncolysis of murine C26 colorectal carcinoma cells by reovirus T3D. J Virol 79:14981–14985. doi: 10.1128/JVI.79.23.14981-14985.2005. [DOI] [PMC free article] [PubMed] [Google Scholar]
- 16.Shmulevitz M, Pan LZ, Garant K, Pan D, Lee PW. 2010. Oncogenic Ras promotes reovirus spread by suppressing IFN-beta production through negative regulation of RIG-I signaling. Cancer Res 70:4912–4921. doi: 10.1158/0008-5472.CAN-09-4676. [DOI] [PubMed] [Google Scholar]
- 17.Rudd P, Lemay G. 2005. Correlation between interferon sensitivity of reovirus isolates and ability to discriminate between normal and Ras-transformed cells. J Gen Virol 86:1489–1497. doi: 10.1099/vir.0.80628-0. [DOI] [PubMed] [Google Scholar]
- 18.Errington F, White CL, Twigger KR, Rose A, Scott K, Steele L, Ilett LJ, Prestwich R, Pandha HS, Coffey M, Selby P, Vile R, Harrington KJ, Melcher AA. 2008. Inflammatory tumour cell killing by oncolytic reovirus for the treatment of melanoma. Gene Ther 15:1257–1270. doi: 10.1038/gt.2008.58. [DOI] [PMC free article] [PubMed] [Google Scholar]
- 19.Etoh T, Himeno Y, Matsumoto T, Aramaki M, Kawano K, Nishizono A, Kitano S. 2003. Oncolytic viral therapy for human pancreatic cancer cells by reovirus. Clin Cancer Res 9:1218–1223. [PubMed] [Google Scholar]
- 20.Hirasawa K, Nishikawa SG, Norman KL, Alain T, Kossakowska A, Lee PW. 2002. Oncolytic reovirus against ovarian and colon cancer. Cancer Res 62:1696–1701. [PubMed] [Google Scholar]
- 21.Ikeda Y, Nishimura G, Yanoma S, Kubota A, Furukawa M, Tsukuda M. 2004. Reovirus oncolysis in human head and neck squamous carcinoma cells. Auris Nasus Larynx 31:407–412. doi: 10.1016/j.anl.2004.07.003. [DOI] [PubMed] [Google Scholar]
- 22.Norman KL, Coffey MC, Hirasawa K, Demetrick DJ, Nishikawa SG, DiFrancesco LM, Strong JE, Lee PW. 2002. Reovirus oncolysis of human breast cancer. Hum Gene Ther 13:641–652. doi: 10.1089/10430340252837233. [DOI] [PubMed] [Google Scholar]
- 23.Comins C, Spicer J, Protheroe A, Roulstone V, Twigger K, White CM, Vile R, Melcher A, Coffey MC, Mettinger KL, Nuovo G, Cohn DE, Phelps M, Harrington KJ, Pandha HS. 2010. REO-10: a phase I study of intravenous reovirus and docetaxel in patients with advanced cancer. Clin Cancer Res 16:5564–5572. doi: 10.1158/1078-0432.CCR-10-1233. [DOI] [PMC free article] [PubMed] [Google Scholar]
- 24.Forsyth P, Roldan G, George D, Wallace C, Palmer CA, Morris D, Cairncross G, Matthews MV, Markert J, Gillespie Y, Coffey M, Thompson B, Hamilton M. 2008. A phase I trial of intratumoral administration of reovirus in patients with histologically confirmed recurrent malignant gliomas. Mol Ther 16:627–632. doi: 10.1038/sj.mt.6300403. [DOI] [PubMed] [Google Scholar]
- 25.Harrington KJ, Karapanagiotou EM, Roulstone V, Twigger KR, White CL, Vidal L, Beirne D, Prestwich R, Newbold K, Ahmed M, Thway K, Nutting CM, Coffey M, Harris D, Vile RG, Pandha HS, Debono JS, Melcher AA. 2010. Two-stage phase I dose-escalation study of intratumoral reovirus type 3 Dearing and palliative radiotherapy in patients with advanced cancers. Clin Cancer Res 16:3067–3077. doi: 10.1158/1078-0432.CCR-10-0054. [DOI] [PMC free article] [PubMed] [Google Scholar]
- 26.Karapanagiotou EM, Roulstone V, Twigger K, Ball M, Tanay M, Nutting C, Newbold K, Gore ME, Larkin J, Syrigos KN, Coffey M, Thompson B, Mettinger K, Vile RG, Pandha HS, Hall GD, Melcher AA, Chester J, Harrington KJ. 2012. Phase I/II trial of carboplatin and paclitaxel chemotherapy in combination with intravenous oncolytic reovirus in patients with advanced malignancies. Clin Cancer Res 18:2080–2089. doi: 10.1158/1078-0432.CCR-11-2181. [DOI] [PMC free article] [PubMed] [Google Scholar]
- 27.Lolkema MP, Arkenau HT, Harrington K, Roxburgh P, Morrison R, Roulstone V, Twigger K, Coffey M, Mettinger K, Gill G, Evans TR, De Bono JS. 2011. A phase I study of the combination of intravenous reovirus type 3 Dearing and gemcitabine in patients with advanced cancer. Clin Cancer Res 17:581–588. doi: 10.1158/1078-0432.CCR-10-2159. [DOI] [PubMed] [Google Scholar]
- 28.Vidal L, Pandha HS, Yap TA, White CL, Twigger K, Vile RG, Melcher A, Coffey M, Harrington KJ, Debono JS. 2008. A phase I study of intravenous oncolytic reovirus type 3 Dearing in patients with advanced cancer. Clin Cancer Res 14:7127–7137. doi: 10.1158/1078-0432.CCR-08-0524. [DOI] [PubMed] [Google Scholar]
- 29.White CL, Twigger KR, Vidal L, De Bono JS, Coffey M, Heinemann L, Morgan R, Merrick A, Errington F, Vile RG, Melcher AA, Pandha HS, Harrington KJ. 2008. Characterization of the adaptive and innate immune response to intravenous oncolytic reovirus (Dearing type 3) during a phase I clinical trial. Gene Ther 15:911–920. doi: 10.1038/gt.2008.21. [DOI] [PubMed] [Google Scholar]
- 30.Gollamudi R, Ghalib MH, Desai KK, Chaudhary I, Wong B, Einstein M, Coffey M, Gill GM, Mettinger K, Mariadason JM, Mani S, Goel S. 2010. Intravenous administration of Reolysin, a live replication competent RNA virus is safe in patients with advanced solid tumors. Invest New Drugs 28:641–649. doi: 10.1007/s10637-009-9279-8. [DOI] [PMC free article] [PubMed] [Google Scholar]
- 31.Shmulevitz M, Gujar SA, Ahn DG, Mohamed A, Lee PW. 2012. Reovirus variants with mutations in S1 and L2 genome segments exhibit enhanced virion infectivity and superior oncolysis. J Virol 86:7403–7413. doi: 10.1128/JVI.00304-12. [DOI] [PMC free article] [PubMed] [Google Scholar]
- 32.Shmulevitz M, Marcato P, Lee PW. 2010. Activated Ras signaling significantly enhances reovirus replication and spread. Cancer Gene Ther 17:69–70. doi: 10.1038/cgt.2009.46. [DOI] [PubMed] [Google Scholar]
- 33.Sabin AB. 1959. Reoviruses. A new group of respiratory and enteric viruses formerly classified as ECHO type 10 is described. Science 130:1387–1389. [DOI] [PubMed] [Google Scholar]
- 34.Ramos-Alvarez M, Sabin AB. 1958. Enteropathogenic viruses and bacteria; role in summer diarrheal diseases of infancy and early childhood. JAMA 167:147–156. doi: 10.1001/jama.1958.02990190001001. [DOI] [PubMed] [Google Scholar]
- 35.Mendez II, Hermann LL, Hazelton PR, Coombs KM. 2000. A comparative analysis of Freon substitutes in the purification of reovirus and calicivirus. J Virol Methods 90:59–67. doi: 10.1016/S0166-0934(00)00217-2. [DOI] [PubMed] [Google Scholar]
- 36.Larson SM, Antczak JB, Joklik WK. 1994. Reovirus exists in the form of 13 particle species that differ in their content of protein sigma 1. Virology 201:303–311. doi: 10.1006/viro.1994.1295. [DOI] [PubMed] [Google Scholar]
- 37.Coombs KM. 1998. Stoichiometry of reovirus structural proteins in virus, ISVP, and core particles. Virology 243:218–228. doi: 10.1006/viro.1998.9061. [DOI] [PubMed] [Google Scholar]
- 38.Banerjee AK, Shatkin AJ. 1970. Transcription in vitro by reovirus-associated ribonucleic acid-dependent polymerase. J Virol 6:1–11. [DOI] [PMC free article] [PubMed] [Google Scholar]
- 39.Shmulevitz M, Teicher C, Mohamed A. 2012. Reduced sigma1-virion association favours reovirus infectivity towards tumour cells, abstr W1-06, p 28 Abstr 11th Int Symp Double Stranded RNA Viruses, San Juan, Puerto Rico. [Google Scholar]
- 40.Banerjea AC, Brechling KA, Ray CA, Erikson H, Pickup DJ, Joklik WK. 1988. High-level synthesis of biologically active reovirus protein sigma 1 in a mammalian expression vector system. Virology 167:601–612. doi: 10.1016/0042-6822(88)90123-7. [DOI] [PubMed] [Google Scholar]
- 41.Barton ES, Connolly JL, Forrest JC, Chappell JD, Dermody TS. 2001. Utilization of sialic acid as a coreceptor enhances reovirus attachment by multistep adhesion strengthening. J Biol Chem 276:2200–2211. doi: 10.1074/jbc.M004680200. [DOI] [PubMed] [Google Scholar]
- 42.Duncan R, Horne D, Strong JE, Leone G, Pon RT, Yeung MC, Lee PW. 1991. Conformational and functional analysis of the C-terminal globular head of the reovirus cell attachment protein. Virology 182:810–819. doi: 10.1016/0042-6822(91)90622-I. [DOI] [PubMed] [Google Scholar]
- 43.Furlong DB, Nibert ML, Fields BN. 1988. Sigma 1 protein of mammalian reoviruses extends from the surfaces of viral particles. J Virol 62:246–256. [DOI] [PMC free article] [PubMed] [Google Scholar]
- 44.Leone G, Duncan R, Mah DC, Price A, Cashdollar LW, Lee PW. 1991. The N-terminal heptad repeat region of reovirus cell attachment protein sigma 1 is responsible for sigma 1 oligomer stability and possesses intrinsic oligomerization function. Virology 182:336–345. doi: 10.1016/0042-6822(91)90677-4. [DOI] [PMC free article] [PubMed] [Google Scholar]
- 45.Mah DC, Leone G, Jankowski JM, Lee PW. 1990. The N-terminal quarter of reovirus cell attachment protein sigma 1 possesses intrinsic virion-anchoring function. Virology 179:95–103. doi: 10.1016/0042-6822(90)90278-Y. [DOI] [PubMed] [Google Scholar]
- 46.Nibert ML, Dermody TS, Fields BN. 1990. Structure of the reovirus cell-attachment protein: a model for the domain organization of sigma 1. J Virol 64:2976–2989. [DOI] [PMC free article] [PubMed] [Google Scholar]
- 47.Yeung MC, Lim D, Duncan R, Shahrabadi MS, Cashdollar LW, Lee PW. 1989. The cell attachment proteins of type 1 and type 3 reovirus are differentially susceptible to trypsin and chymotrypsin. Virology 170:62–70. doi: 10.1016/0042-6822(89)90352-8. [DOI] [PubMed] [Google Scholar]
- 48.Smith RE, Zweerink HJ, Joklik WK. 1969. Polypeptide components of virions, top component and cores of reovirus type 3. Virology 39:791–810. doi: 10.1016/0042-6822(69)90017-8. [DOI] [PubMed] [Google Scholar]
- 49.Rubin DH, Weiner DB, Dworkin C, Greene MI, Maul GG, Williams WV. 1992. Receptor utilization by reovirus type 3: distinct binding sites on thymoma and fibroblast cell lines result in differential compartmentalization of virions. Microb Pathog 12:351–365. doi: 10.1016/0882-4010(92)90098-9. [DOI] [PubMed] [Google Scholar]
- 50.Chappell JD, Gunn VL, Wetzel JD, Baer GS, Dermody TS. 1997. Mutations in type 3 reovirus that determine binding to sialic acid are contained in the fibrous tail domain of viral attachment protein sigma1. J Virol 71:1834–1841. [DOI] [PMC free article] [PubMed] [Google Scholar]
- 51.Chappell JD, Duong JL, Wright BW, Dermody TS. 2000. Identification of carbohydrate-binding domains in the attachment proteins of type 1 and type 3 reoviruses. J Virol 74:8472–8479. doi: 10.1128/JVI.74.18.8472-8479.2000. [DOI] [PMC free article] [PubMed] [Google Scholar]
- 52.Tyler KL, Squier MK, Rodgers SE, Schneider BE, Oberhaus SM, Grdina TA, Cohen JJ, Dermody TS. 1995. Differences in the capacity of reovirus strains to induce apoptosis are determined by the viral attachment protein sigma 1. J Virol 69:6972–6979. [DOI] [PMC free article] [PubMed] [Google Scholar]
- 53.Doyle JD, Danthi P, Kendall EA, Ooms LS, Wetzel JD, Dermody TS. 2012. Molecular determinants of proteolytic disassembly of the reovirus outer capsid. J Biol Chem 287:8029–8038. doi: 10.1074/jbc.M111.334854. [DOI] [PMC free article] [PubMed] [Google Scholar]
- 54.Sarkar P, Danthi P. 2010. Determinants of strain-specific differences in efficiency of reovirus entry. J Virol 84:12723–12732. doi: 10.1128/JVI.01385-10. [DOI] [PMC free article] [PubMed] [Google Scholar]
- 55.Sarkar P, Danthi P. 2013. The mu1 72-96 loop controls conformational transitions during reovirus cell entry. J Virol 87:13532–13542. doi: 10.1128/JVI.01899-13. [DOI] [PMC free article] [PubMed] [Google Scholar]
- 56.Nibert ML, Chappell JD, Dermody TS. 1995. Infectious subvirion particles of reovirus type 3 Dearing exhibit a loss in infectivity and contain a cleaved sigma 1 protein. J Virol 69:5057–5067. [DOI] [PMC free article] [PubMed] [Google Scholar]
- 57.Duncan R, Lee PW. 1994. Localization of two protease-sensitive regions separating distinct domains in the reovirus cell-attachment protein sigma 1. Virology 203:149–152. doi: 10.1006/viro.1994.1465. [DOI] [PubMed] [Google Scholar]
- 58.Bass DM, Bodkin D, Dambrauskas R, Trier JS, Fields BN, Wolf JL. 1990. Intraluminal proteolytic activation plays an important role in replication of type 1 reovirus in the intestines of neonatal mice. J Virol 64:1830–1833. [DOI] [PMC free article] [PubMed] [Google Scholar]
- 59.Bodkin DK, Nibert ML, Fields BN. 1989. Proteolytic digestion of reovirus in the intestinal lumens of neonatal mice. J Virol 63:4676–4681. [DOI] [PMC free article] [PubMed] [Google Scholar]
- 60.Chandran K, Walker SB, Chen Y, Contreras CM, Schiff LA, Baker TS, Nibert ML. 1999. In vitro recoating of reovirus cores with baculovirus-expressed outer-capsid proteins mu1 and sigma3. J Virol 73:3941–3950. [DOI] [PMC free article] [PubMed] [Google Scholar]
- 61.Chandran K, Parker JS, Ehrlich M, Kirchhausen T, Nibert ML. 2003. The delta region of outer-capsid protein micro 1 undergoes conformational change and release from reovirus particles during cell entry. J Virol 77:13361–13375. doi: 10.1128/JVI.77.24.13361-13375.2003. [DOI] [PMC free article] [PubMed] [Google Scholar]
- 62.Dryden KA, Wang G, Yeager M, Nibert ML, Coombs KM, Furlong DB, Fields BN, Baker TS. 1993. Early steps in reovirus infection are associated with dramatic changes in supramolecular structure and protein conformation: analysis of virions and subviral particles by cryoelectron microscopy and image reconstruction. J Cell Biol 122:1023–1041. doi: 10.1083/jcb.122.5.1023. [DOI] [PMC free article] [PubMed] [Google Scholar]
- 63.Mendez II, Weiner SG, She YM, Yeager M, Coombs KM. 2008. Conformational changes accompany activation of reovirus RNA-dependent RNA transcription. J Struct Biol 162:277–289. doi: 10.1016/j.jsb.2008.01.006. [DOI] [PMC free article] [PubMed] [Google Scholar]
- 64.Reinisch KM, Nibert ML, Harrison SC. 2000. Structure of the reovirus core at 3.6 A resolution. Nature 404:960–967. doi: 10.1038/35010041. [DOI] [PubMed] [Google Scholar]
- 65.Tao Y, Farsetta DL, Nibert ML, Harrison SC. 2002. RNA synthesis in a cage—structural studies of reovirus polymerase lambda3. Cell 111:733–745. doi: 10.1016/S0092-8674(02)01110-8. [DOI] [PubMed] [Google Scholar]
- 66.Zhang X, Jin L, Fang Q, Hui WH, Zhou ZH. 2010. 3.3 A cryo-EM structure of a nonenveloped virus reveals a priming mechanism for cell entry. Cell 141:472–482. doi: 10.1016/j.cell.2010.03.041. [DOI] [PMC free article] [PubMed] [Google Scholar]
- 67.Zhang X, Walker SB, Chipman PR, Nibert ML, Baker TS. 2003. Reovirus polymerase lambda 3 localized by cryo-electron microscopy of virions at a resolution of 7.6 A. Nat Struct Biol 10:1011–1018. doi: 10.1038/nsb1009. [DOI] [PMC free article] [PubMed] [Google Scholar]
- 68.Nygaard RM, Lahti L, Boehme KW, Ikizler M, Doyle JD, Dermody TS, Schiff LA. 2013. Genetic determinants of reovirus pathogenesis in a murine model of respiratory infection. J Virol 87:9279–9289. doi: 10.1128/JVI.00182-13. [DOI] [PMC free article] [PubMed] [Google Scholar]
- 69.Rubin DH, Kornstein MJ, Anderson AO. 1985. Reovirus serotype 1 intestinal infection: a novel replicative cycle with ileal disease. J Virol 53:391–398. [DOI] [PMC free article] [PubMed] [Google Scholar]
- 70.Tai JH, Williams JV, Edwards KM, Wright PF, Crowe JE Jr, Dermody TS. 2005. Prevalence of reovirus-specific antibodies in young children in Nashville, Tennessee. J Infect Dis 191:1221–1224. doi: 10.1086/428911. [DOI] [PMC free article] [PubMed] [Google Scholar]
- 71.Bodkin DK, Fields BN. 1989. Growth and survival of reovirus in intestinal tissue: role of the L2 and S1 genes. J Virol 63:1188–1193. [DOI] [PMC free article] [PubMed] [Google Scholar]
- 72.Chandran K, Zhang X, Olson NH, Walker SB, Chappell JD, Dermody TS, Baker TS, Nibert ML. 2001. Complete in vitro assembly of the reovirus outer capsid produces highly infectious particles suitable for genetic studies of the receptor-binding protein. J Virol 75:5335–5342. doi: 10.1128/JVI.75.11.5335-5342.2001. [DOI] [PMC free article] [PubMed] [Google Scholar]
- 73.Kim M, Garant KA, zur Nieden NI, Alain T, Loken SD, Urbanski SJ, Forsyth PA, Rancourt DE, Lee PW, Johnston RN. 2011. Attenuated reovirus displays oncolysis with reduced host toxicity. Br J Cancer 104:290–299. doi: 10.1038/sj.bjc.6606053. [DOI] [PMC free article] [PubMed] [Google Scholar]