

ABSTRACT
A balance between the functions of the influenza virus surface proteins hemagglutinin (HA) and neuraminidase (NA) is thought to be important for the transmission of viruses between humans. Here we describe two pandemic H1N1 viruses, A/swine/Virginia/1814-1/2012 and A/swine/Virginia/1814-2/2012 (pH1N1low-1 and -2, respectively), that were isolated from swine symptomatic for influenza. The enzymatic activity of the NA of these viruses was almost undetectable, while the HA binding affinity for α2,6 sialic acids was greater than that of the highly homologous pH1N1 viruses A/swine/Pennsylvania/2436/2012 and A/swine/Minnesota/2499/2012 (pH1N1-1 and -2), which exhibited better-balanced HA and NA activities. The in vitro growth kinetics of pH1N1low and pH1N1 viruses were similar, but aerosol transmission of pH1N1low-1 was abrogated and transmission via direct contact in ferrets was significantly impaired compared to pH1N1-1, which transmitted by direct and aerosol contact. In normal human bronchial epithelial cells, pH1N1low-1 was significantly inhibited by mucus but pH1N1-1 was not. In Madin-Darby canine kidney cell cultures overlaid with human or swine mucus, human mucus inhibited pH1N1low-1 but swine mucus did not. These data show that the interaction between viruses and mucus may be an important factor in viral transmissibility and could be a barrier for interspecies transmission between humans and swine for influenza viruses.
IMPORTANCE A balance between the functions of the influenza virus surface proteins hemagglutinin (HA) and neuraminidase (NA) is thought to be important for transmission of viruses from swine to humans. Here we show that a swine virus with extremely functionally mismatched HA and NAs (pH1N1low-1) cannot transmit via aerosol in ferrets, while another highly homologous virus with HA and NAs that are better matched functionally (pH1N1-1) can transmit via aerosol. These viruses show similar growth kinetics in Madin-Darby canine kidney (MDCK) cells, but pH1N1low-1 is significantly inhibited by mucus in normal human bronchial epithelial cells whereas pH1N1-1 is not. Further, human mucus could inhibit these viruses, but swine mucus could not. These data show that the interaction between viruses and mucus may be an important factor in viral transmissibility and could be a species barrier between humans and swine for influenza viruses.
INTRODUCTION
Hemagglutinin (HA) and neuraminidase (NA), the surface glycoproteins of influenza virus, play vital roles in the virus life cycle. HA binds to sialic acids on the cell surface, initiating fusion of the cell and viral membranes. NA enzymatically cleaves sialic acids from glycans on the host cell surface, facilitating the release of budding progeny viruses (1, 2). Thus, HA and NA have opposing roles in the viral life cycle and both are required for viral replication. A functional balance between HA and NA is important for both efficient replication and respiratory droplet transmission in humans. Four pandemic human viruses, A/California/04/2009 (H1N1) (CA/09), A/Hong Kong/68 (H3N2), A/Japan/305+/1957 (H2N2), and A/South Carolina/1/1918 (H1N1), all showed a functional balance between their HA and NA proteins (3). Further, the inefficient respiratory-droplet transmission of a triple-reassortant swine virus, A/swine/Hong Kong/915/2004 (H1N2), was enhanced upon replacing the NA with one of greater activity, making a better functional balance between HA and NA (4). This indicated that an HA/NA functional balance in the recombinant swine virus was one of the factors that contributed to enhanced transmission (4). A balance has also been shown to be important for efficient viral replication in mice and in vitro (4–8). In swine, an HA/NA balance seems less important for replication and transmission (3, 4). While viruses with mismatched HA and NA can replicate in swine, they do not seem to transmit between humans effectively (3, 4).
Here we describe two pandemic swine H1N1 (pH1N1) viruses that were isolated from swine symptomatic for influenza in the same commercial farm in the United States. An extreme mismatching of the activities of HA and NA was evident in the two virus strains, A/swine/Virginia/1814-1/2012 (pH1N1low-1) and A/swine/Virginia/1814-2/2012 (pH1N1low-2), as the enzymatic activity of NA was almost undetectable but the binding affinity of HA for α2,6 sialic acids was greater than that seen with highly homologous pH1N1 virus strains A/swine/Pennsylvania/2436/2012 (pH1N1-1) and A/swine/Minnesota/2499/2012 (pH1N1-2), which exhibited more-balanced HA/NA activities. pH1N1low-1 and -2 were isolated from animals in the same herd and were highly homologous to pH1N1low viruses (98% for all gene segments). We used these virus strains to further study the transmissibility of swine viruses with functionally mismatched HA and NAs in the ferret model, and we also studied the interaction of these viruses with human and swine mucus to gain an insight into why such viruses can apparently transmit in swine but not in humans.
MATERIALS AND METHODS
Viruses and cells.
The viruses studied here were isolated from nasal swabs obtained from pigs in commercial swine herds in the United States that showed symptoms of influenza-like illness, such as coughing, thumping, nasal discharge, diarrhea, and fever. A/swine/Virginia/1814-1/2012 (H1N1) (pH1N1low-1) and A/swine/Virginia/1814-2/2012 (H1N1) (pH1N1low-2) were isolated from pigs in the same herd in Virginia. A/swine/Pennsylvania/2436/2012 (H1N1) (pH1N1-1) was isolated from a pig in Pennsylvania, and A/swine/Minnesota/2499/2012 (H1N1) (pH1N1-2) was isolated from a pig in Minnesota. Viruses were propagated in swine testes epithelial (STE) cells (ATCC, Manassas, VA), and viral titers were determined using Madin-Darby canine kidney (MDCK) cells (ATCC). MDCK and STE cells were maintained in minimal essential medium (MEM) supplemented with 10% (vol/vol) fetal bovine serum (Thermo Scientific, Waltham, MA). Viruses were diluted in infection medium (MEM supplemented with 5% [vol/vol] bovine serum albumin [BSA; Sigma, St. Louis, MO]). Normal human bronchial epithelial (NHBE) cells (Lonza, Walkersville, MD) (lot no. 0000105104) from a healthy, nonsmoking donor were expanded, cryopreserved, and cultured in an air-liquid interface system as previously described (9). The apical surface of the cells was exposed to a humidified 95% air/5% CO2 environment, and the basolateral medium was changed every 2 days. NHBE cells were washed by adding 150 μl of infection medium to the apical surface for 10 min followed by gentle pipetting and aspiration of the wash solution.
MUNANA neuraminidase activity assay.
NA activity was measured via a fluorimetric assay using MUNANA [2′-(4-methylumbelliferyl)-α-d-N-acetylneuraminic acid] (Sigma) as a substrate (10, 11). The assay involved incubating a 2-fold dilution series of virus with MUNANA at a final concentration of 100 μM for 30 min at 37°C. Input viruses were normalized by HA titer. The reaction was terminated by adding a stop solution of 25% ethanol and 12.5% glycine (Fisher Scientific, Rochester, NY) in distilled water. The fluorescence of the released 4-MU (4-methylumbelliferone) was measured with a Synergy 2 fluorimeter (BioTek Instruments, Winooski, VT), using an excitation wavelength of 360 nm and an emission wavelength of 460 nm. The results were calculated as the means from 2 or 3 independent determinations.
Oseltamivir susceptibility assay.
Viruses were preincubated for 30 min at 37°C in the presence of various concentrations of the NA inhibitor oseltamivir carboxylate (10−4 to 104 μM) (Hoffmann-La Roche, Basel, Switzerland) prior to addition to MDCK cells. The viability of MDCK cells was then tested after 2 and 24 h of incubation using the CellTiterGlo cell viability assay (Promega, Madison, WI) according to the manufacturer's instructions. Luminescence and absorbance were measured by using a Synergy 2 multimode microplate reader (BioTek Instruments). The mean value of the negative control in each plate was set at 100% luminescence, and the percentage of luminescence of each compound-containing well was determined in relation to this internal control. The 50% effective concentrations (EC50) were determined by using the 4-parameter logistic nonlinear regression model equation in GraphPad Prism 5 software (GraphPad Software, La Jolla, CA).
Protein gel electrophoresis.
STE cells were infected or mock infected with virus at 80% confluence and were harvested at 72 h postinfection (hpi). The resulting suspension was clarified by centrifugation at 900 × g for 5 min followed by centrifugation at 100,000 × g for 1.5 h at 4°C to pellet the virus, which was resuspended in phosphate-buffered saline (PBS) (Corning, Danville, VA) at pH 7.2. Proteins were denatured by heating at 100°C for 5 min in sodium dodecyl sulfate-polyacrylamide gel electrophoresis (SDS-PAGE) sample buffer (Sigma), and 10 μg of each sample was separated on a 4% to 12% Bis-Tris gradient gel (Invitrogen, Carlsbad, CA), which was subsequently stained with 0.1% (wt/vol) Coomassie blue. The relative amounts of protein in each band were determined via densitometry using Image J (NIH, Bethesda, MD).
HA binding affinity.
Viruses were grown in eggs, purified, concentrated over a cushion of 25% sucrose in 1× STE buffer (0.1 M NaCl, 10 mM Tris-HCl, 1 mM EDTA, pH 8.0), and ultracentrifuged at 25,000 rpm for 1 h at 4°C. The general procedure of this solid-phase receptor-binding assay was described previously (12). For receptor binding assays, we used biotinylated glycans of α2,3′SL (N-acetylneuraminic acid [Neu5Ac]α2-3Galβ1-4Glcβ-biotinylated polyacrylamide [PAA-biotin]), α2,6′SL (Neu5Acα2-6Galβ1-4Glcβ–PAA-biotin), and α2,6′SLN (Neu5Acα2-6Galβ1-4GlcNAcβ–PAA-biotin) (GlycoTech, Gaithersburg, MD). Polyvinyl chloride enzyme immunoassay (EIA) microplates (Corning) were coated with 10 μg of bovine fetuin per ml–PBS (200 μl/well) overnight and were washed with distilled water. Fetuin-coated plates were blocked with 0.2 ml of PBS containing 5% BSA at room temperature for 1 h. The viruses, diluted in PBS to an HA titer of 1/32, were incubated in the wells of fetuin-coated plates (40 μl/well) at 4°C overnight; the wells were washed with an ice-cold PBS washing buffer. Serial 2-fold dilutions of sialylglycopolymer in the reaction buffer (0.02% bovine serum albumin–0.01% Tween 80–1 μM zanamivir–PBS) were added to the wells (100 μl/well), followed by 2 h of incubation at 4°C. After five washings with PBS containing 0.05% Tween 20, 100 μl of streptavidin-peroxidase conjugates (Invitrogen), diluted 1/2,000 in reaction buffer, was added to each well, followed by 1 h of incubation at 4°C. After they were washed, the plates were incubated with 0.05 ml of TMB (3,3′,5,5′-tetramethylbenzidine) (Sigma, St. Louis, MO) for 10 min at room temperature and the reaction was stopped with 0.05 ml of 50 mM HCl, and then the optical density at 450 nm (OD450) was measured in a Synergy 2 multimode microplate reader (BioTek Instruments).
Ferret experiments.
We used 3-month-old ferrets that were seronegative for influenza virus (Triple F Farms, Sayre, PA). Four ferrets per virus strain were lightly anesthetized with isoflurane and inoculated with 106 PFU of virus in 1 ml PBS (0.5 ml per nostril). These inoculated (I) ferrets were then moved into separate cages, each containing one naive direct-contact (DC) ferret. A naive aerosol-contact (AC) ferret was kept in a cage that was adjacent to the cage containing each I/DC pair but separated by double-layered grills to allow unobstructed airflow but prevent direct contact. Weight, temperature, and clinical signs (sneezing, lethargy, and ruffled fur) were recorded every other day for 14 days. Nasal washes were collected on days 3, 5, 7, 9, and 11 postinfection by flushing nostrils with 1 ml of PBS. Viral titers, measured as 50% tissue culture infectious doses (TCID50), in the nasal wash samples were determined in MDCK cells according to the method of Reed and Muench (13).
Infection and staining of normal human bronchial epithelial (NHBE) cells.
Viruses were diluted in bronchial epithelial basal medium (BEBM) (Lonza) to equal titers as determined by plaque assays using MDCK cells. NHBE cells were washed with PBS to remove excess mucus secretion on the apical surface prior to infection. Viruses were allowed to adsorb for 1 h at 37°C, and the inocula were then removed by aspiration. When used, exogenous bacterial NA (Roche, Basel, Switzerland) was added at a concentration of 1 μU/ml to the virus inoculum. NHBE cells were incubated for the indicated times postinfection at 37°C. Viruses released apically were harvested by the apical addition and collection of 300 μl of 0.05% BSA–BEBM, which was allowed to equilibrate at 37°C for 30 min. Samples were stored at −80°C until needed. Cells were fixed using 3.7% (vol/vol) paraformaldehyde (Electron Microscopy Services, Hatfield, PA)–PBS for 30 min at room temperature, after which cells were washed three times with PBS and stored at 4°C in PBS until staining was performed.
Fixed NHBE cells were permeabilized apically and basolaterally with 0.3% (vol/vol) Triton X-100 (Sigma) for 15 min and then washed twice with 0.01% (vol/vol) Tween 20 (Sigma)–PBS for 5 min, which was followed by blocking with 3% normal goat serum (Sigma)–PBS for 1 h at room temperature, and cells were then washed twice. Primary antibodies (mouse anti-influenza virus nucleoprotein conjugated to fluorescein isothiocyanate [Abcam, Cambridge, MA] and mouse anti-β-tubulin conjugated to cy3 [Abcam]) were then added and incubated at 4°C overnight. Cells were then washed three times, and filters were excised from the tissue culture insertions and mounted onto coverslips using Prolong Gold antifade reagent (Invitrogen) and viewed on a Nikon C2 confocal microscope.
ELLA.
Mucus secretion from NHBE cells was measured by an enzyme-linked lectin assay (ELLA) essentially as described previously (14). Apical washes from NHBE cells were coated onto high-binding EIA/radioimmunoassay (RIA) flat-bottom 96-well Costar plates (Corning) overnight at 4°C. Porcine gastric mucin (Sigma) was used to generate a standard curve. Plates were washed three times with PBS containing Tween (Sigma) (0.05% [vol/vol]) and blocked by adding PBS containing BSA (Sigma) (1% [vol/vol]) and incubating for 2 h at room temperature. Plates were washed three times with PBS-Tween, and then 50 μl of a 0.3 μg/ml solution of wheat germ agglutinin conjugated to horseradish peroxidase (WGA-HRP) (Sigma) diluted in PBS was added to each well, and plates were incubated at 37°C for an hour. Plates were washed three times with PBS-Tween, and TMB (Sigma) was added to each well at room temperature. The reaction was stopped with H2SO4 (Sigma), and optical density was measured at 450 nm in a Synergy 2 multimode microplate reader (BioTek Instruments).
Viral infection of MDCK cells in the presence of human and swine mucus.
MDCK cell cultures were prepared on 16-well chamber slides (Thermo Scientific). Human mucus was obtained from NHBE cell washes, and swine mucus was obtained from freshly prepared swine tracheal explant washes. Explants were prepared from tracheal tissue samples obtained from full-term, ready-for-market pigs as previously described (15, 16). Explants were maintained in 24-well plates on Transwell insertions (Corning), with the basal chamber containing BEBM supplemented with SingleQuot growth factors (Lonza). Medium was replaced after explant preparation every 3 h, with a total of three changes, and then explants were incubated at 37°C (5% CO2) for 24 h. Mucus was removed from the apical surface by washing using infection medium. Equal amounts of human or swine mucus were added to MDCK cell cultures, as determined by ELLA, in a 50-μl total volume per well. Cells and mucus were incubated at 37°C (5% CO2) for 30 min prior to addition of a multiplicity of infection (MOI) of 1 in 50 μl of infection medium per well. Cultures were then incubated for 1 h at 37°C and then washed, and 200 μl of infection medium was then added to each well and cultures were incubated for 7 h at 37°C (5% CO2). Cells were then fixed, permeabilized, stained using DAPI (4′,6-diamidino-2-phenylindole) and influenza virus nucleoprotein, and imaged as described above. Infected cells in the five imaged fields that best represented the entire well were counted using NIS-Elements software (Nikon, Melville, NY). Images were taken at a magnification of ×200 using a Nikon E800 microscope.
Data analysis and statistics.
Data collected were inputted and graphed using Graphpad Prism (Graphpad Software). Statistical analysis was performed using analysis of variance (ANOVA) with Bonferroni's posttest, with P values of <0.05 deemed statistically significant.
Accession numbers.
The sequences of the HA and NA genes of the viruses studied here have been submitted to GenBank under the following accession numbers: for A/swine/Virginia/1814-1/2012 (H1N1) (pH1N1low-1), KP938849 (HA) and KP938850 (NA); for A/swine/Virginia/1814-2/2012 (H1N1) (pH1N1low-2), KP938853 (HA) and KP938854 (NA); for A/swine/Pennsylvania/2436/2012 (H1N1) (pH1N1-1), KP938851 (HA) and KP938852 (NA); and for A/swine/Minnesota/2499/2012 (H1N1) (pH1N1-2), KP938855 (HA) and KP938856 (NA).
RESULTS
pH1N1low viruses show decreased NA activity but increased HA binding affinity with no significant changes in protein content or replication in vitro compared to pH1N1 viruses.
NA assays, performed using MUNANA or fetuin as the substrate, revealed that pH1N1low-1 and -2 demonstrated almost undetectable NA activities, while the NA activities of pH1N1-1 and -2 were significantly greater (Fig. 1A [pH1N1low viruses = 140.6 ± 55.2 mean units of NA and pH1N1 viruses = 3,990.6 ± 53.6 mean units of NA, P < 0.01 at a 0.5 dilution of virus, n = 2] and 1B [pH1N1low] viruses = 0.13 ± 0.04 pmol 4-MU and pH1N1 viruses = 1.57 ± 0.23 pmol 4-MU, P < 0.001, n = 4). The NA activity of pH1N1low viruses was also greatly reduced compared to that of other pandemic H1N1 viruses (n = 25) (refer to Table 1 for strain details) isolated from commercial pig farms in the United States that were obtained during surveillance undertaken by this group during the period of 2009 to 2011 (Fig. 1B [pH1N1low viruses = 0.13 ± 0.04 pmol 4-MU and pH1N1 viruses = 3.044 ± 0.76 pmol 4-MU, P < 0.001 at a 0.5 dilution of virus]). Enzyme kinetics data also showed that the NA activity of pH1N1low-1 was at the limit of detection, while pH1N1-1 showed greater kinetics using MUNANA as a substrate (Vmax = 0.03 and 0.1, respectively) (Fig. 1C). Both pH1N1low-1 and pH1N1-1 viruses showed NA enzyme kinetics that were at least four times lower than those seen with another H1N1 virus, A/Brisbane/59/2007 (H1N1), used as a control (Vmax = 0.47) (Fig. 1C). The Km values obtained using pH1N1-1 and A/Brisbane/59/2007 were similar (33.31 and 51.98, respectively) and were an order of magnitude lower than the Km value obtained using pH1N1low-1 (413.3), indicating that pH1N1low-1 demonstrated a lower affinity for the MUNANA substrate (Fig. 1C). Despite the difference in NA activity levels, pH1N1low-1 and -2 viruses showed replication kinetics similar to those seen with pH1N1-1 and -2 viruses in vitro in MDCK cells (Fig. 1D). The undetectable (or lack of) NA activity may not have been due to a change in protein expression since there were no obvious differences between the results seen with pH1N1low-1 and -2 viruses and those seen with pH1N1 viruses that would account for such a drastic reduction in NA activity, as determined by SDS-PAGE and densitometry analysis (Fig. 1E and F).
FIG 1.

pH1N1low viruses showed almost undetectable neuraminidase activity, but no change in viral neuraminidase protein content was detected. (A and B) The mean neuraminidase (NA) activity of pH1N1low viruses was significantly less than the mean NA activity of pH1N1 viruses and was almost undetectable, as measured with MUNANA (P < 0.01 at a 0.5 dilution, n = 4) (A) and fetuin (P < 0.001 at a 0.5 dilution, n = 4) (B) as the substrates. (B) The mean NA activity of pH1N1low viruses was also significantly less than the mean NA activity of other pandemic H1N1 viruses isolated in swine during the period 2009 to 2011 in the United States (pH1N1 viruses, P < 0.001 at a 0.5 dilution, n = 25) (refer to Table 1 for strain information). (C) The enzyme kinetics of the NA in pH1N1low-1 and pH1N1-1 were also reduced compared to that in A/Brisbane/59/2007 (H1N1), as measured using MUNANA as a substrate (Vmax = 0.03, 0.10, and 0.47, respectively; Km = 413.3, 33.31, and 51.98, respectively; n = 2). (D) Viral growth kinetics in Madin-Darby canine kidney (MDCK) cells showed that the replication kinetics of pH1N1low viruses (red and purple) were similar to the replication kinetics of pH1N1 viruses (blue and green) (n = 3). (E) Separation of viral proteins by SDS-PAGE did not reveal any sizeable changes in protein content between these viruses, as measured using densitometry. M, marker; lane 1, pH1N1low-1; lane 2, pH1N1low-2; lane 3, pH1N1-1; lane 4, pH1N1-2. (F) Comparing the intensity of the NA bands normalized to the nucleoprotein (NP) bands of each virus in panel E also did not reveal any appreciable differences between pH1N1low and pH1N1 viruses. **, P < 0.01; ***, P < 0.001.
TABLE 1.
Details of the virus strains used in the MUNANA assay presented in Fig. 1B (pH1N1 viruses)
| Strain name | Mo collected | Unique farm IDa | Subtype |
|---|---|---|---|
| A/swine/Indiana/30-0801-2011 | August 2011 | 30 | pH1N1 |
| A/swine/Indiana/30-0816-2011 | August 2011 | 30 | pH1N1 |
| A/swine/Indiana/30-0824-2011 | August 2011 | 30 | pH1N1 |
| A/swine/Indiana/30-1017/2011 | October 2011 | 30 | pH1N1 |
| A/swine/Indiana/30-0428/2010 | April 2010 | 30 | M-pandemic |
| A/swine/Minnesota/36-0601/2010 | June 2010 | 36 | M pandemic |
| A/swine/Minnesota/36-0607/2010 | June 2010 | 36 | M-pandemic |
| A/swine/Minnesota/36-0610/2010 | June 2010 | 36 | M-pandemic |
| A/swine/Minnesota/36-0619/2010 | June 2010 | 36 | M-pandemic |
| A/swine/Indiana/29-1001/2010 | October 2010 | 29 | pH1N1 |
| A/swine/Indiana/29-1015/2010 | October 2010 | 29 | pH1N1 |
| A/swine/Indiana/29-1024/2010 | October 2010 | 29 | pH1N1 |
| A/swine/Minnesota/36-1012/2010 | October 2010 | 36 | pH1N1 |
| A/swine/Minnesota/36-1020/2010 | October 2010 | 36 | pH1N1 |
| A/swine/Minnesota/36-1026/2010 | October 2010 | 36 | pH1N1 |
| A/swine/Iowa/14-1001/2009 | October 2009 | 14 | pH1N1 |
| A/swine/Iowa/14-1007/2009 | October 2009 | 14 | pH1N1 |
| A/swine/Iowa/14-1010/2009 | October 2009 | 14 | pH1N1 |
| A/swine/Iowa/14-1011/2009 | October 2009 | 14 | pH1N1 |
| A/swine/Iowa/14-1019/2009 | October 2009 | 14 | pH1N1 |
| A/swine/Iowa/14-1028/2009 | October 2009 | 14 | pH1N1 |
| A/swine/Iowa/14-1030/2009 | October 2009 | 14 | pH1N1 |
| A/swine/Illinois/214-1217/2009 | December 2009 | 21 | pH1N1 |
| A/swine/Illinois/214-1221/2009 | December 2009 | 21 | pH1N1 |
| A/swine/Illinois/214-1230/2009 | December 2009 | 21 | pH1N1 |
ID, identification number.
While we did not see any appreciable differences between the growth kinetics of pH1N1low and pH1N1 viruses, plaques produced in MDCK cells by pH1N1low-1 were significantly smaller in diameter than those produced by pH1N1-1 (0.052 ± 0.004 cm versus 0.124 ± 0.008 cm, respectively; P < 0.001) (Fig. 2A, C, and E). The addition of exogenous bacterial NA to the overlay significantly increased the diameter of plaques produced by both pH1N1low-1 and pH1N1-1 (0.106 ± 0.008 cm and 0.180 ± 0.011 cm, respectively; P < 0.001) (Fig. 2); however, there was a greater increase in the diameter of plaques produced by pH1N1low-1 than in the diameter of those produced by pH1N1-1 when exogenous NA was present (a 203.3% increase versus a 145% increase, respectively) (Fig. 2E). Exogenous NA was not effective in totally restoring the diameter of plaques produced by pH1N1low-1 to the diameter of those produced by pH1N1-1, but it did reduce the difference between them (0.106 ± 0.007 cm versus 0.124 ± 0.008 cm, respectively; P < 0.05) (Fig. 2E).
FIG 2.

Exogenous neuraminidase increases the size of plaques formed by pH1N1-1 and pH1N1low-1 in Madin-Darby canine kidney cells. Exogenous neuraminidase did not increase the number of plaques formed by pH1N1-1 (A and B) or pH1N1low-1 (C and D) but significantly increased the mean size of plaques formed by both pH1N1-1 and pH1N1low-1 (P < 0.001). (E) The mean size of plaques formed by pH1N1low-1 was significantly smaller than the mean size of plaques formed by pH1N1-1 (P < 0.001). The difference between the mean size of plaques formed by pH1N1-1 and the mean size of plaques formed by pH1N1low-1 in the presence of exogenous neuraminidase was also statistically significant (P < 0.001). The mean size of plaques formed by pH1N1low-1 increased 203.3% in the presence of exogenous neuraminidase compared to a 145% increase in the mean size of plaques formed by pH1N1-1, indicating that exogenous neuraminidase had a greater effect on plaque formation by pH1N1low-1 than on plaque formation by pH1N1-1. Exogenous neuraminidase increased the mean size of plaques formed by pH1N1low-1, but the mean size of the plaques was still significantly smaller than the mean size of the plaques formed by pH1N1-1 (P < 0.05). *, P < 0.05; ***, P < 0.001.
Considering the low NA activity of pH1N1low viruses, we were interested in their sensitivity to oseltamivir. pH1N1low-1 showed significantly less sensitivity to oseltamivir than pH1N1-1, which showed a sensitivity similar to that of A/Brisbane/59/2007 (mean EC50 [μM] = 33.94 ± 19.59, 0.26 ± 0.09, and 0.11 ± 0.02, respectively; P < 0.01) (Fig. 3). Considering that the mechanism of action of oseltamivir is competitive binding for the active site of NA, these results suggest that the low enzymatic activity of pH1N1low NA proteins may have been due to an altered NA-sialic acid interaction.
FIG 3.
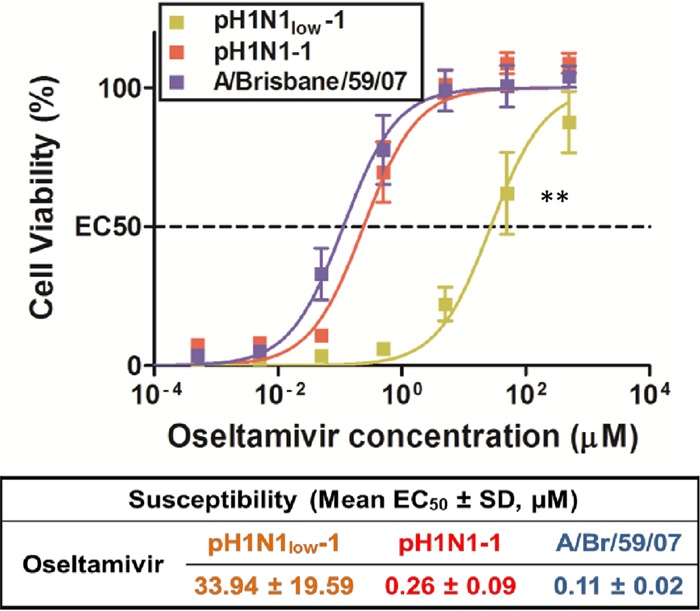
pH1N1low-1 is significantly less sensitive to oseltamivir than were pH1N1-1 or A/Brisbane/59/2007 (H1N1). Oseltamivir resistance assays using Madin-Darby canine kidney (MDCK) cells showed that pH1N1low-1 was significantly less sensitive to oseltamivir than were both pH1N1-1 (P < 0.01) and A/Brisbane/59/2007 (P < 0.01), which showed similar sensitivities (mean EC50 [μM] = 33.94 ± 19.59, 0.26 ± 0.09, and 0.11 ± 0.02, respectively). SD, standard deviation.
We next measured HA binding affinity using a solid-phase glycan binding array (Fig. 4). Surprisingly, considering the almost undetectable NA activity, pH1N1low-1 and -2 were able to bind to α2,6 SLN sialic acids with significantly greater affinity than pH1N1-1 and -2 (Fig. 4C [pH1N1low viruses = 2.41 ± 0.05 mean OD450 at 5 μg/ml sialylglycopolymer and pH1N1 viruses = 0.338.6 ± 0.14 mean OD450 at 5 μg/ml sialylglycopolymer, P < 0.05]). There were 17 amino acid differences in the HA common to pH1N1low viruses compared to pH1N1 viruses. Five of these mutations, K188N, N128S, S189K, A194E, and L247I, were located on the globular head, and of these changes, K118N (H3 numbering) introduced a putative N-glycosylation site (17). These mutations may have contributed to the different binding affinities observed. Taken together, these data show that the naturally occurring functional mismatching of HA and NA in pH1N1low viruses may not have been due to a change in NA protein expression compared to pH1N1 viruses and that the mismatching did not affect viral replication fitness in vitro.
FIG 4.
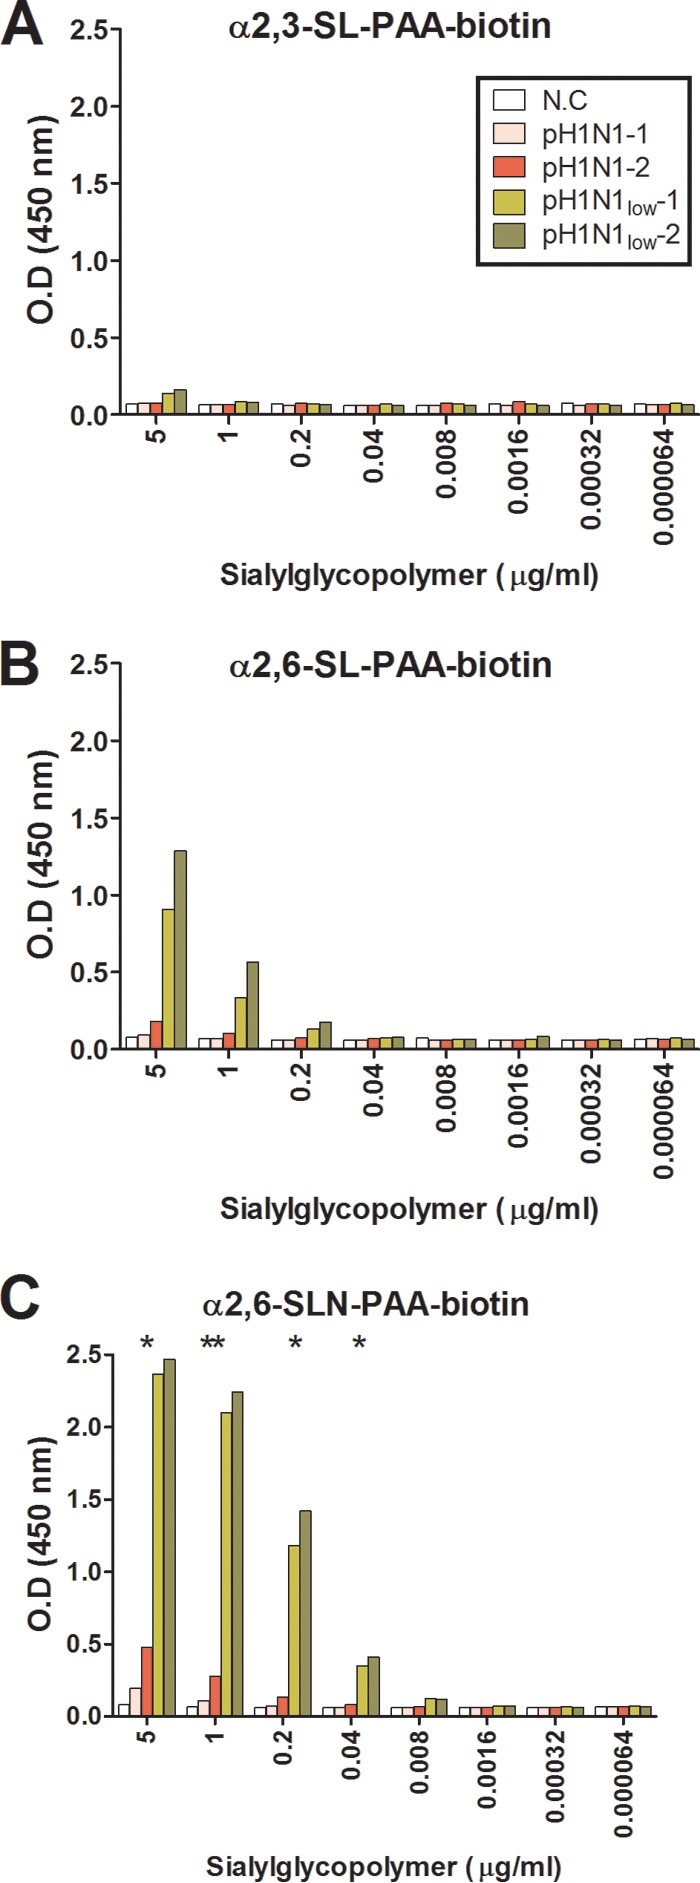
pH1N1low viruses show increased binding affinity of hemagglutinin to sialic acids. Binding affinity to α2,3 sialic acids was almost undetectable for all viruses (A), while binding affinity of pH1N1low viruses to α2,6 sialic acids was greater than that of pH1N1 viruses (B and C). N.C, negative control, allantoic fluid from uninfected eggs. **, P < 0.01; *, P < 0.05 (calculated by comparing the mean of pH1N1-1 and -2 to the mean of pH1N1low-1 and -2 at each dilution of sialylglycopolymer [n = 2]).
Transmission of pH1N1low-1 in ferrets is impaired compared to pH1N1-1.
We next assessed the transmissibility of pH1N1low-1 and pH1N1-1 in ferrets, which is a good correlate for aerosol transmission in humans (4). pH1N1-1 was shed from all four infected ferrets until 7 days postinfection (dpi), at which point one ferret died (Fig. 5A). pH1N1-1 was shed from all DC ferrets for 7 dpi and was shed from AC ferrets from 7 to 11 dpi (Fig. 5C). pH1N1low-1 was also shed from all four infected ferrets, but only until 5 dpi (Fig. 5B). pH1N1low-1was not detected in nasal washes obtained from AC ferrets and was shed from only two DC ferrets between 7 and 11 dpi (Fig. 3D). At 5 dpi, viral shedding was significantly greater from ferrets infected with pH1N1-1 than from those infected with pH1N1low-1 (105.625 ± 0.24 and 104.5135 ± 0.29 mean TCID50/ml, respectively, P < 0.05) (Fig. 5A and B). Further, viral shedding was significantly greater on days 3, 5, and 7 in ferrets in direct contact with pH1N1-1-infected ferrets than in those in direct contact with pH1N1low-1-infected ferrets on these days (mean TCID50/ml for pH1N1-1, 104.21 ± 1.1 at 3 dpi, 105.66 ± 0.12 at 5 dpi, and 105.16 ± 0.26 at 7 dpi; mean TCID50/ml for pH1N1low-1, 0 at 3 dpi, 0 at 5 dpi, and 101 ± 1 at 7 dpi; P < 0.05 at 3 dpi, P < 0.001 at 5 dpi, and P < 0.05 at 7 dpi). Taken together, these results show that there were significant differences in the shedding of these viruses in ferrets, that transmission of pH1N1low-1 to DC animals was significantly impaired compared to transmission of pH1N1-1, and that aerosol transmission of pH1N1low-1 was abrogated.
FIG 5.

Transmissibility of pH1N1low-1 is significantly attenuated compared to that of pH1N1-1 in ferrets. Viral titers, expressed as log10 50% tissue culture infectious doses (TCID50), were measured in ferret nasal washes on days 3, 5, 7, 9, and 11 postinfection with pH1N1-1 (A and C) or pH1N1low-1 (B and D). (A and B) All inoculated (I) ferrets shed virus, but the duration of shedding was reduced in pH1N1low-1-infected ferrets. (C and D) Transmission of pH1N1low-1 to direct-contact (DC) ferrets was delayed compared to transmission to pH1N1-1-infected ferrets, and transmission of pH1N1low-1 to aerosol-contact (AC) ferrets was abrogated. Each bar represents a viral titer obtained from a single ferret. +, ferret died 7 dpi showing pathology typical of influenza virus infection. Asterisks denote significantly greater mean titers in samples taken from ferrets infected with pH1N1-1 than in those infected with pH1N1low-1 at the indicated day postinfection. *, P < 0.05; ***, P < 0.001.
pH1N1low-1 infection of NHBE cells is inhibited by mucus.
There were no significant differences between the growth kinetics of pH1N1low and pH1N1 viruses in MDCK cells, but there was a significant difference in viral shedding from infected ferrets (Fig. 1D and 5). This suggests either that the replication of pH1N1low-1 was less efficient in vivo or that shedding of the virus in respiratory droplets was impaired. We hypothesized that mucus may have played a role in the differences observed between these viruses in vitro and in vivo. NA is important in the release of viruses from cells, but there is also evidence that it plays a role early in infection, by freeing viruses bound to sialic acids present on mucus in the airway (18–20). To determine if pH1N1low-1 was inhibited by mucus, we used washed and unwashed NHBE cells. However, before conducting this experiment, we first assessed how effective washing was in removing mucus from the cells. We washed three wells of NHBE cells 20 times as described in Materials and Methods and measured the mucus content of the washes by ELLA. We found that the mucus content of the washes after 10 and 20 washes decreased by 75.5% and 90%, respectively, compared to that of wash 1 (data not shown). To reduce the risk of damaging the monolayers, we chose to perform 10 washes prior to infection.
We added pH1N1low-1, pH1N1-1, and A/Brisbane/59/2007 to washed and unwashed NHBE cells (total n = 6 NHBE cultures, 3 washed and 3 unwashed, per virus) at an MOI of 0.01 and measured viral titers in apical washes collected at 24, 48, 72, 96, and 120 hpi. At 24 hpi, viral titers measured in washed wells were significantly lower in pH1N1low-1-infected wells than in wells infected with pH1N1-1 and A/Brisbane/59/2007 (pH1N1low-1 mean TCID50/ml = 104.91 ± 0.17, pH1N1-1 mean TCID50/ml = 107.67 ± 0.42 [P < 0.01], A/Brisbane/59/2007 mean TCID50/ml = 107.41 ± 0.17 [P < 0.001], n = 3) (Fig. 6C and E, dashed lines). At subsequent time points, viral titers in washed wells were similar across all viruses (Fig. 6A, C, and E, dashed lines). A different pattern was observed in unwashed wells. Viral titers measured in wells infected with pH1N1-1 and A/Brisbane/59/2007 were similar at each time point; however, we did not detect any virus in two of the three unwashed wells to which we added pH1N1low-1 at any time point (Fig. 6A, C, and E, solid lines). In the remaining well, virus was also not detected at 24 hpi. At 48 hpi, the viral titer in this well was greatly reduced compared to that in washed pH1N1low-1-infected wells. Sequence analysis of the NA gene of viruses in the unwashed well that supported replication did not reveal any new mutations (data not shown). The differences between the viral titers measured in all washed pH1N1low-1-infected wells and those measured in all unwashed pH1N1low-1-infected wells were statistically significant at 24 and 48 hpi (at 24 hpi, pH1N1low-1 unwashed cell mean TCID50/ml = 0 and pH1N1low-1 washed cell mean TCID50/ml = 104.91 ± 0.17, P < 0.001, n = 3; at 48 hpi, pH1N1low-1 unwashed cell mean TCID50/ml = 101.58 ± 1.58 and pH1N1low-1 washed cell mean TCID50/ml = 108.25 ± 0.14, P < 0.05, n = 3) (Fig. 6A). At later time points, the viral titers in all pH1N1low-1-infected wells were similar and were also similar to the titers measured for the other viruses (Fig. 6A, C, and E, solid lines). Overall, these data show that pH1N1low-1 infection and/or replication in NHBE cells was impeded by mucus.
FIG 6.

pH1N1low-1 replication in normal human bronchial epithelial cells is inhibited by mucus. (C and E) Viral titers, expressed as log10 50% tissue culture infectious doses (TCID50), in washed and unwashed normal human bronchial epithelial (NHBE) well infected with pH1N1-1 and A/Brisbane/59/2007 were similar at all time points (dashed and solid lines). (A, C, and E) The mean viral titer in washed wells infected with pH1N1low-1 at 24 h postinfection (hpi) was significantly less than that in washed wells infected with pH1N1-1 and A/Brisbane/59/2007 at 24 hpi (P < 0.01 and P < 0.001, respectively, n = 3) (asterisks shown in panels C and E at 24 hpi). (A) Virus was not detected in unwashed wells 2 and 3 infected with pH1N1low-1, and well 1 was also negative at 24 hpi (solid lines). Further, the viral titer at 48 hpi in well 1 was approximately 2-fold less than the viral titers in washed wells infected with pH1N1low-1. The differences between the mean viral titers in washed and unwashed wells infected with pH1N1low-1 were statistically significant at 24 and 48 hpi (P < 0.001 and P < 0.05, respectively). (B, D, and F) Mucus content was similar in all washed wells at each time point (dashed lines). (B, D, F, and G) The differences between the mean mucus contents of washed and unwashed wells at time zero were statistically significant in all experiments (P < 0.001, n = 3). (G) Mucus content in uninfected unwashed wells remained stable throughout the experiment, while mucus content in uninfected washed wells recovered to levels comparable to the amounts in the unwashed wells within 24 h. (D and F) In wells infected with pH1N1-1 and A/Brisbane/59/2007, mucus content in unwashed wells was similar to that in washed wells at 48 hpi and later time points. (B) However, in wells infected with pH1N1low-1, the mean mucus content in unwashed wells was significantly greater than that in washed wells at 0, 48, 72, and 96 hpi (P < 0.01 at 48 hpi and P < 0.05 at subsequent time points, n = 3). (A and B) Further, mucus content in pH1N1low-1-infected well 3 decreased coincidentally with increasing viral titer. *, P < 0.05; **, P < 0.01; ***, P < 0.001.
We also measured the mucus content of the apical washes obtained from NHBE cell cultures. The mucus content of apical washes from washed wells was similar across all time points in the wells infected with pH1N1-1 and A/Brisbane/59/2007 (Fig. 6D and F, dashed lines). This pattern was not observed in washed wells infected with pH1N1low-1. Preinfection mucus content in these wells was similar to that in washed wells infected with pH1N1-1 and A/Brisbane/59/2007 viruses (pH1N1low-1 = 0.35 ± 0.01 mg/liter mean mucus concentration, pH1N1-1 = 0.38 ± 0.02 mg/liter mean mucus concentration, A/Brisbane/59/2007 = 0.48 ± 0.04 mg/liter mean mucus concentration, n = 3). However, the mucus content measured in washed pH1N1low-1-infected wells increased to significantly greater amounts at 48 hpi compared to preinfection amounts (0 hpi = 0.36 ± 0.01 mg/liter mean mucus concentration, 48 hpi = 0.91 ± 0.02 mg/liter mean mucus concentration, P < 0.001, n = 3) (Fig. 5B, dashed lines). Mucus content then decreased such that, at 72 hpi and later, amounts were similar to those measured in washed wells infected with other viruses (Fig. 6B, D, and F, solid lines). These data indicate that viral infection interfered with mucus production.
In unwashed wells infected with pH1N1-1 and A/Brisbane/59/2007, mucus content decreased to amounts similar to those measured in washed wells postinfection (Fig. 6D and F, solid lines). Again, this pattern was not observed in unwashed wells infected with pH1N1low-1. In the two unwashed wells in which viral titers were absent, mucus amounts increased significantly over time (preinfection = 1.22 ± 0.05 mg/liter mean mucus concentration, 120 hpi = 1.81 ± 0.01 mg/liter mean mucus concentration, P < 0.05, n = 2) (Fig. 6B). In the remaining well where viral titers were detected at 48 hpi and later, mucus content began to decrease after 48 hpi such that, by 120 hpi, mucus content was similar to that in washed wells (Fig. 6B). Further, the mean mucus amount measured in all unwashed wells infected with pH1N1low-1 was significantly greater than in washed wells at all time points except 120 hpi (Fig. 6B). The changes observed are not likely to have been due to the action of viral NA, as NA treatment of mucus does not impact the interaction of mucus with WGA (21, 22). We also investigated whether mucus production decreased due to declining cell health caused by viral infection. We measured cell health using CellTiterGlo reagent, but we did not find any correlation between cell health and mucus content overall (data not shown). These data again show that viral replication interfered with mucus production.
We next performed an experiment similar to the one described previously using an MOI of 1 and fixing the NHBE cultures at 8 hpi to gain a better insight into the earlier events occurring during these infections. Further, to determine if the apparent inhibition of pH1N1low-1 replication by mucus was due to low NA activity, we included exogenous bacterial NA during virus adsorption in some cultures. Overall, we found that numbers of infected cells correlated to the NA activity of the viruses. A/Brisbane/59/2007, which had much greater NA activity than the pH1N1 viruses (Fig. 1C), infected far more cells in both washed and unwashed wells than the pH1N1 viruses (Fig. 7A to H). Further, pH1N1-1 infected more cells than pH1N1low-1 in washed wells, although this was not statistically significant (for A/Brisbane/59/2007, the infected cells were too numerous to count; for pH1N1-1, mean number of infected cells = 363 ± 64.5; for pH1N1low-1, mean number of infected cells = 120.3 ± 36.1 [n = 3 wells]). The addition of exogenous NA did not have a significant impact on the numbers of infected cells counted in washed wells (Fig. 7I). In unwashed wells the numbers of infected cells were much lower. pH1N1-1-infected wells had significantly greater numbers of infected cells than pH1N1low-1-infected wells (84.7 ± 12.9 cells and 7 ± 3 cells, respectively; P < 0.05, n = 3 wells) (Fig. 6J). Again, exogenous NA increased the number of cells infected by pH1N1low-1, but the differences were not statistically significant (Fig. 7J). A comparison of the percentages of reduction in the numbers of infected cells in washed and unwashed wells showed that pH1N1low-1 was more sensitive to the presence of mucus than pH1N1-1. A 76.7% decrease in the numbers of infected cells was observed in pH1N1-1-infected unwashed wells while a 94.2% decrease was observed in pH1N1low-1-infected unwashed wells. This difference was slightly lower in wells where exogenous NA was added, at 92.8% (Fig. 7K). These data collectively indicate that NA activity is important early in infection to overcome the inhibitory actions of mucus.
FIG 7.

Neuraminidase activity is important early in infection. Washed (A, C, E, and G) and unwashed (B, D, F, and H) normal human bronchial epithelial (NHBE) cells were infected at an MOI of 1 with the respective viruses, incubated for 8 h at 37°C, and then fixed and immunolabeled using monoclonal antibodies against β-tubulin (red), which stains bundles of cilia on the apical surface of the cells, and influenza virus nucleoprotein (green). Scale bar = 50 μM. Counts of infected cells, as determined by positive influenza virus nucleoprotein staining, did not show significant differences between pH1N1-1 and pH1N1low-1 viruses in washed wells (I), although the numbers of cells infected by these viruses were much lower than the numbers of those infected by A/Brisbane/59/2007. (J) In unwashed wells, the number of cells infected by pH1N1-1 was significantly greater than the number of those infected with pH1N1low-1 (P < 0.05, n = 3). (I and J) Exogenous neuraminidase (NA) increased the number of cells infected by pH1N1low-1, but this was not statistically significant. (K) The difference between washed and unwashed cells in the numbers of infected cells was greater in pH1N1low-1-infected and pH1N1-1-infected wells. Numbers of cells infected by A/Brisbane/59/2007 were too great to count; therefore, they are not included in panels I, J, and K. Bars show the means ± standard errors of the means (SEM) in panels I and J. *, P < 0.05.
Human mucus inhibits viral infectivity but swine mucus does not.
Since it is likely that pH1N1low-1 could productively infect swine, we were interested in the inhibitory properties of swine mucus. We obtained swine mucus by washing cultures of freshly prepared swine tracheal explants and overlaid MDCK cultures with swine mucus or human mucus obtained from NHBE cell culture washes prior to addition of pH1N1low-1, pH1N1-1, or A/Brisbane/59/2007. We then fixed the cells at 7 hpi and identified infected cells using an anti-influenza virus nucleoprotein antibody. The infectivity of pH1N1-1 and A/Brisbane/59/2007 in cultures overlaid with swine mucus was similar to the infectivity seen in cultures without a mucus overlay (Fig. 8). Interestingly, the infectivity of pH1N1low-1 was greater in cultures overlaid with swine mucus than in cultures without a mucus overlay (percentage of cells infected with no overlay = 9.52 ± 1.537, percentage of cells infected with swine mucus overlay = 15.35 ± 0.1904, P < 0.01) (Fig. 9). In contrast, human mucus greatly decreased the infectivity of all viruses. The percentages of the decreases in infectivity observed between cultures overlaid with human mucus and those without mucus were 90.8% (P < 0.01), 89.8% (P < 0.001), and 76.2% (P < 0.05) for pH1N1low-1, pH1N1-1, and A/Brisbane/59/2007 viruses, respectively (Fig. 9). The inhibition observed inversely correlated to NA activity, although the differences were not statistically significant. These data indicate that human mucus significantly interfered with the infectivity of these viruses while swine mucus did not.
FIG 8.

Infection is inhibited by human mucus but not swine mucus. Madin-Darby canine kidney (MDCK) cell monolayers were overlaid with swine mucus (B, E, and H), human mucus (C, F, and I), or no mucus (A, D, and G) prior to addition of pH1N1low-1, pH1N1-1, or A/Brisbane/59/2007 (H1N1) at an MOI of 1. Cultures were fixed 7 h postinfection and stained for influenza virus nucleoprotein (green) and cell nuclei with DAPI (blue). Human mucus greatly decreased the number of cells infected by all viruses, while cultures overlaid with swine mucus appeared similar to cultures to which mucus was not added. Scale bar = 10 μM. Images are representative of the results of 3 replicates of each experimental condition.
FIG 9.
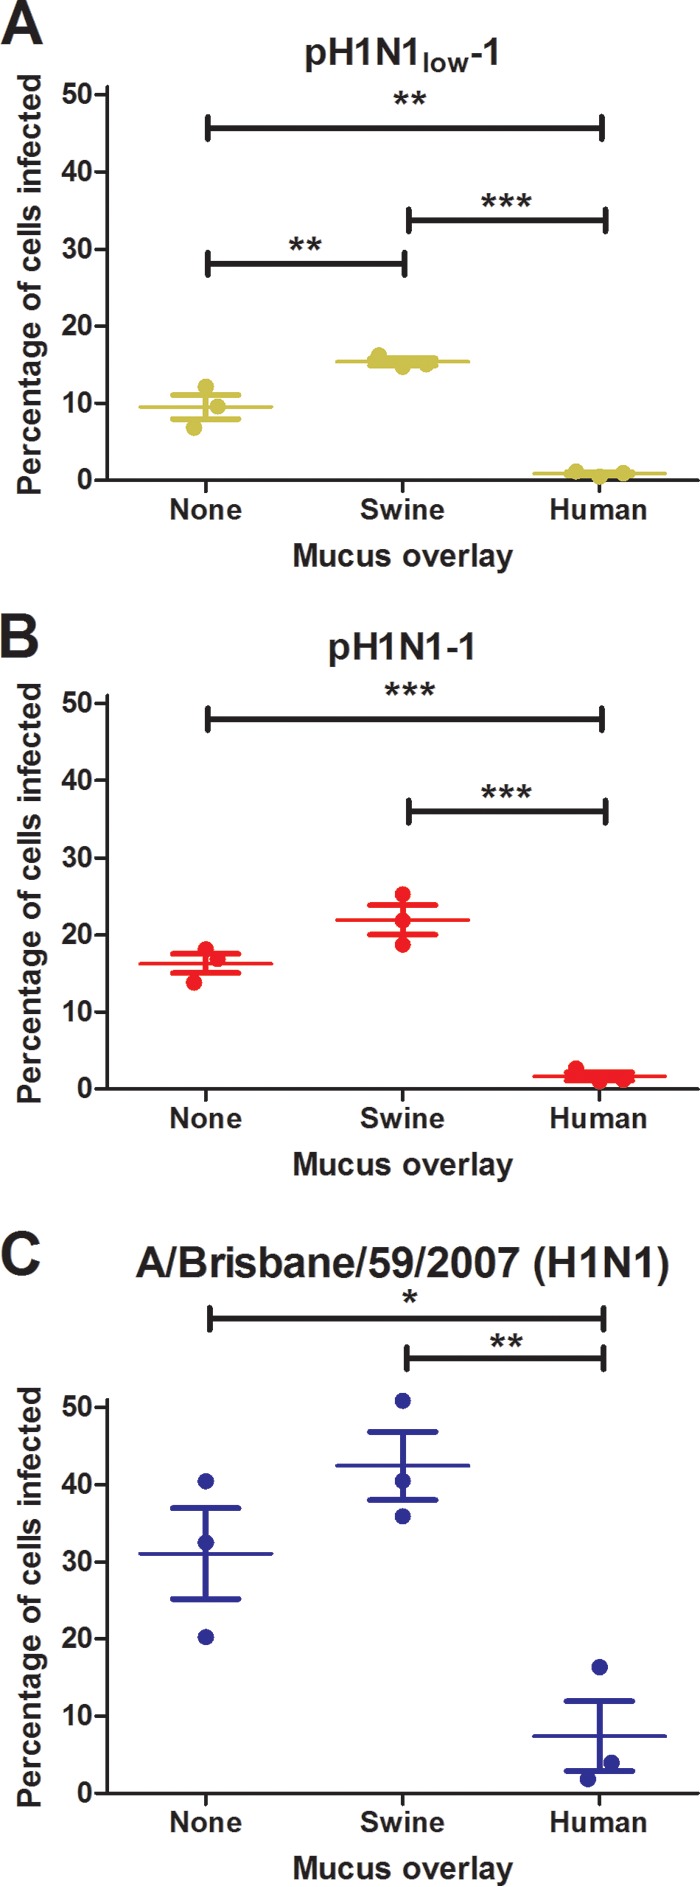
Human mucus significantly inhibits viral infectivity, while swine mucus does not. Madin-Darby canine kidney (MDCK) cell monolayers were overlaid with swine mucus, human mucus, or no mucus prior to addition of pH1N1low-1 (A), pH1N1-1 (B), or A/Brisbane/59/2007 (H1N1) (C) at an MOI of 1. Cultures were fixed 7 h postinfection, and both infected and uninfected cells were counted in five representative fields in each well. Data are presented as mean percentages of cells infected. *, P < 0.05; **, P < 0.01; ***, P < 0.001.
DISCUSSION
The pandemic influenza A 2009 virus (pH1N1) arose from a reassortment event between a North American triple-reassortant swine lineage virus and a Eurasian avian lineage swine virus. The NA and matrix (M) genes of the pH1N1 virus originated from the Eurasian swine virus, and the remaining six genes originated from the North American triple-reassortant swine virus (23). Transmission from swine to humans has been documented for both of the pH1N1 precursor viruses, but secondary human cases have not been observed, and swine viruses isolated prior to 2009 do not appear to be transmissible via respiratory droplets in ferrets (4, 24, 25). There is growing evidence that a functional balance between HA and NA is important for transmission of swine viruses to humans. The 2009 pH1N1 viruses became transmissible by respiratory droplet spread after attaining the Eurasian-origin NA, which showed increased activity over the North American-origin NA. However, another swine H1N1 virus containing this NA and a Eurasian-origin HA did not transmit by respiratory droplets in ferrets (4). Further, an HA/NA functional balance appears to exist in other pandemic viruses. A study of the activities of the HAs and NAs of the A/Japan/305/1957 (H2N2), A/Hong Kong/1/1968 (H3N2), A/South Carolina/1/1918 (H1N1), and A/California/04/2009 (H1N1) pandemic viruses showed that the activities of the NA of A/Japan/305/1957 and A/Hong Kong/1/1968 were relatively high but that they were matched by HAs that also exhibited higher binding (3). The NAs of A/South Carolina/1/1918 and A/California/04/2009 showed relatively low activity, but the activity of the HAs of these viruses was also lower (3). Therefore, all these pandemic viruses isolated from humans demonstrated a functional balance between HA and NA, which indicates that the selective pressures that lead to the emergence of viruses with functionally balanced HAs and NAs in humans are lacking in swine.
The pH1N1low viruses studied here showed extreme functional mismatching between HA and NA, but this did not significantly impact replication fitness in vitro. In vivo, however, shedding and transmission of pH1N1low-1 were significantly reduced compared to pH1N1-1, indicating that an interaction with the host had a negative impact on pH1N1low-1. Respiratory-droplet formation may have been an important factor in the reduced transmissibility of pH1N1low-1 in ferrets. Other ferret studies showed that the Eurasian-origin NA and M genes facilitated the release of respiratory particles from infected ferrets (26). The Eurasian-origin swine NA showed greater activity than that of the North American swine NA, and the increased release correlated with the increased activity of the Eurasian-origin NA (26). While it is possible that the low NA activity of pH1N1low-1 was a limiting factor in aerosol transmission of this virus between ferrets due to reduced respiratory particle release, we did not examine this here.
NA plays an important role in the release of viruses from cells by cleaving sialic acids on the cell surface, but sialic acids are also present on mucins, a major component of mucus (27, 28). This is an important host defense mechanism, as pathogens trapped in mucus are expelled via mucociliary clearance before they are able to bind to cells and initiate an infection (27, 29). The interaction between NA and mucins was hypothesized as early as 1943; more recently, by studying viral binding to MDCK cells, A549 cells, erythrocytes, and isolated respiratory mucus, NA activity has been shown to be important in initiating infection and viral penetration of mucus in vitro (18, 20, 30–32). Mucus overlying frozen human trachea/bronchial tissue sections bound to viruses in a manner which appeared to be mediated by sialic acids (20). In in vivo experiments performed in mice, overexpression of MUC5AC, one of the major mucins in respiratory mucus, significantly impaired viral replication in the lung (18). Further, mice that do not express MUC5B, the other major secreted respiratory mucin, showed severely impaired mucociliary clearance and perturbed immune responses and succumbed to bacterial lung infections (33). Interestingly, a previous study showed that an overlay of human mucus on MDCK cell monolayers seemed to be more inhibitory to viruses than an overlay of porcine mucus, despite similar sialic acid content, although this effect showed some strain specificity (20). The porcine and human respiratory glycomes show similarities, including the expression of α2,3 and α2,6 sialylated glycoproteins and large complex N-glycans with sialylated poly-LacNAc chains, but differences have been characterized (34, 35). One difference is that humans express N-acetylneuraminic acid (Neu5Ac) and lack N-glycolylneuraminic acid (Neu5Gc), which is expressed in pigs (36, 37). Neu5Ac glycans are more abundant than Neu5Gc glycans in porcine epithelial cells, and NeuAC-containing glycans have been shown to be important for infection of swine cells (38).
We hypothesized that mucus may have been interfering with pH1N1low-1 in ferrets, considering the low NA activity and increased binding affinity of the HA of this virus. Similar phenomena were observed in viruses expressing NA proteins of differing stalk lengths (39). Viruses expressing NA proteins with shorter stalk lengths showed a phenotype similar to that of pH1N1low viruses. Replacing the NA of an efficiently transmitted H5N1 virus with an avian NA expressing a stalk 20 amino acids shorter than the NA originally in the virus abrogated AC transmission and reduced the efficiency of DC transmission in ferrets (39). The enzymatic activity of the short-stalk NA was significantly reduced compared to that of the NA with a longer stalk, and the inhibitory effects of mucus on the virus expressing NA proteins with short stalks were significantly greater than the effects on the virus with a long-stalk NA in vitro (39). This is in agreement with our study, in that NA activity appears to be important for transmission and that the virus-mucus interaction is important for efficient transmission, particularly via aerosol droplets.
To further study the role of mucus, we used cultures of mucus-producing NHBE cells. It was evident that mucus had a profound effect on pH1N1low-1 replication but not on pH1N1-1 replication (Fig. 6 and 7). There was also some evidence of a correlation between NA activity and infection efficiency, which was particularly evident at 8 hpi in unwashed wells, where A/Brisbane/59/2007 infected more cells than pH1N1-1, which infected more cells than pH1N1low-1 (Fig. 7). Further, pH1N1low-1 seemed to be more sensitive to inhibition by mucus than pH1N1-1, as there was a 94.2% decrease in the number of infected cells in washed wells compared to unwashed wells, in contrast to the 76.7% decrease observed in pH1N1-1-infected wells (Fig. 7K). Interestingly, the addition of exogenous NA did not have a significant effect on this infection. This may point to the importance of HA in the virus-mucus interaction. Extrapolating, since the replication of pH1N1low-1 was similar to that of pH1N1-1 in the absence of mucus, these data suggest that little NA activity is required to successfully extract viruses from a cell. However, the interaction between virus and mucus appears more sensitive to NA activity, or to the HA/NA functional balance, as pH1N1low-1 was significantly inhibited by mucus but pH1N1-1 was not.
There was an interesting pattern in mucus production in NHBE cell cultures. Amounts of mucus measured in unwashed cultures where a productive infection was absent remained constant, whereas mucus content in washed cultures returned to the levels measured in unwashed cultures within 24 h and then remained constant (Fig. 6G). However, where a productive infection was present, mucus amounts decreased sharply and did not recover to uninfected amounts (Fig. 6B, D, and F). pH1N1low-1 proved to be an exception to the pattern, as this virus replicated to significantly lower titers at 24 hpi in washed cultures and, in these wells, mucus production increased significantly to 48 hpi before dropping as viral titers increased (Fig. 6B). It should be noted that we collected samples from the apical surface of these cultures every 24 h to measure mucus content and viral load, a process that washed some mucus off the cultures. Therefore, influenza virus infection of these cultures either stopped mucus production or severely curtailed it. Since we saw no correlation between decreasing mucus production and cell health at 24 or 48 hpi, it is possible that a virus-specific mechanism was behind this phenomenon, which is an interesting hypothesis that may be worthy of further investigation.
We observed a clear difference between human mucus and swine mucus. Human mucus significantly inhibited the infectivity of pH1N1low-1, pH1N1-1, and A/Brisbane/59/2007, while swine mucus did not (Fig. 8 and 9). These data point to an attribute of human mucus that was inhibitory to these viruses that was not present in swine mucus. Therefore, it is possible that mucus may be an important species barrier between humans and swine, although more work is needed to confirm this. It was interesting that, of the three strains investigated, pH1N1low-1 was the only virus that showed increased infectivity in the presence of swine mucus. This was unexpected, and more work is required to ascertain the significance of this observation.
In summary, we have characterized pH1N1 viruses isolated from swine that exhibit a high degree of functional mismatching between HA and NA. In ferrets, viral shedding was reduced and transmission efficiency was significantly reduced compared to a highly homologous virus with better-balanced HA and NA. Therefore, while viruses with functionally mismatched HA and NAs can exist in swine, human-to-human spread is highly unlikely without further adaptation, possibly by reducing HA activity or increasing NA activity to approach a functional balance. We have also shown that the interaction between influenza virus and mucus could inhibit the replication and/or transmission of viruses with functionally unbalanced HAs and NAs in humans. This could potentially be an important species barrier between swine and humans.
ACKNOWLEDGMENTS
We thank Jennifer DeBeauchamp, Evelyn Stigger-Rosser, Demetreos Syndetos, and Jeri Carol Crumpton for excellent technical assistance and Subrata Barman and Elena Govorkova for helpful discussions and advice. We thank Victoria Frohlich and Jennifer Peters for their expert help and advice with imaging.
This study was funded by the National Institute of Allergy and Infectious Diseases and the National Institutes of Health under contract no. HHSN266200700005C and HHSN272201400006C.
REFERENCES
- 1.Wagner R, Matrosovich M, Klenk HD. 2002. Functional balance between haemagglutinin and neuraminidase in influenza virus infections. Rev Med Virol 12:159–166. doi: 10.1002/rmv.352. [DOI] [PubMed] [Google Scholar]
- 2.Colman PM. 1994. Influenza virus neuraminidase: structure, antibodies, and inhibitors. Protein Sci 3:1687–1696. doi: 10.1002/pro.5560031007. [DOI] [PMC free article] [PubMed] [Google Scholar]
- 3.Xu R, Zhu X, McBride R, Nycholat CM, Yu W, Paulson JC, Wilson IA. 2012. Functional balance of the hemagglutinin and neuraminidase activities accompanies the emergence of the 2009 H1N1 influenza pandemic. J Virol 86:9221–9232. doi: 10.1128/JVI.00697-12. [DOI] [PMC free article] [PubMed] [Google Scholar]
- 4.Yen HL, Liang CH, Wu CY, Forrest HL, Ferguson A, Choy KT, Jones J, Wong DD, Cheung PP, Hsu CH, Li OT, Yuen KM, Chan RW, Poon LL, Chan MC, Nicholls JM, Krauss S, Wong CH, Guan Y, Webster RG, Webby RJ, Peiris M. 2011. Hemagglutinin-neuraminidase balance confers respiratory-droplet transmissibility of the pandemic H1N1 influenza virus in ferrets. Proc Natl Acad Sci U S A 108:14264–14269. doi: 10.1073/pnas.1111000108. [DOI] [PMC free article] [PubMed] [Google Scholar]
- 5.Gen F, Yamada S, Kato K, Akashi H, Kawaoka Y, Horimoto T. 2013. Attenuation of an influenza A virus due to alteration of its hemagglutinin-neuraminidase functional balance in mice. Arch Virol 158:1003–1011. doi: 10.1007/s00705-012-1577-3. [DOI] [PubMed] [Google Scholar]
- 6.Mitnaul LJ, Matrosovich MN, Castrucci MR, Tuzikov AB, Bovin NV, Kobasa D, Kawaoka Y. 2000. Balanced hemagglutinin and neuraminidase activities are critical for efficient replication of influenza A virus. J Virol 74:6015–6020. doi: 10.1128/JVI.74.13.6015-6020.2000. [DOI] [PMC free article] [PubMed] [Google Scholar]
- 7.Rudneva IA, Kovaleva VP, Varich NL, Farashyan VR, Gubareva LV, Yamnikova SS, Popova IA, Presnova VP, Kaverin NV. 1993. Influenza A virus reassortants with surface glycoprotein genes of the avian parent viruses: effects of HA and NA gene combinations on virus aggregation. Arch Virol 133:437–450. doi: 10.1007/BF01313781. [DOI] [PubMed] [Google Scholar]
- 8.Rudneva IA, Sklyanskaya EI, Barulina OS, Yamnikova SS, Kovaleva VP, Tsvetkova IV, Kaverin NV. 1996. Phenotypic expression of HA-NA combinations in human-avian influenza A virus reassortants. Arch Virol 141:1091–1099. doi: 10.1007/BF01718612. [DOI] [PubMed] [Google Scholar]
- 9.Krunkosky TM, Fischer BM, Martin LD, Jones N, Akley NJ, Adler KB. 2000. Effects of TNF-alpha on expression of ICAM-1 in human airway epithelial cells in vitro. Signaling pathways controlling surface and gene expression. Am J Respir Cell Mol Biol 22:685–692. doi: 10.1165/ajrcmb.22.6.3925. [DOI] [PubMed] [Google Scholar]
- 10.Gubareva LV, Webster RG, Hayden FG. 2002. Detection of influenza virus resistance to neuraminidase inhibitors by an enzyme inhibition assay. Antiviral Res 53:47–61. doi: 10.1016/S0166-3542(01)00192-9. [DOI] [PubMed] [Google Scholar]
- 11.Potier M, Mameli L, Belisle M, Dallaire L, Melancon SB. 1979. Fluorometric assay of neuraminidase with a sodium (4-methylumbelliferyl-alpha-d-N-acetylneuraminate) substrate. Anal Biochem 94:287–296. doi: 10.1016/0003-2697(79)90362-2. [DOI] [PubMed] [Google Scholar]
- 12.Matrosovich MN, Gambaryan AS. 2012. Solid-phase assays of receptor-binding specificity. Methods Mol Biol 865:71–94. doi: 10.1007/978-1-61779-621-0_5. [DOI] [PubMed] [Google Scholar]
- 13.Reed LJ, Muench H. 1938. A simple method of estimating fifty percent endpoints. Am J Hyg 27:493–497. [Google Scholar]
- 14.Kemp PA, Sugar RA, Jackson AD. 2004. Nucleotide-mediated mucin secretion from differentiated human bronchial epithelial cells. Am J Respir Cell Mol Biol 31:446–455. doi: 10.1165/rcmb.2003-0211OC. [DOI] [PubMed] [Google Scholar]
- 15.Chan RW, Kang SS, Yen HL, Li AC, Tang LL, Yu WC, Yuen KM, Chan IW, Wong DD, Lai WW, Kwong DL, Sihoe AD, Poon LL, Guan Y, Nicholls JM, Peiris JS, Chan MC. 2011. Tissue tropism of swine influenza viruses and reassortants in ex vivo cultures of the human respiratory tract and conjunctiva. J Virol 85:11581–11587. doi: 10.1128/JVI.05662-11. [DOI] [PMC free article] [PubMed] [Google Scholar]
- 16.Van Poucke SG, Nicholls JM, Nauwynck HJ, Van Reeth K. 2010. Replication of avian, human and swine influenza viruses in porcine respiratory explants and association with sialic acid distribution. Virol J 7:38. doi: 10.1186/1743-422X-7-38. [DOI] [PMC free article] [PubMed] [Google Scholar]
- 17.Tate MD, Job ER, Deng YM, Gunalan V, Maurer-Stroh S, Reading PC. 2014. Playing hide and seek: how glycosylation of the influenza virus hemagglutinin can modulate the immune response to infection. Viruses 6:1294–1316. doi: 10.3390/v6031294. [DOI] [PMC free article] [PubMed] [Google Scholar]
- 18.Ehre C, Worthington EN, Liesman RM, Grubb BR, Barbier D, O'Neal WK, Sallenave JM, Pickles RJ, Boucher RC. 2012. Overexpressing mouse model demonstrates the protective role of Muc5ac in the lungs. Proc Natl Acad Sci U S A 109:16528–16533. doi: 10.1073/pnas.1206552109. [DOI] [PMC free article] [PubMed] [Google Scholar]
- 19.Matrosovich MN, Matrosovich TY, Gray T, Roberts NA, Klenk HD. 2004. Neuraminidase is important for the initiation of influenza virus infection in human airway epithelium. J Virol 78:12665–12667. doi: 10.1128/JVI.78.22.12665-12667.2004. [DOI] [PMC free article] [PubMed] [Google Scholar]
- 20.Cohen M, Zhang XQ, Senaati HP, Chen HW, Varki NM, Schooley RT, Gagneux P. 2013. Influenza A penetrates host mucus by cleaving sialic acids with neuraminidase. Virol J 10:321. doi: 10.1186/1743-422X-10-321. [DOI] [PMC free article] [PubMed] [Google Scholar]
- 21.Lin H, Carlson DM, St George JA, Plopper CG, Wu R. 1989. An ELISA method for the quantitation of tracheal mucins from human and nonhuman primates. Am J Respir Cell Mol Biol 1:41–48. doi: 10.1165/ajrcmb/1.1.41. [DOI] [PubMed] [Google Scholar]
- 22.Monsigny M, Roche AC, Sene C, Maget-Dana R, Delmotte F. 1980. Sugar-lectin interactions: how does wheat-germ agglutinin bind sialoglycoconjugates? Eur J Biochem 104:147–153. doi: 10.1111/j.1432-1033.1980.tb04410.x. [DOI] [PubMed] [Google Scholar]
- 23.Garten RJ, Davis CT, Russell CA, Shu B, Lindstrom S, Balish A, Sessions WM, Xu X, Skepner E, Deyde V, Okomo-Adhiambo M, Gubareva L, Barnes J, Smith CB, Emery SL, Hillman MJ, Rivailler P, Smagala J, de Graaf M, Burke DF, Fouchier RA, Pappas C, Alpuche-Aranda CM, Lopez-Gatell H, Olivera H, Lopez I, Myers CA, Faix D, Blair PJ, Yu C, Keene KM, Dotson PD Jr, Boxrud D, Sambol AR, Abid SH, St George K, Bannerman T, Moore AL, Stringer DJ, Blevins P, Demmler-Harrison GJ, Ginsberg M, Kriner P, Waterman S, Smole S, Guevara HF, Belongia EA, Clark PA, Beatrice ST, et al. 2009. Antigenic and genetic characteristics of swine-origin 2009 A(H1N1) influenza viruses circulating in humans. Science 325:197–201. doi: 10.1126/science.1176225. [DOI] [PMC free article] [PubMed] [Google Scholar]
- 24.Komadina N, Roque V, Thawatsupha P, Rimando-Magalong J, Waicharoen S, Bomasang E, Sawanpanyalert P, Rivera M, Iannello P, Hurt AC, Barr IG. 2007. Genetic analysis of two influenza A (H1) swine viruses isolated from humans in Thailand and the Philippines. Virus Genes 35:161–165. doi: 10.1007/s11262-007-0097-9. [DOI] [PubMed] [Google Scholar]
- 25.Shinde V, Bridges CB, Uyeki TM, Shu B, Balish A, Xu X, Lindstrom S, Gubareva LV, Deyde V, Garten RJ, Harris M, Gerber S, Vagasky S, Smith F, Pascoe N, Martin K, Dufficy D, Ritger K, Conover C, Quinlisk P, Klimov A, Bresee JS, Finelli L. 2009. Triple-reassortant swine influenza A (H1) in humans in the United States, 2005–2009. N Engl J Med 360:2616–2625. doi: 10.1056/NEJMoa0903812. [DOI] [PubMed] [Google Scholar]
- 26.Lakdawala SS, Lamirande EW, Suguitan AL Jr, Wang W, Santos CP, Vogel L, Matsuoka Y, Lindsley WG, Jin H, Subbarao K. 2011. Eurasian-origin gene segments contribute to the transmissibility, aerosol release, and morphology of the 2009 pandemic H1N1 influenza virus. PLoS Pathog 7:e1002443. doi: 10.1371/journal.ppat.1002443. [DOI] [PMC free article] [PubMed] [Google Scholar]
- 27.Matrosovich M, Klenk HD. 2003. Natural and synthetic sialic acid-containing inhibitors of influenza virus receptor binding. Rev Med Virol 13:85–97. doi: 10.1002/rmv.372. [DOI] [PubMed] [Google Scholar]
- 28.Thornton DJ, Rousseau K, McGuckin MA. 2008. Structure and function of the polymeric mucins in airways mucus. Annu Rev Physiol 70:459–486. doi: 10.1146/annurev.physiol.70.113006.100702. [DOI] [PubMed] [Google Scholar]
- 29.Ganesan S, Comstock AT, Sajjan US. 2013. Barrier function of airway tract epithelium. Tissue Barriers 1:e24997. doi: 10.4161/tisb.24997. [DOI] [PMC free article] [PubMed] [Google Scholar]
- 30.Hirst GK. 1943. Adsorption of influenza virus on cells of the respiratory tract. J Exp Med 78:99–109. doi: 10.1084/jem.78.2.99. [DOI] [PMC free article] [PubMed] [Google Scholar]
- 31.Ohuchi M, Asaoka N, Sakai T, Ohuchi R. 2006. Roles of neuraminidase in the initial stage of influenza virus infection. Microbes Infect 8:1287–1293. doi: 10.1016/j.micinf.2005.12.008. [DOI] [PubMed] [Google Scholar]
- 32.Yang X, Steukers L, Forier K, Xiong R, Braeckmans K, Van Reeth K, Nauwynck H. 2014. A beneficiary role for neuraminidase in influenza virus penetration through the respiratory mucus. PLoS One 9:e110026. doi: 10.1371/journal.pone.0110026. [DOI] [PMC free article] [PubMed] [Google Scholar]
- 33.Roy MG, Livraghi-Butrico A, Fletcher AA, McElwee MM, Evans SE, Boerner RM, Alexander SN, Bellinghausen LK, Song AS, Petrova YM, Tuvim MJ, Adachi R, Romo I, Bordt AS, Bowden MG, Sisson JH, Woodruff PG, Thornton DJ, Rousseau K, De la Garza MM, Moghaddam SJ, Karmouty-Quintana H, Blackburn MR, Drouin SM, Davis CW, Terrell KA, Grubb BR, O'Neal WK, Flores SC, Cota-Gomez A, Lozupone CA, Donnelly JM, Watson AM, Hennessy CE, Keith RC, Yang IV, Barthel L, Henson PM, Janssen WJ, Schwartz DA, Boucher RC, Dickey BF, Evans CM. 2014. Muc5b is required for airway defence. Nature 505:412–416. doi: 10.1038/nature12807. [DOI] [PMC free article] [PubMed] [Google Scholar]
- 34.Ito T, Couceiro JN, Kelm S, Baum LG, Krauss S, Castrucci MR, Donatelli I, Kida H, Paulson JC, Webster RG, Kawaoka Y. 1998. Molecular basis for the generation in pigs of influenza A viruses with pandemic potential. J Virol 72:7367–7373. [DOI] [PMC free article] [PubMed] [Google Scholar]
- 35.Walther T, Karamanska R, Chan RW, Chan MC, Jia N, Air G, Hopton C, Wong MP, Dell A, Malik Peiris JS, Haslam SM, Nicholls JM. 2013. Glycomic analysis of human respiratory tract tissues and correlation with influenza virus infection. PLoS Pathog 9:e1003223. doi: 10.1371/journal.ppat.1003223. [DOI] [PMC free article] [PubMed] [Google Scholar]
- 36.Gerken TA, Jentoft N. 1987. Structure and dynamics of porcine submaxillary mucin as determined by natural abundance carbon-13 NMR spectroscopy. Biochemistry 26:4689–4699. doi: 10.1021/bi00389a015. [DOI] [PubMed] [Google Scholar]
- 37.Varki A. 2010. Colloquium paper: uniquely human evolution of sialic acid genetics and biology. Proc Natl Acad Sci U S A 107(Suppl 2):S8939–S8946. doi: 10.1073/pnas.0914634107. [DOI] [PMC free article] [PubMed] [Google Scholar]
- 38.Bateman AC, Karamanska R, Busch MG, Dell A, Olsen CW, Haslam SM. 2010. Glycan analysis and influenza A virus infection of primary swine respiratory epithelial cells: the importance of NeuAc{alpha}2-6 glycans. J Biol Chem 285:34016–34026. doi: 10.1074/jbc.M110.115998. [DOI] [PMC free article] [PubMed] [Google Scholar]
- 39.Blumenkrantz D, Roberts KL, Shelton H, Lycett S, Barclay WS. 2013. The short stalk length of highly pathogenic avian influenza H5N1 virus neuraminidase limits transmission of pandemic H1N1 virus in ferrets. J Virol 87:10539–10551. doi: 10.1128/JVI.00967-13. [DOI] [PMC free article] [PubMed] [Google Scholar]