I. Overview
One way to study cell function is to eliminate the cell and observe subsequent developmental or behavioral abnormalities in the animal. In Caenorhabditis elegans, this is usually accomplished by killing individual cells or groups of cells with a laser microbeam. Laser killing has been used to determine the functions of many mature cell types, including neurons involved in locomotion, feeding, mechanosensation, and chemosensation (Chalfie et al., 1985; Avery and Horvitz, 1989; Bargmann and Horvitz, 1991a; Bargmann et al., 1993). These studies have been practical because only a few cell types appear to be absolutely required for viability (J. Sulston, pers. comm.; Avery and Horvitz, 1987; Bargmann and Horvitz, 1991b).
Laser ablation can also be used to ask how cells interact during development. Signaling and inductive interactions between cells can be examined by removing one cell and observing the development of the remaining cells. Killing the distal tip cells of the somatic gonad causes premature differentiation of the germ line, showing that the somatic gonad is required for maintenance of the germ line in an undifferentiated state (Kimble and White, 1981). Another form of cell interaction that can be observed is regulation to replace a killed cell (Sulston and White, 1980). If the precursor to the gonadal cell is killed, a second cell becomes the anchor cell, but the uterine cells usually generated by the second cell are absent (Kimble, 1981). Postembryonic cell interactions in the developing gonad, the hermaphrodite vulva, and the male tail have been particularly well characterized using laser killing (Sulston and White, 1980; Kimble, 1981; Kimble and White, 1981; Chamberlin and Sternberg, 1993). Other cells have been found to regulate specific aspects of each other’s development, such as cell migrations and axon outgrowth (Walthall and Chalfie, 1988; Thomas et al., 1990; Li and Chalfie, 1991; Garriga et al., 1993).
The developmental potential of cells in the early embryo has also been explored by killing cells with a laser (e.g., Sulston et al., 1983; Priess and Thomson, 1987; Schnabel, 1994). These experiments are particularly useful because classic embryological manipulations like transplantations and microdissections have only been possible for the first few blastomeres of the C. elegans embryo.
Laser killing can assist in the interpretation of mutant phenotypes in several ways. If a cell interaction or cell function has been defined by killing a cell, genes that affect that cell may be identified by isolating mutants with phenotypes similar to cell killing (Ferguson and Horvitz, 1985; Austin and Kimble, 1987; Bargmann et al., 1993). In addition, killing cells in mutant animals can provide insights into the defects associated with a mutation (Waring and Kenyon, 1990; Bargmann and Horvitz, 1991b; Mello et al., 1992).
Laser ablation can also be used to probe cell function in nematode species that are not accessible to genetic analysis. Laser killing of vulval cell precursors has been used to elucidate cell interactions in Mesorhabditis and Teratorhabditis nematodes (Sommer and Sternberg, 1994).
Individual cells can be killed in C. elegans by damaging them with a laser microbeam focused through the objective of a microscope. The first apparatus used for this purpose was developed by John White (Sulston and White, 1980). Subsequent technical refinements have made this technique easier and more reproducible (J. G. White, pers. comm.; Avery and Horvitz, 1987). The laser beam is focused in three dimensions on a single spot in the field of view of a microscope. A cell of interest is aligned with the laser beam. Damage to the cell and adjacent structures can be visualized through the microscope during and after the operation. These methods can be applied to any cell, but this discussion is biased toward neurons because of the expertise of the authors.
II. Identifying Cells in Caenorhabditis elegans
Identifying cells unambiguously is probably the most difficult part of the laser operation. Rigorous identification of a cell type can be accomplished by following cell lineages through embryonic or postembryonic divisions (Sulston and Horvitz, 1977; Kimble and Hirsh, 1979; Sulston et al., 1980, 1983). This approach is practical if a cell can be killed soon after its birth; it is the only method that works well for many blast cells in the embryo. Following cell divisions can be very time consuming, but, fortunately, most cells in C. elegans are found in reproducible positions. Therefore, for many cell types a combination of morphological cues and position can be used to identify the cells in wild-type animals without following cell lineages.
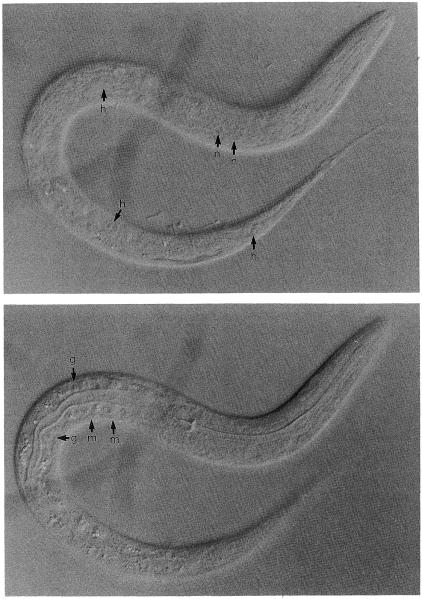
The nuclei of different cell types have characteristic appearances by Nomarski microscopy (Fig. 1). Hypodermal nuclei and gut nuclei have a “fried egg” appearance; they are round and smooth in texture with a large, prominent nucleolus. Neuronal nuclei are smaller and round, lack prominent nucleoli, and have a punctate nucleoplasm (“pepperoni” appearance). Muscle nuclei are oblong, are intermediate in size between neuronal and hypodermal nuclei, and have a punctate nucleoplasm and a small nucleolus.
Fig. 1.
Appearance of different cell types. L1 animal viewed by Nomarski optics under a 100× Neuflour objective (Zeiss). h, hypodermal nucleus; n, neuronal nucleus; g, gut nucleus; m, muscle nucleus.
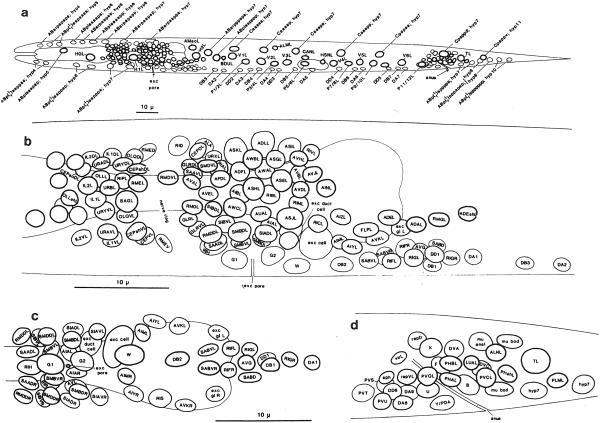
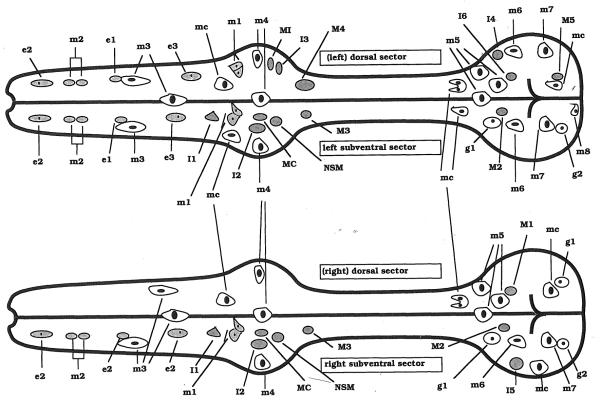
The optimal time for finding a cell varies depending on the particular cell type. Most cells are most easily seen using Nomarski microscopy in very young larvae. As the animals age, optical interferences makes visualization of cells in deep focal planes more difficult. Many neurons can be identified at the beginning of the first larval stage (L1) (Fig. 2). In the pharynx, nuclei may be easier to see in the L2 stage. Cells in the pharynx can be identified by using the diagrams in Fig. 3. The pharynx and nerve ring do not change much during postembryonic development.
Fig. 2.
Position of nuclei in L1 larvae. (a) Positions of nuclei in L1 larvae (left lateral view). (b) Neuronal nuclei in the head (left lateral view). (c) Neuronal nuclei in the head (ventral view). (d) Neuronal nuclei in the tail (left lateral view). Anterior is to the left. In a, b, and d, only the left laternl nuclei and the medial nuclei arc shown. Most right lateral nuclei occupy positions similar to those of their homologs on the left side; the exceptions arc found most on the ventral side (see c). The thickness of the nuclear outline is inversely related to the depth of the nucleus within the worm (e.g., in b. lateral nuclei have thick outlines and medial nuclei have thin outlines). Reprinted, with permission, from Sulston et al. (1983).
Fig. 3.
Positions of nuclei in the pharynx. Courtesy of Ron Ellis.
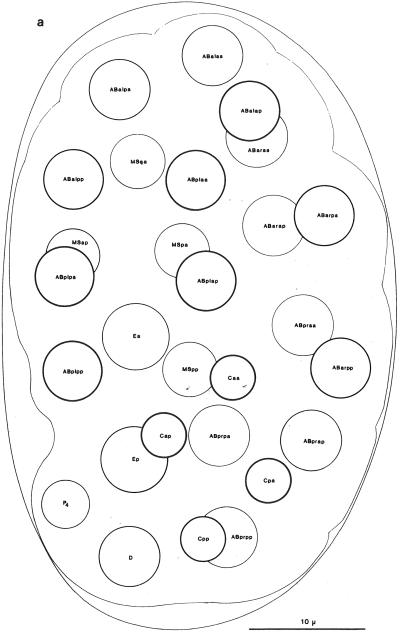
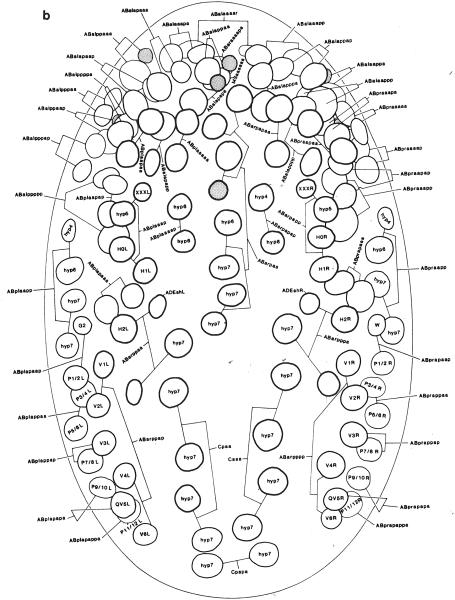
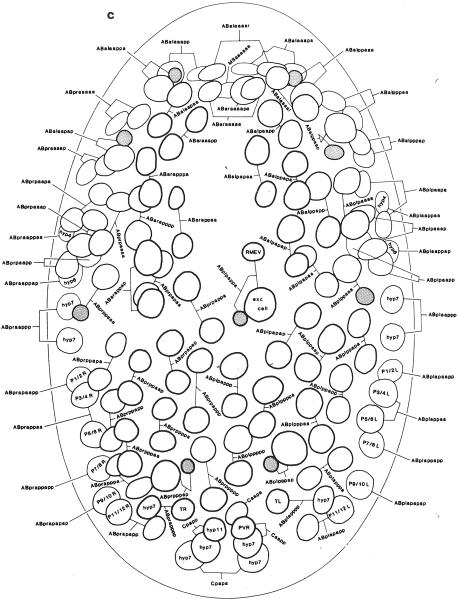
Once postembryonic divisions begin (about 5 hours after hatching), it may be necessary to stage the animals carefully or follow cell lineages to identify cells unambiguously in the body and tail. Embryonic and postembryonic blast cells are described in detail in Sulston et al. (1983) and Sulston and Horvitz (1977). A few stages can be learned as starting points for following lineages, including the 28-cell stage in the embryo (Fig. 4), the Bα/β/γ/δ stage in the male tail, and the 12-cell stage at the hermaphrodite vulva (Sulston and Horvitz, 1977).
Fig. 4.
Embryonic nuclei. (a) Twenty-eight-cell embryo 100 minutes, left dorsal aspect. (b) Embryo, 260 minutes, dorsal aspect, superficial nuclei. (c) Embryo, 270 minutes, ventral aspect, superficial nuclei. Anterior is at top. The thickness of the nuclear outline is inversely related to the depth of the nucleus within the worm. Reprinted, with permission, from Sulston et al. (1983). For detailed descriptions of embryonic and postembryonic cell divisions, see Sulston and Horvitz (1977), Kimble and Hirsh (1979), and Sulston et al. (1983).
Some cells cannot be identified reliably by position because of natural variability in their location. The most difficult areas are (1) the posterior lateral ganglia in the head (AIN, RIC, AIZ, ADEso, AVD) (2) the anterior socket and sheath cells in the head (AMSo, ILsh, ILso, OLQso) (3) postembryonic neurons in the tail, and (4) postembryonic neurons in the ventral nerve cord.
It is easiest to learn the position of particular cells in animals in which a few cell types are labeled. For example, a few cells in the nerve ring and a few cells in the tail are stained with the fluorescent dye fluorescein isothiocyanate (FITC) (Hedgecock et al., 1985). Simultaneous observation of Nomarski images and fluorescent images of these cells can be used to learn their positions. Once these cells are familiar, it can be relatively simple to identify adjacent cells. Similarly, fixed animals can be doubly stained with an antibody and 4′,6-diamidino-2-phenylindole (DAPI, which strains all nuclei). Comparison of the fluorescent images can be used to learn the position of a cell that can be subsequently be sought in live animals. Some useful staining techniques and antibodies are listed in Chapter 16 of this volume. In the future, cell identifications should be assisted by the availability of promoter fusions with the green fluorescent protein (gfp) of the jellyfish Aequorea victoria (Chalfie et al., 1994). Cells expressing gfp can be examined simultaneously by Nomarski microscopy and fluorescence in live animals.
Visualizing cells that contain any of these markers by fluorescence microscopy can damage or kill these cells and adjacent cells, so fluorescence microscopy should be avoided during the laser operation procedure. Fluorescent markers, however, may be used at the end of an experiment to confirm the deaths of operated cells or the survival of nearby cells.
III. Practical Aspects of Laser Ablation
A. Theory
When a laser microbeam is fired at a C. elegans nucleus, at least three things happen: deposition of energy in the nucleus, followed by transport, followed by energy-induced damage. In this drama deposition is the hero; it places the energy with remarkable precision just where you aim the beam. Transport is the villain; it moves the energy from where it was deposited to other places, such as cells or structures you are trying not to hurt. Damage is the dark mystery. Almost nothing is known about how laser energy destroys a C. elegans nucleus. Energy deposited in the irradiated nucleoplasm eventually takes the form of increased temperature and pressure, either of which can denature proteins, break DNA, and so on. We can plausibly assume that damage is a steeply increasing nonlinear function of energy, as the rate of a chemical reaction will increase exponentially with temperature. Thus if the energy is doubled, damage is much more than doubled. In fact, for this discussion we assume it is the peak pressure or temperature experienced at a given point that determines how much damage happens there.
1. Energy Deposition
There are two leading candidate mechanisms for the deposition of energy. The first and most obvious is direct absorption of the laser light. Light enters the specimen from above in a broad symmetrical cone. For example, using an objective with a numerical aperture of 1.30, light is focused onto the specimen from angles up to 80° from the axis. It exits below in a similar cone. One might expect that absorption would drop off in the same way. In fact, one can do much better if there is nonlinear absorption. For example, if the wavelength is 440 nm, and if the specimen absorbs poorly at 440 nm but well at 220 nm, there will be two-photon absorption at sufficiently high light intensities. Two-photon absorption goes as the square of the light intensity, so energy deposition by this mechanism drops as the inverse fourth power of distance from the focus. Simple calculations suggest that the light intensity in typical C. elegans laser ablation experiments is indeed high enough for multiphoton absorption.
The second candidate mechanism for energy deposition is mechanical. Refractive index gradients within the nucleoplasm deflect the light. Because light has momentum, particles that deflect the light also recoil. The effect in this case is to compress higher-refractive-index materials into the focus of the beam. Optical tweezers use a benign version of this same effect to manipulate microscopic objects (Ashkin et al., 1987). The boundary of the compressed region will be the edge of the spot to which the laser light is focused.
The net effect of either multiphoton absorption or refractive compression is increased pressure and temperature. Absorption directly causes a temperature increase, and the temperature increase, by expanding the heated material, causes a pressure increase. Compression directly causes a pressure increase, and the work done in compressing the material is partly turned into heat. In either case, the initial size of the high-pressure and -temperature region is about the same as the size of the spot to which the laser beam is focused. The laser light can be focused to a spot whose diameter is about the same as the wavelength of the laser light, typically about 400 nm. This is very small, even compared with the smallest of C. elegans nuclei (2000 nm). Energy can thus be deposited very precisely.
2. Transport
Unfortunately, although energy can be deposited very precisely, it can also move. Energy that moves away from the site of deposition can cause damage distant from that site. This is obviously undesirable if one is trying to kill a single cell. Thus operations should be done in such a way as to minimize transport.
a. Pressure
Mechanical energy is transported away from the beam focus by sound waves or, if the pressure is high enough, supersonic shock waves. If the beam is symmetrical, these waves will be roughly spherical, and the peak energy experienced at a point will be inversely proportional to the square of its distance from the focus. If the laser beam is not uniform, pressure jets may form; these will not dissipate as quickly with distance.
b. Heat
Heat is transported by diffusion. It is useful to start by considering two extremes: heat deposited continuously at a point over a long time, and heat deposited at a point during a very brief pulse. For the long-term case, heat diffusing away from the point source will reach a steady state, where the temperature increase is inversely proportional to distance from the source. Thus, if the temperature is 200°C above ambient 200 nm from the source, it will be 100°C above ambient 400 nm from the source. In contrast, if heat is deposited in a very brief pulse, steady state will not be achieved. The heat will gradually diffuse away, and temperature at a distance from the source will increase, reach a peak, and then decrease. The peak temperature increase for this case is proportional to the inverse cube of distance from the source. Thus, if a peak temperature of 200°C above ambient is achieved 200 nm from the source, a peak increase of 25°C will be achieved 400 nm away.
On the basis of these considerations, it is better to deposit heat in brief pulses, with sufficient time for dissipation between pulses. A pulse can be considered brief if it is much shorter than the time required for heat to diffuse a distance of the radius of the spot in which it is deposited, about 200 nm, as described above. The time to diffuse an average (root mean squared) distance r is t = r2/(6D), where D = 10−3 cm2/s is the diffusion coefficient of heat in water. Thus, a pulse is brief if it lasts much less than 70 nanoseconds and long if it lasts much longer.
The first system for laser killing of C. elegans cells, introduced by John White (White and Horvitz, 1979; Sulston and White, 1980), used a dye laser excited by the light from an electric discharge through a gas. The typical pulse length was 500 nanoseconds. In 1984 White began using a dye laser excited by a nitrogen laser, with a pulse length of 0.2 nanosecond. He discovered that a lower-energy pulse could be used than with the discharge-excited laser and that damage was more localized. This result is understandable from the above discussion. During the 500-nanosecond pulse, heat was diffusing away as it was deposited. To get the same peak temperature, it was necessary to put in more energy. This energy heated up and damaged a larger region.
The most widely used laser systems employ nitrogen laser-excited dye lasers with 3-nanosecond pulse lengths. Three nanoseconds is much less than 70 nanoseconds, so these pulses are expected to work as well as the 0.2-nanosecond pulses of White’s first nitrogen laser. Our experience confirms this expectation.
These calculations also show that heat dissipates rapidly between pulses. Typical lasers used for killing C. elegans cells cannot fire faster than once in 50 milliseconds. Even at this maximum rate the heat from one pulse will dissipate before the next is fired.
3. Summary
For maximum precision in laser killing, energy transport must be minimized. We make three recommendations, which make theoretical sense and are borne out in practice:
Make the laser irradiation uniform and symmetrical to minimize pressure jets.
Use brief light pulses to minimize heating distant from the beam focus.
Use many low-energy pulses rather than a few high-energy ones to minimize damage distant from the focus, as damage is probably a steeply increasing function of pressure and temperature.
B. The Laser Apparatus
A laser ablation system consists of a laser, a microscope, and some optics to direct the beam of the laser into the microscope objective. The microscope and the laser can be bought off the shelf. It is also possible to buy coupling optics, but they are expensive and not much easier to set up or use than homemade optics.
Detailed instructions for setting up a laser ablation apparatus (including a parts list) are currently available on the Internet from eatworms.swmed.edu by anonymous FTP, gopher, or World-Wide-Web client programs such as NCSA Mosaic.
1. Components
a. Microscope
The microscope is the most important (and most expensive) part of the laser ablation system. It must be of the type used for cell lineage analysis: a compound microscope with Nomarski differential interference contrast optics and an objective of sufficient quality that individual nuclei can be easily identified. To focus the laser beam, this objective should have a numerical aperture of at least 1.25. You should also get a low-power objective to use in finding the worms. The low-power objective does not need differential interference contrast optics.
The microscope must have an optical port through which the laser beam can enter. One solution is to purchase the optics for epifluorescence illumination and bring the laser light in through the port to which the excitation light source would usually be attached. A beam splitter is needed to reflect the laser light down into the specimen while allowing light transmitted up through the specimen to reach the eyepiece so that you can see what you are doing. A barrier filter is also necessary to prevent reflected laser light from reaching the eyepiece. With the wavelengths typically used, the beam splitter and barrier filter from a fluorescein filter set work well. The excitation filter of the set, which is between the light source and the beam splitter, should be removed. An ocular micrometer reticle should be installed in one of the eyepieces. It will be used in locating the focus of the laser during killing (see Section III,C).
b. Laser
The laser should be a dye laser pumped by a nitrogen laser. The pulse energy necessary to kill cells is roughly 5 mJ. Higher pulse energies are useful, as one can improve the uniformity of illumination of the specimen by using only the center of the beam. In addition, there may be energy losses in the microscope. For example, in some microscopes the laser beam passes through the analyzer on its way to the specimen, decreasing the energy by a factor of 2.
Lasers have the potential to cause eye damage and should be treated with respect. The main safety problems come in setting up and aligning the laser. Ultraviolet safety glasses should be worn if the laser is opened so that the UV beam is exposed. You cannot wear glasses to block the visible beam, as you need to see it to align it, but you should avoid looking up the beam and avoid specular reflections off mirrors, microscope slides, and so on. (Diffuse reflections, e.g., from a piece of paper, are not dangerous.)
c. Optics
The coupling optics do two things. First, they shape the beam so that it enters the specimen from the full available range of angles and comes to a focus at a point in the image plane. Second, they allow beam location and angle to be adjusted by moving lenses and mirrors, rather than microscope and laser. Lenses and mirrors can be mounted in optical positioning equipment that allows fine, stable, continuous adjustment. As six separate adjustments are necessary to make the laser system operate properly, stable adjustment is important. The design of the coupling optics is the single most important factor in determining how convenient the laser system will be to use. The coupling optics are far less expensive than the laser and microscope, so even a lavish system does not increase the overall cost much.
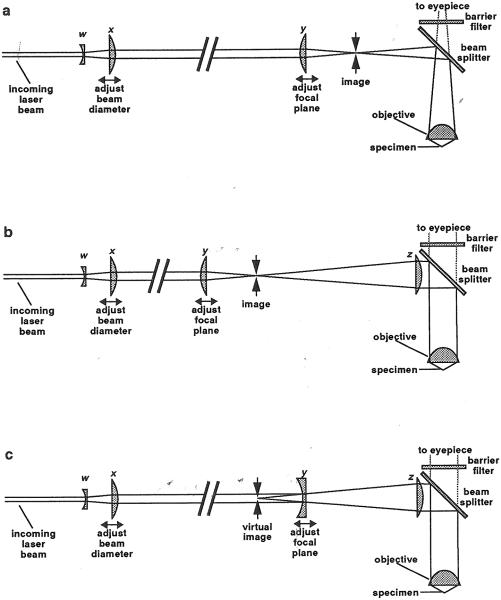
Figure 5 shows the lenses used to shape and focus the beam. The most important lens is the microscope objective. Years ago virtually all microscope objectives were designed to produce an image of the specimen 160 mm behind the objective. Figure 5a shows a laser ablation system based on this type of microscope. Lens y focuses the beam to a point within the image, so that it will focus to a corresponding point within the specimen. Lens y can be moved along the beam axis to adjust the focus of the laser so that it corresponds to the visible image. If lens y is moved toward the laser, the focus will move upward in the specimen. Today, many microscopes use infinity-corrected objectives: All the rays of light from a single point in the specimen exit the objective parallel (Fig. 5b). The laser light cannot be focused to a point in the image, because no image is formed. In this case one uses an additional lens (z in Fig. 5b) to form an image.
Fig. 5.
Optics for laser ablation. (a) Optics for use with a microscope objective that forms an image 160 mm away. Lenses w and x form a Galilean telescope. Beam diameter can be changed by moving lens x. Lens y focuses the beam to a point in the image of the specimen, so that it will also focus to a point within the specimen itself. The distance between x and y is larger in proportion to other distances than shown. This is indicated by a break in the beam. The beam splitter reflects blue laser light into the specimen while passing longer-wavelength light to the eyepiece so that the worm can be seen. The barrier filter prevents stray laser reflections from reaching the eyepiece. (b) Optics for use with a microscope objective that forms an image at infinity. This arrangement is identical except for the addition of a new lens z. With this type of objective, all the rays from a point in the specimen come out parallel, so that there is no image plane. Lens z form an image in which the laser beam can be focused. Lens z may be an additional lens you insert, or it may be part of the microscope. It may be more complex than a single lens. (c) A variation, useful if there is not enough space for the arrangement shown in b. Lens y is now concave instead of convex, and causes the laser light to diverge to the right of the lens as if it were emanating from a point (the virtual image) to the left.
To determine whether your microscope forms an image, use the low-power objective to focus the condenser so that you see a sharp image of its image-plane diaphragm. Close the image-plane diaphragm and open the diffraction-plane diaphragm as far as possible. Turn the microscope light up all the way, and take the polarizer, analyzer, and any filters out of the light path. Finally, put in place the beam splitter that will be used to reflect laser light into the objective. If you now turn the room lights off and hold a white card outside the port through which laser light is destined to enter, you will see a beam of light coming out of the microscope. If the beam gets narrower as you move the card away from the microscope, your microscope forms an image. You can locate the image approximately by finding the place where the beam narrows to a point (actually, a tiny image of the diaphragm). If the beam diameter stays the same or increases as you move the card away from the microscope, you need an extra lens as in Fig. 5b.
It is important that laser light enter the specimen from the widest possible range of angles, which means that beam diameter must be at least large enough to illuminate the entire objective. (To determine whether the beam diameter is large enough, unscrew the high-power objective from its mount, then compare the size of the spot of laser light on a card held under the hole with the opening in the back of the objective.) Lenses w and x form a simple Galilean telescope that allows the beam diameter to be adjusted. If lens x is moved slightly toward the laser, the beam will diverge slightly as it leaves the telescope, so that its diameter will be larger at lens y and the objective. If the beam is larger than the objective, only the center will enter. Thus, as lens x is moved toward the laser, less of the light enters the objective, so that the illumination becomes weaker, a useful way of adjusting the intensity. It also improves the uniformity of the illumination, as the center of the beam is the most uniform. Intensity can also be adjusted by interposing neutral density filters in the beam or, for very small changes in intensity, microscope slides.
Of course, unlimited variations on these arrangements are possible. For example, the light path in Fig. 5b can be shortened by using a concave lens instead of a convex lens (Fig. 5c). In our example, we place a mirror between y and z to bend the light path so that the laser can be more conveniently placed on a desktop.
2. An Example
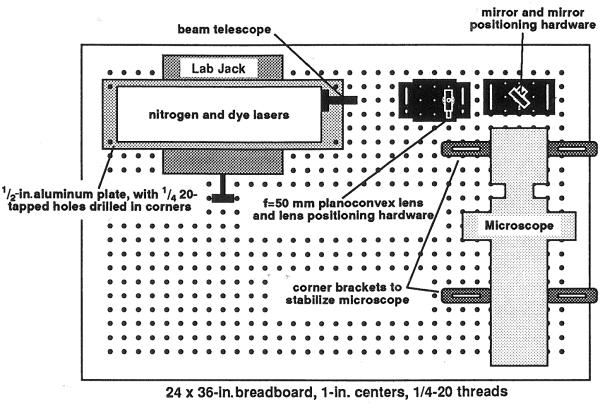
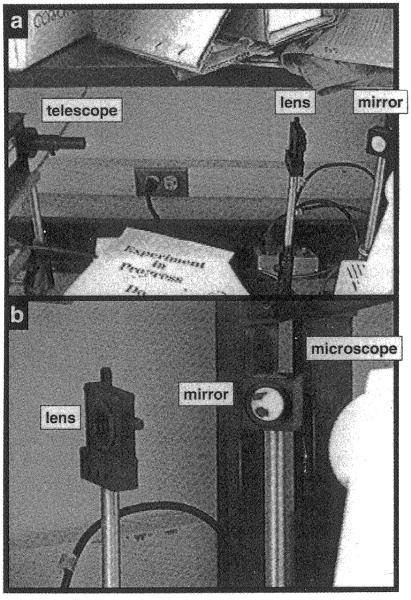
Figure 6 shows the arrangement of the laser, microscope, and coupling optics in a laser ablation system similar to that in use in one of our laboratories. The laser combination is a VSL-337 nitrogen laser with a DLM-110 dye laser, both from Laser Science Incorporated. These lasers are small, self-contained, and relatively inexpensive (about $6000 at the time of writing). The dye solution is 5 mM coumarin 120 (7-amino-4-methylcoumarin) in ethanol. With this dye, the laser produces 3-nanosecond pulses of 440-nm light with an energy of about 30 mJ. The coupling optics are a telescope (Laser Science Incorporated) for adjusting beam diameter (lenses w and x of Fig. 5), a 50-mm focal length planoconvex lens (Newport Optical) to focus the beam to a point in an image of the specimen (lens y of Fig. 5), and a mirror (Oriel Corporation) to direct the beam into the microscope. The microscope is a Zeiss Axioskop with epifluorescence optics. The Axioskop uses infinity-corrected optics, so our system is most similar to that of Fig. 5b. In this case lens z of Fig. 5b corresponds to two lenses within the microscope that form the epifluorescence condenser.
Fig. 6.
Mechanical arrangement of the laser, microscope, and coupling optics.
Laser light enters through the port on which an arc lamp would normally be mounted for excitation of fluorescence. On the Axioskop this port is at the back of the microscope, 30 cm above the table top, so the laser and coupling optics are elevated on steel rods (Fig. 7), mounted in rod holders that allow crude adjustment of the height. The mirror is placed in a mount that allows fine adjustment of its angle. The lens mount allows fine adjustment of its position in the plane perpendicular to the beam. (Rods, rod holders, and mounts are from newport and Oriel.) These adjustments are used for aligning the angle at which the beam enters the microscope and the location in the specimen at which it comes to a focus. The lens mount is fastened to a translation stage (Newport Optical) that allows fine movement along the beam axis, which moves the focus up and down in the specimen. All these components are stably mounted on an optical breadboard (Technical Manufacturing Corp.).
Fig. 7.
Photographs of the optical elements. (a) The telescope, mounted on the laser, corresponds to lenses w and x in Fig. 5. The lens corresponds to lens y of Fig. 5. Lens z of Fig. 5b is inside the microscope. The mirror (not shown in Fig. 5) is between lenses y and z. The lens, mirror, and laser are mounted on steel posts. The lens and mirror mounts allow their positions to be adjusted. (b) Closeup showing the lens, mirror, and back of the microscope.
C. Cell Killing
1. Prepare Slide
Agar for slide consists of 5% agar in M9 (for 1 liter of M9: 3 g KH2PO4, 6 g Na2HPO4, 5 g NaCl, l ml 1 M MgSO4). This stock is autoclaved and stored in small (5-ml) aliquots, sealed with Parafilm to prevent dehydration. Individual aliquots of agar are melted in a microwave or over a flame. Melted agar can be kept at 65°C for up to 2 days.
Sodium azide 3–10 mM (anaesthetic) is added to the melted agar. Azide arrests development, so it should be omitted if cell lineages will be followed. Azide is also usually omitted if embryonic cells will be killed.
Slide preparation is shown in Fig. 8. A drop of melted agar is placed on a slide and flattened into a pad. Two slides with a single thickness of tape are used as guides for flattening the agar into a pad, so the final thickness of agar is the same as that of the tape. Prepare the slide immediately before use.
Fig. 8.

Slide preparation. Melted agar is placed on the surface of the slide. A second slide is used to flatten the agar into a thin pad. The thickness of the agar pad is set using two guide slides to which a piece of tape has been attached. After liquid and worms have been placed on the slide, a coverglass is placed on the slide.
2. Place Worms on Slide at Dissecting Microscope
Work quickly. Place 1 μl of M9 on the agar. Quickly pick up about 5 to 15 L1 worms with a platinum wire and elute them into the drop of M9 with gentle shaking. Count the worms in the liquid, then place a coverslip on the slide. Make a drawing of the worms on the slide. This drawing will be a guide for finding the worms under the compound microscope at the laser.
It is possible to mount all of the worms in a small region, in which case a drawing is unnecessary. After releasing the worms into the drop of M9, use an eyelash to draw the worms and a small amount of liquid apart from the original drop of M9. When the coverslip is placed on the slide, the worms will remain together in one area.
Prepare a set of control animals from the same plate. These animals should be placed in azide and rescued at the same time as the operated animals.
To facilitate cell identifications, slides should be prepared so that most animals are oriented exactly on their left or right sides, as shown in Figs. 1 to 3. Animals will take this orientation if they are swimming actively when the coverslip is placed on the agar. For best results, (1) prepare slides very quickly (2) treat animals gently, and (3) limit the amount of liquid on the slide to 1 to 2 μl.
If slide preparation is slow, many worms will be mounted so that their dorsal or ventral side is uppermost. If this orientation is desirable, use the higher recommended azide concentrations and place the coverslip on the slide after the worms have been anesthetized by the azide (this takes only a few minutes). Shift the coverslip very slightly after it is in place. Many of the worms should lodge in a ventral-up or dorsal-up position.
If cells are being killed in the embryo, mount embryos of the appropriate stage. If early embryos (<50 cells) are desired, they should be released from gravid hermaphrodites. Elute about 10 hermaphrodites into 10 μl of M9 on a microscope slide (without agar). As the animals swim in the liquid, cut them in half with a sharp razor blade by pressing them onto the glass slide. Eggs will be released into the liquid. Using a capillary pipet, move the eggs onto an agar pad without azide. To prevent air bubbles from forming, extra M9 can be placed on the slide before the coverslip is added. Cell lineages can be followed or cells killed as desired.
3. Use the Laser
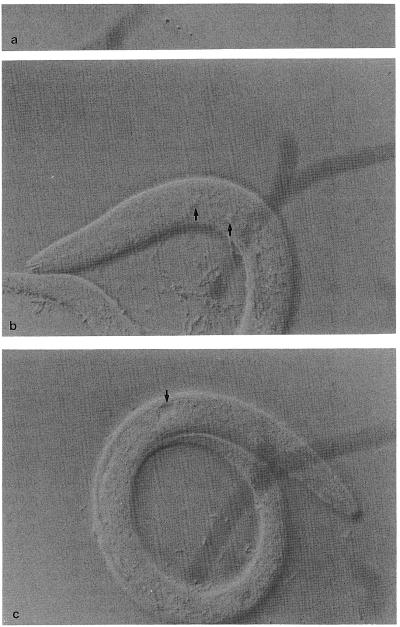
To find the position of the laser spot, fire the laser using the manual control or the foot pedal and focus on the coverslip. When the laser is focused in the plane of the coverslip, it will make a small hole in the glass (Fig. 9a). Move the micrometer in the eyepiece until it is aligned with the laser spot. Now the sample can be moved so that the same part of the micrometer is over the cell of interest, and firing the laser will hit that cell.
Fig. 9.
Laser damage. (a) Damage to the glass coverslip, used to locate the laser spot. (b) Damaged nuclei following laser operations (arrows). (c) A ruptured basement membrane (note the fluid-filled cavity).
Set the laser power by adding or removing neutral density filters between the laser and the scope. To kill neurons, add filters until the laser can just make a small hole in the coverslip. To kill larger cells such as hypodermal cells, reduce the neutral density filters so that the beam is about twice as intense. To kill large founder cells in the embryo, the beam should be about eight times as intense as needed to break holes in the coverslip. At these power levels, it should take between 20 and 200 laser bursts to kill a cell. If cell damage is observed more rapidly, neutral density filters should be used to reduce the beam intensity.
Find animals using the diagram prepared above (not necessary if the worms are all in one place). Animals may move during the recovery process, so it is best to kill the same cell or group of cells in all of the animals on a single slide. When killing cells, it is best to start by killing cells on the far side of the animal. Any nonspecific damage induced by firing the laser through the animal should be visible in the closer planes of focus. Animals in 3 mM azide can be kept on the slide for approximately 1 hour, after which nonspecific cell damage and toxicity are observed. At 10 mM azide, animals should be kept on the slide no longer than 15 minutes.
Make sure to consider eye safety throughout this procedure. Avoid looking at the laser beam or direct reflections of the laser beam. Exposure to the beam can be reduced by keeping the external mirrors and lens in a protective housing. With a properly installed barrier filter in the filter set, no reflections of the beam should reach the eyepiece.
4. Monitor Damage
After laser killing any one of the following kinds of damage may be considered sufficient to kill the cell (Fig. 9b):
Nucleus disappears
Nucleus takes on a buttonlike appearance characteristic of programmed cell death (Sulston and Horvitz, 1977).
Nucleus changes in refractive index and cell boundary becomes clearly visible.
Scar from laser transects nucleus.
Damage may take up to 30 minutes to develop but is usually visible within 1 minute of the operation. Discard the animal if a basement membrane is punctured (recognized as the sudden appearance of a fluid-filled pocket that expands near the site of ablation, Fig. 9c). Discard all animals in which the cuticle is punctured (visible as oozing or bubbling of material from the animal near the site of the operation).
Kill all undesired animals on the slide by puncturing the cuticle with the laser. To break the cuticle, fire the laser at the underside of the coverslip over the worm (this causes a small explosion). Puncturing the cuticle is easiest in the posterior part of the animal. If all extra animals are killed, the rescue step is easier because only desired animals are viable.
5. Rescue Animals
Draw 1to 2 μl of M9 into a drawn-out capillary pipet. Slide the coverslip off the slide very gently, by gliding and not by pressing down on the coverslip. If this is done smoothly, the worms will remain in place and can be located using the diagrams prepared at the beginning. The worms are very vulnerable and dehydrated at this point.
Using suction, release a bit of liquid from the capillary pipet, draw the worm into the pipet, and release the worm onto a seeded NGM plate. The worm should start moving again within an hour or two and will be an adult in 3 days. Confirm the specificity of the operation as described below:
IV. Experimental Design and Controls
Interpreting the result of laser killing depends on the answers to two questions: Has the operated cell lost all function? Have additional cell types been damaged? Because the nucleus is the structure most easily visualized by Nomarksi optics, laser damage is usually assessed by the appearance of the nucleus; however, cells may maintain some function even in the absence of a nucleus. For example, when the nuclei of the touch cells are killed in the third larval stage, touch cell processes and function are maintained in the adult (Chalfie et al., 1985).
Killing cells early in development maximizes the chances that they will lose function. In general, killing a cell nucleus in the first larval stage appears to eliminate cell function by the adult stage. For several types of neuronal cells, functional data and electron microscopy confirm that neuronal processes lose function within 24 to 48 hours if the nucleus is damaged by the laser in the first larval stage (Avery and Horvitz, 1987, 1989; Bargmann and Horvitz, 1991a).
Alternatively, the precursor of the cell of interest can be killed during development so that the cell is never generated. This approach often leads to the elimination of several cell types. It is especially important to examine adjacent cells for any changes in cell fate when precursor cells are killed. Most cell interactions are confined to a short period (minutes to hours), so the timing of cell killing is particularly important when cell interactions take place.
In addition to technical issues, two classes of intellectual problems limit the interpretation of cell killing results:
Redundant functions. In several cases, a particular defect is observed only when several cell types are all killed together (Avery and Horvitz, 1989; Bargmann and Horvitz, 1991b; McIntire et al., 1993). Therefore, killing one cell may reveal only a subset of the functions of that cell.
Multiple effects of one cell. If a cell participates in several distinct biological processes, some effects may be hard to observe. For example, if a cell is essential for viability, it may not be possible to determine whether it functions in a particular behavior. Also, the death of one cell may have indirect effects on the development, survival, or functions of other cell types.
A. Assessing Damage to the Operated Cell
Verification is essential for every laser operation. The amount and timing of damage required to eliminate a given cell are determined empirically, using the following guidelines:
Closely observe the cell of interest and adjacent cells for 5 to 10 minutes after the laser observation.
Confirm cell death 1 hour to 1 day after the operation (remount the animal on a slide, search for the killed cell, and examine cells in the vicinity).
Confirm cell identity and cell death by some method other than observing the nucleus, if possible. For example, if an antibody is known to recognize the cell of interest or nearby cells, animals can be stained with the antisera after laser killing of the cell. Other functions of the cell may also be assessed. These experiments often require that the animal be killed and may be practical only after the end of the experiment.
If possible, compare the results of killing a cell and killing precursors to that cell.
B. Unintended Damage
The simplest way to establish that cells adjacent to the killed cell are intact is to observe their appearance and function directly. After killing a cell, antibodies or assays specific for adjacent cells should be used to determine whether those cells are normal. If an effect of killing a cell is seen, it is also useful to kill all of the surrounding cells and not the cell of interest. This control can ensure that the intended cell is responsible for a particular effect.
Difficulties in interpretation arise if the death of a cell leads to retarded development or small size, as accidental damage to the pharynx or cuticle will retard development. To verify that a specific cell death retards development, the protocols can be modified to minimize nonspecific effects of the operation. Reducing the amount of time the animals spend on azide to less than 15 minutes leads to faster and more efficient recovery from anesthesia. Short times under azide should be used for any protocol in which development is slowed. Reducing the power from the laser beam by using neutral density filters decreases unintended damage from the laser, so minimal laser energy should be used in all experiments.
V. Future Directions
Laser killing can be a precise and versatile tool for eliminating specific cells in an animal. Its usefulness is limited, however, because of the difficulty of identifying each cell, particularly during development, and because of the small numbers of animals that can be generated. Several emerging techniques may be useful for killing defined cells in larger numbers of animals.
A. Degenerin Expression
Dominant alleles of mec-4 and deg-I lead to the deaths of subsets of neurons (Chalfie and Wolinsky, 1990; Driscoll and Chalfie, 1991). These two genes encode related transmembrane proteins (“degenerins”) that are similar to the amiloride-sensitive epithelial sodium channel; the dominant alleles may produce hyperactive or unregulated channel proteins. Expression of a dominant allele of mec-4 under the control of different promoters leads to the death of cells in which it is expressed (M. Driscoll, pers. comm.; A. V. Maricq and C. I. Bargmann, unpublished). If a promoter exists for a cell type of interest, a mec-4 fusion gene can be used to produce a line of transgenic worms that lack those cells. A similar technique is being developed using the cell death genes ced-3 and ced-4. (S. Shaham, pers. comm.).
B. Photoablation
The heat and free radicals generated by illumination of fluorescent molecules are able to damage nearby cellular components. Cells that are filled with fluorescent dyes may be susceptible to damage after illumination with wavelengths that excite the fluorescent molecules. This technique is easier than laser ablation, so larger numbers of animal can be generated. Unlike expression of mec-4, the time of death can be controlled by the time of illumination. Amphid sensory neurons filled with the fluorescent dye FITC are killed following a long (60-second) illumination at high power (1000×) with a mercury lamp (C. I. Bargmann, and J. H. Thomas, unpublished observations). Short or low-power illuminations do not cause as much damage. At least some of the FITC-filled neurons lose function after this treatment, as evidenced by behavioral defects; however, the behavioral defects are more severe than those observed if the same cells are killed with a laser, suggesting that the procedure damages additional cells. More defined damage can be produced by limiting fluorescent illumination to a small area using a diaphragm in the fluorescent light path. Refinement is needed to make this protocol useful. It is possible that it can also be used for cells that express the jellyfish green fluorescent protein (Chalfie et al., 1994).
Acknowledgments
We thank John Sulston and Ron Ellis for allowing us to include Figs. 2 and 4 and Fig. 3, respectively, and David Raizen, Piali Sengupta, and Scott Clark for their comments on this manuscript. This work was supported by USPHS grants DC-01393 (to C.I.B.) and HL-46154 (to L.A.). C.I.B. is a Lucille P. Markey Scholar and a Searle Scholar.
References
- Ashkin A, Dziedzic J, Yamane T. Optical trapping and manipulation of single cells using infrared laser beams. Nature. 1987;330:769–772. doi: 10.1038/330769a0. [DOI] [PubMed] [Google Scholar]
- Austin J, Kimble J. glp-1 is required in the germ line for regulation of the decision between mitosis and meiosis in C. elegans. Cell. 1987;51:589–599. doi: 10.1016/0092-8674(87)90128-0. [DOI] [PubMed] [Google Scholar]
- Avery L, Horvitz HR. A cell that dies during wild-type C. elegans development can function as a neuron in a ced-3 mutant. Cell. 1987;51:1071–1078. doi: 10.1016/0092-8674(87)90593-9. [DOI] [PMC free article] [PubMed] [Google Scholar]
- Avery L, Horvitz HR. Pharyngeal pumping continues after laser killing of the pharyngeal nervous system of C. elegans. Neuron. 1989;3:473–485. doi: 10.1016/0896-6273(89)90206-7. [DOI] [PubMed] [Google Scholar]
- Bargmann CI, Horvitz HR. Chemosensory neurons with overlapping functions direct chemotaxis to multiple chemicals in C. elegans. Neuron. 1991a;7:729–742. doi: 10.1016/0896-6273(91)90276-6. [DOI] [PubMed] [Google Scholar]
- Bargmann CI, Horvitz HR. Control of larval development by chemosensory neurons in Caenorhabditis elegans. Science. 1991b;251:1243–1246. doi: 10.1126/science.2006412. [DOI] [PubMed] [Google Scholar]
- Bargmann CI, Hartwieg E, Horvitz HR. Odorant-selective genes and neurons mediate olfaction in C. elegans. Cell. 1993;74:515–527. doi: 10.1016/0092-8674(93)80053-h. [DOI] [PubMed] [Google Scholar]
- Chalfie M, Wolinsky E. The identification and suppression of inherited neurodegeneration in Caenorhabditis elegans. Nature. 1990;345:410–416. doi: 10.1038/345410a0. [DOI] [PubMed] [Google Scholar]
- Chalfie M, Sulston JE, White JG, Southgate E, Thomson JN, Brenner S. The neural circuit for touch sensitivity in Caenorhabditis elegans. J. Neurosci. 1985;5:956–964. doi: 10.1523/JNEUROSCI.05-04-00956.1985. [DOI] [PMC free article] [PubMed] [Google Scholar]
- Chalfie M, Tu Y, Euskirchen G, Ward W, Prasher D. Green fluorescent protein as a marker for gene expression. Science. 1994;263:802–805. doi: 10.1126/science.8303295. [DOI] [PubMed] [Google Scholar]
- Chamberlin H, Sternberg P. Multiple cell interactions are required for fate specification during male spicule development in Caenorhabditis elegans. Development. 1993;118:297–324. doi: 10.1242/dev.118.2.297. [DOI] [PubMed] [Google Scholar]
- Driscoll M, Chalfie M. The mec-4 gene is a member of a family of Caenorhabditis elegans genes that can mutate to induce neuronal degeneration. Nature. 1991;349:588–593. doi: 10.1038/349588a0. [DOI] [PubMed] [Google Scholar]
- Ferguson EL, Horvitz HR. Identification and characterization of 22 genes that affect the vulval cell lineages of the nematode Caenorhabditis elegans. Genetics. 1985;110:17–72. doi: 10.1093/genetics/110.1.17. [DOI] [PMC free article] [PubMed] [Google Scholar]
- Garriga G, Desai C, Horvitz H. Cell interactions control the direction of outgrowth, branching and fasciculation of the HSN axons of Caenorhabditis elegans. Development. 1993;117:1071–1087. doi: 10.1242/dev.117.3.1071. [DOI] [PubMed] [Google Scholar]
- Hedgecock EM, Culotti JG, Thomson JN, Perkins LA. Axonal guidance mutants of Caenorhabditis elegans identified by filling sensory neurons with fluorescein dyes. Dev. Biol. 1985;111:158–170. doi: 10.1016/0012-1606(85)90443-9. [DOI] [PubMed] [Google Scholar]
- Kimble J. Alterations in cell lineage following laser ablation of cells in the somatic gonad of Caenorhabditis elegans. Dev. Biol. 1981;87:286–300. doi: 10.1016/0012-1606(81)90152-4. [DOI] [PubMed] [Google Scholar]
- Kimble J, Hirsh D. The postembryonic cell lineages of the hermaphrodite and male gonads in Caenorhabditis elegans. Dev. Biol. 1979;70:396–417. doi: 10.1016/0012-1606(79)90035-6. [DOI] [PubMed] [Google Scholar]
- Kimble JE, White JG. On the control of germ cell development in Caenorhabditis elegans. Dev. Biol. 1981;81:208–219. doi: 10.1016/0012-1606(81)90284-0. [DOI] [PubMed] [Google Scholar]
- Li C, Chalfie M. Organogenesis in C. elegans: Positioning of neurons and muscles in the egg-laying system. Neuron. 1991;4:681–695. doi: 10.1016/0896-6273(90)90195-l. [DOI] [PubMed] [Google Scholar]
- McIntire S, Jorgensen E, Kaplan J, Horvitz H. The GABAergic nervous system of Caenorhabditis elegans. Nature. 1993;364:337–341. doi: 10.1038/364337a0. [DOI] [PubMed] [Google Scholar]
- Mello C, Draper B, Krause M, Weintraub H, Priess J. The pie-1 and mex-1 genes and maternal control of blastomere identity in early C. elegans embryos. Cell. 1992;70:163–176. doi: 10.1016/0092-8674(92)90542-k. [DOI] [PubMed] [Google Scholar]
- Priess JR, Thomson JN. Cellular interactions in early C. elegans embryos. Cell. 1987;48:241–250. doi: 10.1016/0092-8674(87)90427-2. [DOI] [PubMed] [Google Scholar]
- Schnabel R. Autonomy and nonautonomy in cell fate specification of muscle in the Caenorhabditis elegans embryo: A reciprocal induction. Science. 1994;263:1449–1452. doi: 10.1126/science.8128230. [DOI] [PubMed] [Google Scholar]
- Sommer RJ, Sternberg PW. Changes of induction and competence during the evolution of vulva development in nematodes. Science. 1994;265:114–118. doi: 10.1126/science.8016644. [DOI] [PubMed] [Google Scholar]
- Sulston JE, Horvitz HR. Post-embryonic cell lineages of the nematode, Caenorhabditis elegans. Dev. Biol. 1977;56:110–156. doi: 10.1016/0012-1606(77)90158-0. [DOI] [PubMed] [Google Scholar]
- Sulston JE, White JG. Regulation and cell autonomy during postembryonic development of Caenorhabditis elegans. Dev. Biol. 1980;78:577–597. doi: 10.1016/0012-1606(80)90353-x. [DOI] [PubMed] [Google Scholar]
- Sulston JE, Albertson DG, Thomson JN. The Caenorhabditis elegans male: Postembryonic development of nongonadal structures. Dev. Biol. 1980;78:542–576. doi: 10.1016/0012-1606(80)90352-8. [DOI] [PubMed] [Google Scholar]
- Sulston JE, Schierenberg E, White JG, Thomson JN. The embryonic cell lineage of the nematode Caenorhabditis elegans. Dev. Biol. 1983;100:64–119. doi: 10.1016/0012-1606(83)90201-4. [DOI] [PubMed] [Google Scholar]
- Thomas J, Stern M, Horvitz H. Cell interactions coordinate the development of the C. elegans egg-laying system. Cell. 1990;62:1041–1052. doi: 10.1016/0092-8674(90)90382-o. [DOI] [PubMed] [Google Scholar]
- Walthall WW, Chalfie M. Cell-cell interactions in the guidance of late-developing neurons in Caenorhabditis elegans. Science. 1988;239:643–645. doi: 10.1126/science.3340848. [DOI] [PubMed] [Google Scholar]
- Waring D, Kenyon C. Selective silencing of cell communication influences anteroposterior pattern formation in C. elegans. Cell. 1990;60:123–131. doi: 10.1016/0092-8674(90)90722-q. [DOI] [PubMed] [Google Scholar]
- White J, Horvitz H. Laser microbeam techniques in biological research. Electro-Optical Systems Design AUG. 1979 [Google Scholar]


