

Abstract
The capacity for self-renewal and the multi-lineage potential of mesenchymal stromal cells (MSC) offers a therapeutic promise for regenerative medicine. MicroRNAs (miRNAs) are small non-coding RNAs that play a key regulatory role during differentiation both at the level of post-translational modulation and epigenetic control. Studies on MSCs have just begun to identify miRNA profiles in MSC and differentiated MSC. While several methods are available for miRNA exploration, microarrays and quantitative real-time PCR (qPCR) are the most common. Since there are several microarray and qPCR platforms available for miRNA detection, it is valuable to explore how these methods compare. We used the NCode Multi-Species miRNA microarray (Invitrogen) and the TaqMan Human microRNA array (Applied Biosystems) to compare microRNA expression in undifferentiated MSCs and MSCs differentiated into early osteoblasts. We show that while there is a somewhat low correlation between these two methods, there was a subset of miRNA measurements that did correlate.
Keywords: Mesenchymal stem cell, microRNA, microarray, MSC differentiation, quantitative PCR
1. Introduction
Adult mesenchymal stromal cells (MSC) are undifferentiated multi-potent cells isolated from various tissues including bone marrow, fetal tissue, peripheral blood, and adipose tissue (1–5). The capacity of MSC for self-renewal and their ability to differentiate into osteoblasts, chondrocytes, adipocytes, or fibroblasts makes these cells attractive for therapeutic transplantation. However, the multiple derivations of MSCs and their ability to generate multiple lineages will require characterizing these MSC sub-populations by their unique genetic profiles. This has been done with mRNA microarrays (6, 7) but miRNA profiles are often simpler and exhibit more drastic differences upon differentiation (8).
MicroRNAs (miRNA) are 17 to 24 nucleotide long, single-stranded, non-coding RNAs that are genome-encoded and regulate multiple cellular processes. MiRNAs can modulate gene expression by affecting transcription rate (9) mRNA stability (10), or mRNA translation into functional proteins (11). Several studies have identified populations of miRNAs that are unique to mouse embryonic stem (ES) cells (12, 13), mouse or human embryonic carcinoma cells (14), and human ES cells (13, 15, 16). Likewise, MSCs exhibit unique miRNA expression profiles (8, 17, 18). What these studies reveal is that miRNAs may be used as diagnostic tools to discriminate between cell types as well as to uncover differentiation mechanisms. As diagnostic indicators, groups or individual miRNAs regulate cardiac differentiation (13), ESC self-renewal (19), osteogenic differentiation (20), myogenesis (21, 22), neural differentiation (14, 23, 24), and cancer (25). Such groups of miRNAs as in the case of ESC self-renewal serve as regulators of cell cycle (26, 27). Also, the presence of miRNAs in stem cells and their disappearance during differentiation suggest roles in restricting cell differentiation. In MSCs, specific populations of miRNAs are regulated during osteogenic differentiation and these miRNAs have been shown to be responsive to extracellular signals (8). Thus, there is a need for further examination of miRNA expression profiles in MSC populations.
Methods used to investigate miRNA expression include microarrays, northern blotting, small RNA library sequencing, in situ hybridization, deep sequencing and quantitative real-time PCR (qPCR). The decision of which method to choose depends on the level of data one needs to extract or the number of samples to be processed. For identifying which groups of miRNAs are being expressed, microarrays are probably the most logical method, while qPCR is often used to validate those results or to screen fewer miRNAs across larger numbers of culture conditions. However, improvements to these methods have made it possible to detect the expression of multiple miRNAs by qPCR using a microfluidics-based array of qPCR reactions. The two methods outlined here use either microarrays and qPCR to investigate miRNA expression in undifferentiated and differentiated MSCs. For the microarray platform, we used the NCode Multi-Species miRNA microarray system (Invitrogen Corporation) which requires poly(A) tailing of the miRNAs followed by tagging the tail with a DNA polymer attached to fluorescence dye molecules. Although, there are disadvantages to using microarrays, such as high variability in the signal-to-noise ratio, likely due to differences in labeling and the difficulty of specifically hybridizing such short probes, there are several advantages to using the NCode platform including increased sensitivity of the labeling reaction due to the multiple Alexa Fluor® molecules present on the DNA polymer and the inclusion of positive control probes. To minimize dye bias effects, it is also recommended to perform dye-swap hybridization, a technique used in the below described protocol. An alternative to microarrays is a PCR-based approach. To demonstrate such an approach, we employed the TaqMan Human microRNA Array (Applied Biosystems). This technology requires reverse transcription of miRNAs from total RNA with up to 380 stem-loop reverse transcription primers followed by the option to pre-amplify the cDNA and PCR amplification by real-time PCR analysis. Utilizing both the NCode platform and the TaqMan platform, we demonstrate the ability to identify miRNAs present in undifferentiated and differentiated MSCs and compare the microarray-detected miRNA expression to that of qPCR-detected miRNA expression.
2. Materials
2.1 MSC cell cultures and differentiation
MSC medium: DMEM/F12 low osmolality (Invitrogen, Carlsbad, CA) supplemented with 10% FBS (HyClone, Odgen, UT), 1X GlutaMAX (Invitrogen), 1X MEM Nonessential amino acids (Invitrogen), 10 mM HEPES (Invitrogen), and 0.5 μg/ml Gentamycin (Invitrogen). MSC medium can be stored at 4°C for up to 4 weeks.
Osteoblast medium: MSC medium supplemented with 10 mM Glycerol-2-phosphate (Sigma-Aldrich, St. Louis,MO), 50 μM L-ascorbic acid-2-phosphate (Sigma-Aldrich), and 100 nM Dexamethasone (Sigma Aldrich). Osteoblast medium can be stored at 4°C for up to 4 weeks.
Trizol (Invitrogen).
NanoDrop ND-1000 Spectrophotometer (Thermo Scientific, Waltham, MA).
2.2 microRNA Microarrays
Total RNA sample containing small RNA fraction
NCode™ Multi-species miRNA microarray (Invitrogen)
Glass Coverslips or LifterSlips™ (Thermo Scientific)
Wash buffers: 2X SSC/0.2% SDS, 2X SSC, and 0.2X SSC
1 mM Tris-HCl, pH8.0
Hybex microarray incubation system (SciGene, Sunnyvale,CA) or alternative hybridization chamber
NCode™ Rapid miRNA labeling System (Invitrogen)
Microarray scanner such as the GenePix 4000B (Molecular Devices, Sunnyvale, CA)
Wash containers for submerging slide rack
Vacuum concentrator
Slide box
2.3 TaqMan® microRNA qPCR
Total RNA sample containing small RNA fraction
Megaplex™ RT primers for Human Pool A and Human Pool B (Applied Biosystems, Carlsbad, CA)
TaqMan® Human MicroRNA Array A and Array B (Applied Biosystems)
TaqMan® MicroRNA Reverse Transcription kit (Applied Biosystems)
TaqMan® Universal PCR Master mix, No AmpErase® UNG, 2X (Applied Biosystems)
7900HT Fast Real-Time PCR system with the 7900HT TaqMan® Low Density Array unit (Applied Biosystems)
3. Methods
3.1 MSC differentiation and total RNA isolation
MSCs (8) were first expanded in MSC medium on 10 cm plasma treated culture plates and replenished with fresh media every 2 days. After reaching 80% confluence, cells were passaged onto two, 6-well plates at 10,000 cells/cm2. Following a recovery period of 24 hours, three wells were harvested with 1 ml of Trizol and stored at −80°C while a second set of three wells was selected for differentiation. The medium was changed to osteoblast differentiation medium and replenished every three days. On the 7th day, osteoblasts were harvested with 1 ml of Trizol and the cell lysis was stored at −80°C.
Total RNA was isolated following the Trizol method (Invitrogen) and quantified using a NanoDrop ND-1000 Spectrophotometer (see Note 1).
3.2 NCode™ Microarray hybridization
A total of 1 μg of total RNA in a volume of no more than 9 μl is required for each experimental condition (two undifferentiated MSC samples and two differentiated MSC samples) (see Note 2 and Note 3).
Poly(A) tailing of the RNA is carried out using the NCode™ Rapid miRNA Labeling System. Prepare the ATP dilution with 1 mM Tris-HCl, pH 8.0 for using total RNA according to manufacturer’s recommendations prior to beginning the poly(A) tailing procedure but do not add it to the total RNA until the procedure calls for the diluted ATP.
Dilute the NCode™ multi-species miRNA microarray control according to the manufacturer’s recommendations. Add 1 μl of the diluted NCode™ multi-species miRNA microarray control to each of the four total RNA samples and bring up the volume to 10 μl.
Add the 10X miRNA reaction buffer, 25 mM MnCl2, diluted ATP, and poly(A) polymerase to the 10 μl RNA as indicated in the manufacturer’s protocol.
Mix, centrifuge, and incubate the four reactions at 37°C for 15 minutes (see Note 4).
Briefly centrifuge the 15 μl of poly(A) tailed RNA and add 4 μl of the ligation fluorescent mix to the corresponding RNA (see Note 5).
Add 2 μl of T4 DNA ligase to the reaction.
Mix and briefly centrifuge the reaction (see Note 6).
Incubate the reactions for 30 minutes at room temperature under low-light conditions (see Note 7).
Add 2.5 μl of Stop solution to each reaction. Mix and briefly centrifuge the reactions.
Combine the appropriate control sample (labeled with the first fluorescent dye) with its corresponding test sample (labeled with the second fluorescent dye) to yield two ligation reactions with a total volume of 47 μl each.
Concentrate the two reactions with a vacuum concentrator to half the volume (~23.5 μl) (see Note 8).
Add 5 μl of 10% BSA to each concentrated ligation reaction.
Add 28.5 μl of 2X pre-warmed hybridization buffer (see Note 9).
Incubate this hybridization mix for 10 minutes at 65°C (see Note 10). Protect the reactions from light.
Add 57 μl of the hybridization mix to the array, cover with a glass coverslip, and hybridize overnight at 53°C in a dark, humidified chamber (see Note 11 and Note 12).
Warm up 2X SSC/0.2% SDS wash buffer to 52°C.
Remove the coverslip by immersing the slide in pre-warmed 2X SSC/0.2% SDS for 2 min or until the coverslip floats off (see Note 13).
Wash slide in pre-warmed 2XSSC/0.2%SDS at 52°C for 15 min.
Wash slide in 2X SSC for 15 min at room temperature.
Wash slide in 0.2X SSC for 15 min at room temperature.
Quickly transfer the slide to a centrifuge and spin at 1100 rpm for 3 min (see Note 14).
Scan and analyze the array on a microarray scanner (see Note 15).
3.3 TaqMan® qPCR
Set up two 0.2 ml tubes with undifferentiated MSC total RNA and two 0.2 ml tubes with differentiated MSC total RNA. Each tube should contain 3 μl of total RNA (350 ng to 1000 ng).
Set up one RT master mix with Megaplex™ RT Primers Pool A, enough for two samples and one RT master mix with Megaplex™ RT Primers Pool B for two samples according to manufacturer’s protocol (see Note 16).
Add 4.5 μl of the appropriate RT Master Mix to each 3 μl of total RNA.
Mix and briefly centrifuge contents.
Incubate each reaction on ice for 5 min.
Perform reverse transcription by setting up a thermal cycling run according to the manufacturer’s protocol.
If necessary, thaw the Megaplex™ RT product on ice. Add 444 μl of nuclease-free water to each RT product. Mix and briefly centrifuge each reaction.
Prior to setting up the PCR reactions, mix the 2X TaqMan® Universal PCR Master Mix, No AmpErase® UNG. To each Megaplex™ RT product, add 450 μl of the Universal PCR Master Mix, mix and briefly centrifuge.
Allow each TaqMan® MicroRNA array to reach room temperature (two of Array A and two of Array B). Aliquot 100 μl of RT product into each fill reservoir of the array. Repeat this step for the remaining three arrays.
Centrifuge the arrays to distribute the RT product into the reaction wells of the array according to the manufacturer’s instructions.
Seal the array according to the manufacturer’s instructions and trim the fill reservoirs from the array.
Load and run each array using the relative quantification mode and the 384 well TaqMan® Low Density Array thermal cycling conditions (see Note 17).
Figure 1. Correlation of NCode™ miRNA microarray and TaqMan® miRNA array measurements for the 70 miRNAs detected by both assays is dependent on expression level.
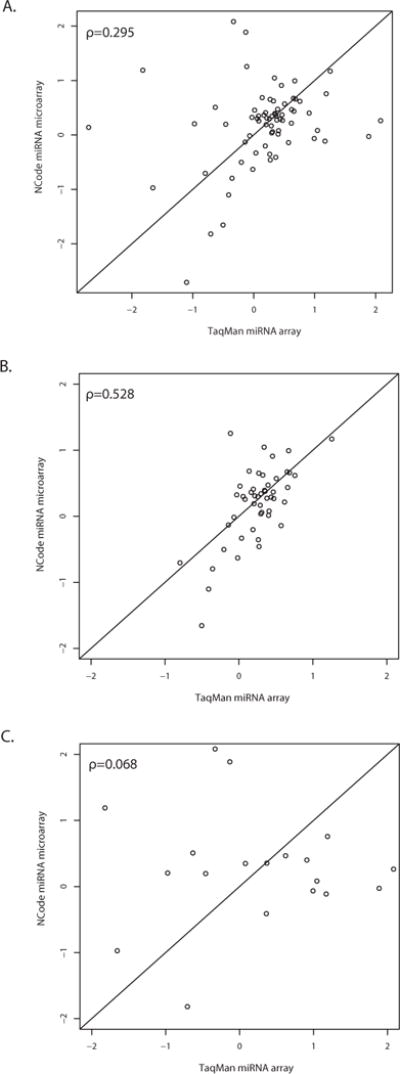
Out of 454 miRNA probes present on the NCode arrays, 93 miRNA measurements showed a positive mean intensity above background. Results are plotted as the log2 fold change between MSC and nascent osteoblasts. Out of these 93 miRNAs, 70 were present in both the NCode and TaqMan arrays. (A) Comparison between the two miRNA platforms using all 70 probes indicated poor correlation between the two methods (Spearman’s rho=0.295). (B) However, using only the qPCR results filtered for a higher level of expression (a Ct or cycle threshold value of less than 30) produced increased correlation (Spearman’s rho=0.528). (C) In contrast, when qPCR results were filtered for low levels of expression (Ct value of 30 or more cycles), there was less of an association between the two methods (Spearman’s rho=0.068). Results indicate that fold-change measurements are somewhat similar between the two methods at higher levels of expression but that the methods disagree at lower expression levels. This is likely due to the greater sensitivity of qPCR.
Acknowledgments
Supported by grants from the New Jersey Commission on Science & Technology (Stem Cell Program), NIH 5R21 NS054028, and Invitrogen, Inc. CC was supported by a fellowship from the New Jersey Commission on Spinal Cord Research.
Footnotes
If RNA yield is of concern (≤ 100 ng), RNA may be precipitated by adding Linear Acrylamide (Applied Biosystems, Carlsbad, CA) to a final concentration of 10 μg/μl prior to ethanol precipitation. A ratio of the absorbance at 260 and 280 (A260/A280) and a ratio of the absorbance at 260 and 230 (A260/A230) need to be ≥ 2.0 when measured at pH 8.0. If either ratio is less than 1.8, additional cleanup steps are required to remove any contaminants that remain from the RNA isolation. To determine the integrity of total RNA, the samples may be analyzed by gel electrophoresis or on the 2100 Bioanalyzer (Agilent Technologies, Santa Clara, CA). If the Bioanalyzer is used, a RNA Integrity Number (RIN) of ≥ 8.0 is recommended.
Since environmental ozone levels can have an effect on fluorescence intensity, ensure ozone levels are as low as 2 ppb prior to beginning hybridization unless the microarray laboratory has been installed with an adequate air filtering system (28, 29). A dye-flip experiment is performed to minimize any dye-effects. Thus, two arrays and four samples (two control samples and two test samples) are required for each hybridization reaction. For experiments with additional replicates, linear modeling may be performed (30).
If the total RNA is too dilute, the RNA may be concentrated using a vacuum concentrator. However, be careful not to over-dry the RNA or it will not dissolve properly.
While the poly(A) tailing reaction is incubating, store all poly(A) tailing components and begin to thaw the materials required for ligation. Perform the ligation reaction under low light conditions.
One group of samples, a control (undifferentiated MSC) and a test sample (differentiated MSC), is labeled with one fluorescent dye. The second group of samples is labeled with the second fluorescent dye.
The NCode™ dye normalization control is not necessary since a dye-flip experiment is being conducted.
Inspect the slide to ensure it is free of dust or lint particles. If necessary, gently clean the slide with a stream of air.
Pre-heat the 2X hybridization buffer at 53°C until the buffer is completely dissolved.
The 2X hybridization buffer is viscous so pipette it slowly.
Maintain the ligation reactions at 65°C until ready to load the reactions onto the array slides.
To load a slide there are two options, one option is to place the glass coverslip on the array and then align the pipette tip at the center of the glass coverslip and slowly pipette the liquid by allowing it to flow throughout the slide. The second option is to apply the hybridization mix first and then gently lower the coverslip onto the slide.
If using the Hybex microarray incubation system (SciGene) only one chamber (which fits 4 slides) is required. Unscrew the lid of the microarray incubation chamber from its base, soak the filter paper within the chamber with 1ml of water, allow the water to soak throughout the filter paper and remove any excess water from the chamber. After loading the slide, close the chamber tightly. Load the chambers into the incubation system according to the manufacturer’s recommendations.
If the slide dried during hybridization it will take longer than 2 min for the coverslip to float off. Do not allow the slides to dry in between the wash steps.
The slide may be dried in a 50 ml centrifuge tube by orienting the slide so that any label is at the bottom of the tube. If a swinging bucket centrifuge is available, orient the slides so that they are parallel to the swinging bucket. The slide may be stored in a slide box until ready to analyze the array.
Set PMT settings accordingly to control spots available on the array and then proceed with gridding of the array.
One sample of undifferentiated MSC and one sample of differentiated MSC are labeled with Megaplex™ RT Primers Pool A. The second sample of undifferentiated MSC and sample of differentiated MSC are labeled with Megaplex™ RT Primers Pool B.
To analyze the data, load the SDS files for the samples labeled with the Megaplex™ RT primers Pool A into the SDS RQ manager software provided by Applied Biosystems. In the analysis settings, set the detector settings to a manual Ct and a threshold of 0.2 and select an automatic baseline. Also select the mammalian U6 probe as the endogenous control detector and the control sample (undifferentiated MSC) as the calibrator. Analyze all probes and export data. Repeat these steps for Pool B.
References
- 1.Wagner W, Wein F, Seckinger A, Frankhauser M, Wirkner U, Krause U, Blake J, Schwager C, Eckstein V, Ansorge W, Ho AD. Comparative characteristics of mesenchymal stem cells from human bone marrow, adipose tissue, and umbilical cord blood. Exp Hematol. 2005;33:1402–1416. doi: 10.1016/j.exphem.2005.07.003. [DOI] [PubMed] [Google Scholar]
- 2.Mansilla E, Marin GH, Drago H, Sturla F, Salas E, Gardiner C, Bossi S, Lamonega R, Guzman A, Nunez A, Gil MA, Piccinelli G, Ibar R, Soratti C. Bloodstream cells phenotypically identical to human mesenchymal bone marrow stem cells circulate in large amounts under the influence of acute large skin damage: new evidence for their use in regenerative medicine. Transplant Proc. 2006;38:967–969. doi: 10.1016/j.transproceed.2006.02.053. [DOI] [PubMed] [Google Scholar]
- 3.Igura K, Zhang X, Takahashi K, Mitsuru A, Yamaguchi S, Takashi TA. Isolation and characterization of mesenchymal progenitor cells from chorionic villi of human placenta. Cytotherapy. 2004;6:543–553. doi: 10.1080/14653240410005366-1. [DOI] [PubMed] [Google Scholar]
- 4.In ’t Anker PS, Scherjon SA, Kleijburg-van der Keur C, Noort WA, Claas FH, Willemze R, Fibbe WE, Kanhai HH. Amniotic fluid as a novel source of mesenchymal stem cells for therapeutic transplantation. Blood. 2003;102:1548–1549. doi: 10.1182/blood-2003-04-1291. [DOI] [PubMed] [Google Scholar]
- 5.in ’t Anker PS, Noort WA, Scherjon SA, Kleijburg-van der Keur C, Kruisselbrink AB, van Bezooijen RL, Beekhuizen W, Willemze R, Kanhai HH, Fibbe WE. Mesenchymal stem cells in human second-trimester bone marrow, liver, lung, and spleen exhibit a similar immunophenotype but a heterogeneous multilineage differentiation potential. Haematologica. 2003;88:845–852. [PubMed] [Google Scholar]
- 6.Ng F, Boucher S, Koh S, Sastry KS, Chase L, Lakshmipathy U, Choong C, Yang Z, Vemuri M, Rao MS, Tanavde V. PDGF, TGF-b and FGF signaling is important for differentiation and growth of mesenchymal stem cells (MSCs): transcriptional profiling can identify markers and signaling pathways important in differentiation of MSC into adipogenic, chondrogenic and ostoegenic lineages. Blood. 2008 doi: 10.1182/blood-2007-07-103697. [DOI] [PubMed] [Google Scholar]
- 7.Kulterer B, Friedl G, Jandrositz A, Sanchez-Cabo F, Prokesch A, Paar C, Scheideler M, Windhager R, Preisegger KH, Trajanoski Z. Gene expression profiling of human mesenchymal stem cells derived from bone marrow during expansion and osteoblast differentiation. BMC Genomics. 2007;8:70. doi: 10.1186/1471-2164-8-70. [DOI] [PMC free article] [PubMed] [Google Scholar]
- 8.Goff LA, Boucher S, Ricupero CL, Fenstermacher S, Swerdel M, Chase LG, Adams CC, Chesnut J, Lakshmipathy U, Hart RP. Differentiating human multipotent mesenchymal stromal cells regulate microRNAs: prediction of microRNA regulation by PDGF during osteogenesis. Experimental hematology. 2008;36:1354–1369. doi: 10.1016/j.exphem.2008.05.004. [DOI] [PMC free article] [PubMed] [Google Scholar]
- 9.Kuwabara T, Hsieh J, Nakashima K, Taira K, Gage FH. A small modulatory dsRNA specifies the fate of adult neural stem cells. Cell. 2004;116:779–793. doi: 10.1016/s0092-8674(04)00248-x. [DOI] [PubMed] [Google Scholar]
- 10.Zhou L, Qi X, Potashkin JA, Abdul-Karim FW, Gorodeski GI. MicroRNAs miR-186 and miR-150 down-regulate expression of the pro-apoptotic purinergic P2X7 receptor by activation of instability sites at the 3′-untranslated region of the gene that decrease steady-state levels of the transcript. J Biol Chem. 2008;283:28274–28286. doi: 10.1074/jbc.M802663200. [DOI] [PMC free article] [PubMed] [Google Scholar]
- 11.Filipowicz W, Bhattacharyya SN, Sonenberg N. Mechanisms of post-transcriptional regulation by microRNAs: are the answers in sight? Nat Rev Genet. 2008;9:102–114. doi: 10.1038/nrg2290. [DOI] [PubMed] [Google Scholar]
- 12.Houbaviy HB, Murray MF, Sharp PA. Embryonic stem cell-specific MicroRNAs. Dev Cell. 2003;5:351. doi: 10.1016/s1534-5807(03)00227-2. [DOI] [PubMed] [Google Scholar]
- 13.Ivey KN, Muth A, Arnold J, King FW, Yeh RF, Fish JE, Hsiao EC, Schwartz RJ, Conklin BR, Bernstein HS, Srivastava D. MicroRNA regulation of cell lineages in mouse and human embryonic stem cells. Cell Stem Cell. 2008;2:219–229. doi: 10.1016/j.stem.2008.01.016. [DOI] [PMC free article] [PubMed] [Google Scholar]
- 14.Sempere LF, Freemantle S, Pitha-Rowe I, Moss E, Dmitrovsky E, Ambros V. Expression profiling of mammalian microRNAs uncovers a subset of brain-expressed microRNAs with possible roles in murine and human neuronal differentiation. Genome Biol. 2004;5:R13. doi: 10.1186/gb-2004-5-3-r13. [DOI] [PMC free article] [PubMed] [Google Scholar]
- 15.Suh MR, Lee Y, Kim JY, Kim SK, Moon SH, Lee JY, Cha KY, Chung HM, Yoon HS, Moon SY, Kim VN, Kim KS. Human embryonic stem cells express a unique set of microRNAs. Dev Biol. 2004;270:488. doi: 10.1016/j.ydbio.2004.02.019. [DOI] [PubMed] [Google Scholar]
- 16.Lakshmipathy U, Love B, Goff LA, Jornsten R, Graichen R, Hart RP, Chesnut JD. MicroRNA expression pattern of undifferentiated and differentiated human embryonic stem cells. Stem Cells Dev. 2007;16:1003–1016. doi: 10.1089/scd.2007.0026. [DOI] [PMC free article] [PubMed] [Google Scholar]
- 17.Greco SJ, Rameshwar P. MicroRNAs regulate synthesis of the neurotransmitter substance P in human mesenchymal stem cell-derived neuronal cells. Proc Natl Acad Sci U S A. 2007;104:15484–15489. doi: 10.1073/pnas.0703037104. [DOI] [PMC free article] [PubMed] [Google Scholar]
- 18.Bae S, Ahn JH, Park CW, Son HK, Kim KS, Lim NK, Jeon CJ, Kim H. Gene and microRNA expression signatures of human mesenchymal stromal cells in comparison to fibroblasts. Cell Tissue Res. 2009;335:565–573. doi: 10.1007/s00441-008-0729-y. [DOI] [PubMed] [Google Scholar]
- 19.Xu N, Papagiannakopoulos T, Pan G, Thomson JA, Kosik KS. MicroRNA-145 Regulates OCT4, SOX2, and KLF4 and Represses Pluripotency in Human Embryonic Stem Cells. Cell. 2009;137:647–658. doi: 10.1016/j.cell.2009.02.038. [DOI] [PubMed] [Google Scholar]
- 20.Kim YJ, Bae SW, Yu SS, Bae YC, Jung JS. miR-196a regulates proliferation and osteogenic differentiation in mesenchymal stem cells derived from human adipose tissue. J Bone Miner Res. 2009;24:816–825. doi: 10.1359/jbmr.081230. [DOI] [PubMed] [Google Scholar]
- 21.Rao PK, Kumar RM, Farkhondeh M, Baskerville S, Lodish HF. Myogenic factors that regulate expression of muscle-specific microRNAs. Proc Natl Acad Sci U S A. 2006;103:8721–8726. doi: 10.1073/pnas.0602831103. [DOI] [PMC free article] [PubMed] [Google Scholar]
- 22.Kim HK, Lee YS, Sivaprasad U, Malhotra A, Dutta A. Muscle-specific microRNA miR-206 promotes muscle differentiation. J Cell Biol. 2006;174:677–687. doi: 10.1083/jcb.200603008. [DOI] [PMC free article] [PubMed] [Google Scholar]
- 23.Schratt GM, Tuebing F, Nigh EA, Kane CG, Sabatini ME, Kiebler M, Greenberg ME. A brain-specific microRNA regulates dendritic spine development. Nature. 2006;439:283–289. doi: 10.1038/nature04367. [DOI] [PubMed] [Google Scholar]
- 24.Krichevsky AM, Sonntag KC, Isacson O, Kosik KS. Specific MicroRNAs Modulate Embryonic Stem Cell-Derived Neurogenesis. Stem Cells. 2006;24:857–864. doi: 10.1634/stemcells.2005-0441. [DOI] [PMC free article] [PubMed] [Google Scholar]
- 25.Calin GA, Croce CM. MicroRNA signatures in human cancers. Nat Rev Cancer. 2006;6:857–866. doi: 10.1038/nrc1997. [DOI] [PubMed] [Google Scholar]
- 26.Greer Card DA, Hebbar PB, Li L, Trotter KW, Komatsu Y, Mishina Y, Archer TK. Oct4/Sox2-Regulated miR-302 Targets Cyclin D1 in Human Embryonic Stem Cells. Mol Cell Biol. 2008;28:6426–6438. doi: 10.1128/MCB.00359-08. [DOI] [PMC free article] [PubMed] [Google Scholar]
- 27.Wang Y, Baskerville S, Shenoy A, Babiarz JE, Baehner L, Blelloch R. Embryonic stem cell-specific microRNAs regulate the G1-S transition and promote rapid proliferation. Nat Genet. 2008;40:1478–1483. doi: 10.1038/ng.250. [DOI] [PMC free article] [PubMed] [Google Scholar]
- 28.Branham W, Melvin C, Han T, Desai V, Moland C, Scully A, Fuscoe J. Elimination of laboratory ozone leads to a dramatic improvement in the reproducibility of microarray gene expression measurements. BMC Biotechnology. 2007;7:8. doi: 10.1186/1472-6750-7-8. [DOI] [PMC free article] [PubMed] [Google Scholar]
- 29.Fare TL, Coffey EM, Dai H, He YD, Kessler DA, Kilian KA, Koch JE, LeProust E, Marton MJ, Meyer MR, Stoughton RB, Tokiwa GY, Wang Y. Effects of atmospheric ozone on microarray data quality. Anal Chem. 2003;75:4672–4675. doi: 10.1021/ac034241b. [DOI] [PubMed] [Google Scholar]
- 30.Goff LA, Lakshmipathy U, Hart RP. The analysis of microRNAs in stem cells. In: Shi Y, editor. Stem Cell Research and Therapeutics. Springer; Netherlands: 2008. pp. 141–167. [Google Scholar]