

Abstract
Background
Ethanol can induce cytochrome P450 2E1, an active generator of reactive oxygen species, and this cytochrome is considered a risk factor for oxidative liver injury. Recently, we found that in addition to P450 2E1 also cytochrome P450 2A5, another isoform of cytochrome P450, can be induced by ethanol, and that ethanol induction of cytochrome P450 2A5 is P450 2E1-dependent.
Aims
To investigate the role of cytochrome P450 2A5 in alcohol-induced liver injury.
Methods
Cytochrome P450 2A5-knockout mice and wild type mice were fed the Lieber-Decarli ethanol liquid diet to induce liver injury. Controls were fed the Lieber-Decarli control diet.
Results
After 4 weeks of feeding with Lieber-Decarli diet, ethanol-induced liver injury was enhanced in the knockout mice compared with wild type mice, as indicated by serum transaminases, hepatic fat accumulation (steatosis), and necroinflammation observed in liver sections with Haematoxylin & Eosin staining. Ethanol-induced oxidative stress was also higher in the knockout mice than the wild types. Ethanol feeding induced cytochrome P450 2A5 in wild type mice but not in the knockout mice, while induction of cytochrome P450 2E1 was comparable in the knockout and wild type mice.
Conclusion
These results suggest that cytochrome P450 2A5 protects against ethanol-induced oxidative liver injury.
Keywords: cytochrome P450 2E1, cytochrome P450 2A5, oxidative stress, liver, ethanol
INTRODUCTION
The cytochrome P450 2A (CYP2A) subfamily includes 2A3 in rats, CYP2A5 in mice, and CYP2A6 in humans (1). Coumarin, a plant alkaloid, is hydroxylated specifically by coumarin 7-hydroxylase (COH), encoded by the mouse cyp2a5 gene and the human cyp2a6 gene (2, 3). COH activity is considered as a specific marker for the catalytic function of mouse CYP2A5 and human CYP2A6. In humans, CYP2A6, a major metabolic enzyme for nicotine and procarcinogenic nitrosamines present in tobacco smoke, is predominantly expressed in the liver (4). In mice, CYP2A5, which shares 86 % amino acid sequence similarity with the human CYP2A6 (5), is also expressed in liver, but the highest CYP2A5 expression is detected in olfactory mucosa (1). In rats, CYP2A3, which is orthologous to mouse CYP2A5 and human CYP2A6, is expressed at high levels in the olfactory mucosa but is not detectable in liver (1). In mouse liver, COH activity can be strongly induced by pyrazole, while in rat liver COH is not detectable even after treatments with pyrazole (6). CYP2A5 expression or its catalytic activity (COH) is highly inducible in mouse liver by diverse hepatotoxic chemicals that are neither structurally similar nor generally considered to be CYP inducers (1). However, the relationship between CYP2A5 induction and liver injury is still unclear.
CYP2A6 expression was induced by ethanol in human monocytes (7) and, consistently, CYP2A6 up-regulation was observed in livers of alcoholic patients (8). Recently, we found that CYP2A5 expression, along with cyp2a5 mRNA and COH activity, was induced by ethanol feeding in mice and, very interestingly, that ethanol induction of CYP2A5 was CYP2E1-dependent (9). It has long been known that alcohol consumption induces CYP2E1, and CYP2E1 plays an important role in ethanol-induced oxidative liver injury (10, 11). It is possible that CYP2A5 may act as a downstream molecule of the CYP2E1 signalling pathway to promote alcohol-induced liver injury. On the other hand, ethanol induction of CYP2A5 is also regulated by the redox-sensitive transcriptional factor, nuclear factor-erythroid 2-related factor 2 (Nrf2) (12). Nrf2 signalling usually protects against oxidative injury by regulating a panel of antioxidant genes (13). Indeed, Nrf2 protects against alcohol-induced liver injury in mice (14). However, one of the remaining questions is: does Nrf2-regulated CYP2A5 act as an antioxidant to protect against alcoholic liver injury? In this study, we investigated the role of CYP2A5 in ethanol-induced liver injury.
MATERIALS AND METHODS
Animals and Treatments
The C57BL/J6 background CYP2A5 knockout (cyp2a5−/−) mouse colony was established at Mount Sinai by re-derivation from male cyp2a5−/− mice (15) (kindly provided by Dr. Xinxin Ding, Wadsworth Centre, New York State Department of Health, Albany, NY) and female C57BL/J6 WT mice (purchased from Charles River Laboratory). Peroxisome proliferator-activated receptor-α knockout (pparα−/−) mice were purchased from Jackson Lab. The mice were sacrificed after a 6-hour fast. All mice were housed in temperature-controlled animal facilities with 12-hour light/12-hour dark cycles and were permitted consumption of tap water and Purina standard chow ad libitum until being fed the liquid diets. The mice received humane care and experiments were approved by the Mount Sinai Animal Care and Use Committee. To induce alcoholic liver injury, 14 cyp2a5−/− mice and 14 cyp2a5+/+ (WT) mice, as well as 10 pparα−/− mice and 10 pparα+/+ (WT) mice, were initially fed the control liquid dextrose diet (Bio-Serv, Frenchtown, NJ) for 3 days to acclimate them to the liquid diet. Afterward, half of the mice from each group were fed the liquid ethanol diet (Bio-Serv, Frenchtown, NJ) and the other half from each group were pair-fed the control dextrose diet on an isoenergetic basis, as described by Lieber and DeCarli (16). The content of ethanol was gradually increased every 3–4 days from 10% of total calories (1.77% [vol/vol]) to 20% (3.54% [vol/vol]), 25% (4.42% [vol/vol]), to 30% (5.31% [vol/vol]), and finally 35% of total calories (6.2% [vol/vol]). The ethanol-fed mice had access to their rations ad libitum, and the conditions of the mice in each group were comparable. The amount of food consumed by the mice from each group was approximately the same. After ethanol feeding (4 weeks for cyp2a5−/− and cyp2a5+/+ mice, and 3 weeks for pparα+/+ and pparα−/− mice), all mice were sacrificed by cervical dislocation after blood collection via the retro-orbital venous sinus under anaesthesia by inhalation of isoflurane. Serum activity of alanine aminotransferase (ALT), aspartate aminotransferase (AST), and alkaline phosphatase (ALP), as well as serum levels of triglyceride (TG), glucose, total bilirubin, and alcohol were measured using kits (Pointe Scientific, Canton, MI). The livers were rapidly excised into fragments and washed with cold saline. One piece of liver tissue was put in neutral Formalin solution for paraffin bedding. The remaining liver tissue aliquots were stored at −80°C for further assays. Liver homogenates were prepared in ice-cold 0.15 M potassium chloride (KCl), and liver TG content was measured using a kit (Pointe Scientific, Canton, MI).
Liver Histology and Immunohistochemistry
Liver sections were stained with haematoxylin and eosin (H&E) for pathological evaluation, as described before (17). Ethanol-induced steatosis was quantified as the percentage of cells containing fatty droplets; five fields (200×) per liver section were examined (one 200× field area contains about 200 cells). Steatosis scoring was recorded as follows: 0, none; 1, <5%; 2, 5–33%; 3, 34–66%; and 4, >67%. Ethanol-induced necroinflammation was quantified as the number of clusters of 5 or more inflammatory cells per mm2; for this, five 200× fields per liver were examined (one 200× field area = 0.95 mm2). Necrosis scoring was recorded as follows: 0, none; 1, <2 foci per mm2; 2, 2–4 foci per mm2; 3, 5–10 foci per mm2; and 4, >10 foci per mm2. The pathologists were unaware of the treatment groups when evaluating the slides. Immunohistochemical staining (IHC) for 4-hydroxyl-nonenal (4-HNE), 3-nitro-tyrosine (3-NT), collagen I, and alpha smooth muscle actin (α-SMA) was performed by using anti-4-HNE, anti-3-NT, anti-collagen I, and anti-α-SMA antibodies (Millipore), followed by the use of a Broad Spectrum (AEC) Histostain-Plus kit (Invitrogen). No staining was observed in the absence of the primary antibody.
Preparation of hepatic microsomes
The liver homogenate was centrifuged at 9,000 × g for 20 min, and the resulting supernatant fraction was further centrifuged at 105,000 × g for 60 min. The resulting pellets (microsomes) were resuspended in 0.15 M KCl solution. All procedures were carried out under cold conditions (9,12,18).
Cytochrome P450 2E1 and 2A5 activity
CYP2E1 activity was measured by the rate of oxidation of 1 mM p-nitrophenol (18), while CYP2A5 activity was measured by assessing COH activity with 100 μM coumarin as substrate (9, 12). The reaction systems were incubated with 100 μg of microsomal protein for 15 min at 37 °C.
Measurement of reduced glutathione (GSH) levels
Liver homogenate was mixed with trichloroacetic acid (TCA) to a final concentration of 5% TCA, and the mixture was incubated at 4°C for 30 min to extract GSH. The TCA extracts (10 μl) were added to 200 μl of methanol containing 1 mg/ml o-phthalaldehyde and were then incubated for 15 min at 37°C in the dark (18). Fluorescence was measured at 350/420 nm (excitation/emission). The concentration of GSH was determined from a GSH standard curve.
Determination of Thiobarbituric Acid Reactive Substances (TBARS)
In brief, hepatic homogenates were incubated with 0.2 ml of TCA solution [15% (wt/vol)]-thiobarbituric acid (TBA) [0.375% (wt/vol)]-hydrogen chloride (HCl) (0.25 N) in a boiling water bath for 10 min. After centrifugation at 1,000 rpm for 5 min, the resulting supernatant was used to determine the formation of TBARS by evaluating absorbance at 535 nm. Malondialdehyde (MDA) was treated as above and served as a standard (19).
Western Blotting
Hepatic proteins were separated by 10% SDS-PAGE and transferred to nitrocellulose membranes. After 1 h of blocking with 2% fat-free milk, membranes were incubated overnight with antibodies against CYP2E1, CYP2A5, acyl-CoA oxidase (AOX), alcohol dehydrogenase (ADH), PPARα, fatty acid synthase (FAS), Carnitine palmitoyltransferase I (CPT I), phosphorylated AMP-activated protein kinase (p-AMPK), total AMPK (T-AMPK), and calnexin or β-actin followed by 1 h incubation with peroxidase secondary anti-rabbit, anti-chicken, and anti-goat antibodies (Millipore). Calnexin or β-actin were detected as protein loading control. Anti-CYP2E1 IgG was gifted by Dr. Jerome Lasker, Hackensack Biomedical Research Institute, Hackensack, NJ; anti-CYP2A5 IgG was gifted by Dr. Risto Juvonen, Department of Pharmacology and Toxicology, University of Kuopio, Kuopio, Finland; anti-AOX was gifted by Professor Paul Van Veldhoven, K.U. Leuven, Belgium; finally, anti-p-AMPK and anti-T-AMPK were purchased from Cell Signalling Technology, and the remaining antibodies were from Santa Cruz Biotechnology, CA. Chemiluminescence was detected by Image Reader LAS-4000 (Fijifilm) after adding Pierce EC Western Blotting Substrate (Thermo Scientific). The bands of proteins were quantified with the Automated Digitizing System (ImageJ gel programs, version 1.34S; National Institutes of Health, Bethesda, MD).
Statistics
Results are expressed as means ± SEMs. Statistical evaluation was carried out by using one-way analysis of variance with subsequent Student-Newman-Keuls post hoc test. A p<0.05 was considered as indicative of statistical significance.
RESULTS
Serum alcohol levels after chronic ethanol feeding in cyp2a5−/− mice
Before examining liver injury induced by chronic alcohol feeding, serum levels of alcohol were detected. After 4 weeks of ethanol feeding, serum levels of alcohol in cyp2a5−/− mice were similar to those in cyp2a5+/+ mice (Fig 1A). Consistently, expression of ADH and CYP2E1, two major alcohol metabolizing enzymes, was comparable in cyp2a5−/− and cyp2a5+/+ mice after ethanol feeding (Fig 1B and C). As expected, expression of CYP2A5 was induced in cyp2a5+/+ mice but not in cyp2a5−/− mice (Fig 1B); however, CYP2A5 has a minor role in ethanol metabolism compared with CYP2E1 (12). These results indicate that serum alcohol levels and hepatic expression of CYP2E1 are comparable in the cyp2a5−/− and cyp2a5+/+ mice. Thus, CYP2E1, a risk factor for alcoholic liver disease, won’t be a confounding factor in this model.
Figure 1.

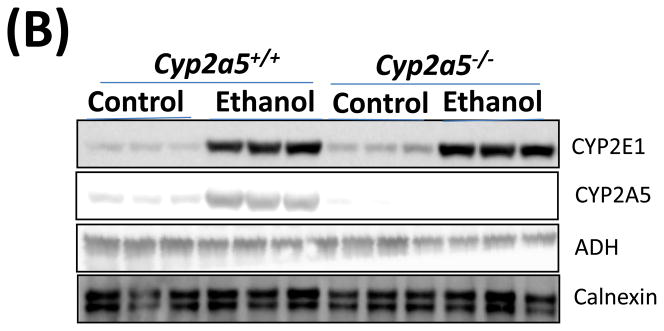

Serum alcohol levels and liver major alcohol metabolic enzyme CYP2E1 levels are comparable in cytochrome P450 2A5 knockout and wild type mice. (A) Serum alcohol concentrations. (B) Western blotting analyses for CYP2E1, CYP2A5 and alcohol dehydrogenase in cyp2a5+/+ and cyp2a5−/− mice. (C) Western blotting quantification. * P<0.05, compared with Control group; # P<0.05, compared with cyp2a5+/+ Ethanol group. ADH, alcohol dehydrogenase; cyp2a5−/− mice, cytochrome P450 2A5 knockout mice; cyp2a5+/+ mice, cytochrome P450 2A5 wild type mice.
Liver injury induced by chronic ethanol feeding in cyp2a5−/− mice
Alcohol may induce hepatic necrosis, and the subsequent inflammatory cell infiltration in the liver may form foci of necroinflammation (17). After 4 weeks of ethanol feeding, necrotic foci with clusters of inflammatory cells were observed to a greater extent in liver sections from cyp2a5−/− mice than from cyp2a5+/+ mice (Fig 2A right panels and B black bars). Although the serum levels of total bilirubin and serum activity of ALP were not changed after ethanol feeding in either cyp2a5−/− or cyp2a5+/+ mice (data not shown), the serum levels of ALT and AST, markers of liver injury, were elevated in cyp2a5−/− mice to a greater extent than in cyp2a5+/+ mice (Fig 2C). The ratio of liver to body weight was increased by ethanol feeding, but there was no difference between cyp2a5−/− mice and cyp2a5+/+ mice (Fig 2D). Collagen I and α-SMA were detected by IHC. Although expression of collagen I was induced by ethanol feeding, collagen was mainly located in the sinusoid space and no evident fibrosis was observed (Fig. 2E middle panels). Also, we did not observe positive staining for α-SMA in the liver sections except for blood vessel walls (Fig. 2E right panels).
Figure 2.


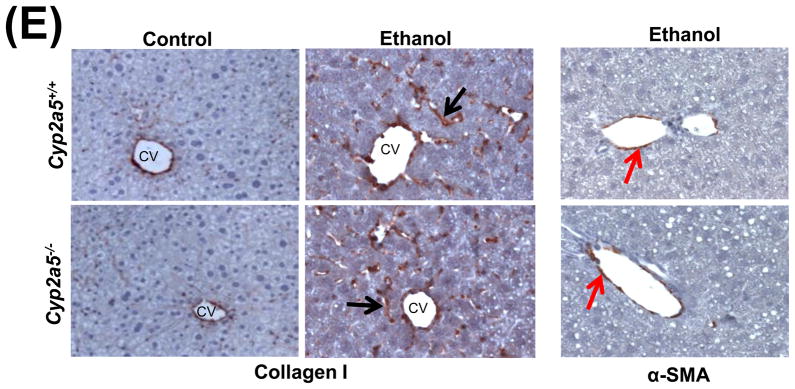
Liver injury and steatosis after ethanol feeding are more severe in cytochrome P450 2A5 knockout and wild type mice. (A) Haematoxylin & eosin staining. Black arrows show lipid droplets and white arrows show necroinflammatory foci. (B) necroinflammation and steatosis quantification; (C) Serum alanine aminotransfrerase and aspartate aminotransferase levels; (D) Ratio of Liver/body weight. * P<0.05, compared with Control group; # P<0.05, compared with cyp2a5+/+ Ethanol group. (E) Immunohistochemistry staining for collagen I and α-smooth muscle actin. Black arrows show collagen I and red arrows for α-smooth muscle actin. PV, portal vein; CV, central vein. ALT, alanine aminotransfrerase; AST, aspartate aminotransferase; α-SMA, α-smooth muscle actin; cyp2a5−/− mice, cytochrome P450 2A5 knockout mice; cyp2a5+/+ mice, cytochrome P450 2A5 wild type mice.
As shown in Fig 2A, alcohol consumption caused the formation of lipid droplets, which were mainly distributed around the central vein in cyp2a5+/+ mice, while in cyp2a5−/− mice were also observed around portal veins except for the central veins; the size of the lipid droplets was smaller in cyp2a5+/+ mice than cyp2a5−/− mice. Also, we found more hepatocytes containing lipid droplets in cyp2a5−/− mice than cyp2a5+/+ mice (Fig. 2B white bars). Likewise, TG levels in liver and serum were increased in cyp2a5−/− mice to a greater extent than in cyp2a5+/+ mice (Fig 3A and B white bars). In addition, serum glucose was increased in cyp2a5−/− mice but not in cyp2a5+/+ mice (Fig 3B black bars). These results suggest that CYP2A5 protects against alcohol-induced fatty liver.
Figure 3.


Fat accumulation in liver fat is more pronounced in cytochrome P450 2A5 knockout mice than cytochrome P450 2A5 wild type mice. (A) Liver triglycerides; (B) Serum triglycerides and glucose. * P<0.05, compared with Control group; # P<0.05, compared with cyp2a5+/+ Ethanol group. (C) Western blotting analyses for lipid metabolic enzymes. (D) Western blotting quantification. *P<0.05, compared with WT Control; #P<0.05, compared with KO Control. & P<0.05, compared with WT Ethanol.
WT, cyp2a5+/+ mice; KO, cyp2a5−/− mice. TG, triglycerides; FAS, fatty acid synthase; AOX, acyl-CoA oxidase; PPARα, peroxisome proliferator-activated receptor α; CPT I, Carnitine palmitoyltransferase I; T-AMPK, total AMPK; p-AMPK, phosphorylated AMP-activated protein kinase; cyp2a5−/− mice, cytochrome P450 2A5 knockout mice; cyp2a5+/+ mice, cytochrome P450 2A5 wild type mice.
Fat accumulation in the liver may be associated with decreased lipid oxidation and increased lipogenesis. The levels of fatty acid synthase (FAS), a major lipogenic enzyme, were higher in control diet-fed cyp2a5−/− mice than cyp2a5+/+ mice, but the enzyme was down-regulated by ethanol feeding to the same extent (around 50%) in cyp2a5−/− and cyp2a5+/+ mice (Fig 3C and D), thus suggesting that FAS inhibition does not contribute to the more pronounced fatty liver in cyp2a5−/− mice. AMP-activated protein kinase (AMPK) is also a regulator of lipid metabolism. Inhibition of AMPK plays a key role in ethanol-induced fatty liver by enhancing lipogenesis and depressing the rate of fatty acid β-oxidation (20). However, after ethanol feeding, we did not observe any difference in the ratio of p-AMPK/T-AMPK between cyp2a5+/+ and cyp2a5−/− mice (Fig 3C and D). PPARα regulates mitochondrial and peroxisomal fatty acid oxidation. AOX, a target gene of PPARα, is a key enzyme in peroxisomal fatty oxidation, and CPT I, another PPARα-regulated enzyme, is involved in mitochondrial fatty acid oxidation (21, 22). We previously reported that after ethanol feeding PPARα and AOX were upregulated in cyp2e1−/− mice but not in WT mice, which might be a reason why no or little alcoholic fatty liver was observed in cyp2e1−/− mice (17). Like FAS, the basal levels of PPARα and AOX were higher in cyp2a5−/− mice than cyp2a5+/+ mice; however, after ethanol feeding, PPARα and AOX were up-regulated in cyp2a5+/+ mice, but were down-regulated in cyp2a5−/− mice (Fig 3C and D). Additionally, we found no change in CPT I expression after ethanol feeding (Fig 3C and D). These results suggest that the inhibited PPARα may contribute to the more pronounced alcoholic fatty liver in cyp2a5−/− mice via regulating AOX (the peroxisomal fatty acid oxidation) but not CPT I (the mitochondrial fatty acid oxidation).
Oxidative stress induced by chronic ethanol feeding in cyp2a5−/− mice
CYP2E1 is an active generator of ROS, and CYP2E1-mediated oxidative stress contributes to liver injury (10). We thus wondered whether CYP2E1-dependent induction of CYP2A5 has an effect on CYP2E1-mediated oxidative stress. GSH was comparably decreased by ethanol feeding in cyp2a5−/− and cyp2a5+/+ mice (Fig 4A). However, after ethanol feeding, more 3-NT adduct formation was detected in cyp2a5−/− mice than cyp2a5+/+ mice (Fig 4B). Similarly, more 4-HNE adducts were formed in cyp2a5−/− mice than cyp2a5+/+ mice (Fig 4C). Furthermore, TBARS, a marker of lipid peroxidation, was increased by ethanol feeding more than 2-fold in cyp2a5−/− mice, but only by 50% in cyp2a5+/+ mice (Fig 4D). These results suggest that CYP2A5 induction inhibits alcohol-induced oxidative stress.
Figure 4.
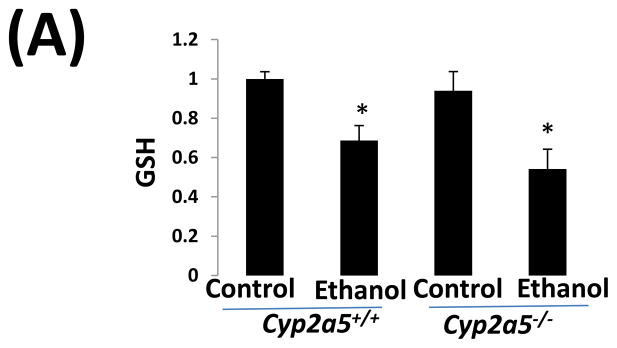


Ethanol-induced oxidative stress is more severe cytochrome P450 2A5 knockout mice than cytochrome P450 2A5 wild type mice. (A) Hepatic reduced glutathione; (B) 3-nitrotyrosine adduct and (C) 4-hydroxyl-nonenal adduct formation in liver sections detected by Immunohistochemistry staining (D) Hepatic thiobarbituric acid reactive substances. * P<0.05, compared with Control group; # P<0.05, compared with cyp2a5+/+ Ethanol group. PV, portal vein; CV, central vein. GSH, reduced glutathione; TBARS, thiobarbituric acid reactive substances. cyp2a5−/− mice; cytochrome P450 2A5 knockout mice; cyp2a5+/+ mice, cytochrome P450 2A5 wild type mice.
Liver injury induced by chronic ethanol feeding in pparα−/− mice
Impaired PPARα signalling is probably a major reason for the enhanced alcoholic liver injury in cyp2a5−/− mice, because PPARα was decreased in cyp2a5−/− mice but not in cyp2a5+/+ mice (Fig. 3C, 3D). Pparα−/− mice were used to confirm the role of PPARα in the development of alcoholic liver injury. After 3 weeks of ethanol feeding, the serum levels of ALT and AST were elevated in pparα−/− mice to a greater extent than in pparα+/+ mice (Fig 5A); serum TG was also increased in pparα−/− mice but not in pparα+/+ mice (Fig 5B). These results suggest that PPARα regulates the development of alcoholic liver injury. Liver expression of CYP2E1 and CYP2A5 was comparably induced in pparα−/− and pparα+/+ mice (Fig 5C), and also CYP2E1 and CYP2A5 activity followed a similar trend (Fig 5D), thus suggesting that the difference in alcoholic liver injury between pparα−/− and pparα+/+ mice is not due to CYP2E1 and CYP2A5.
Figure 5.

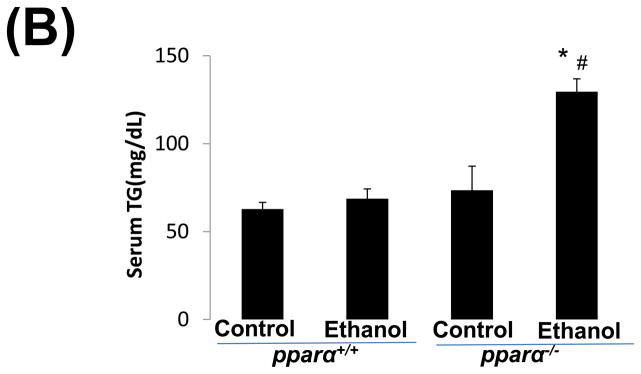
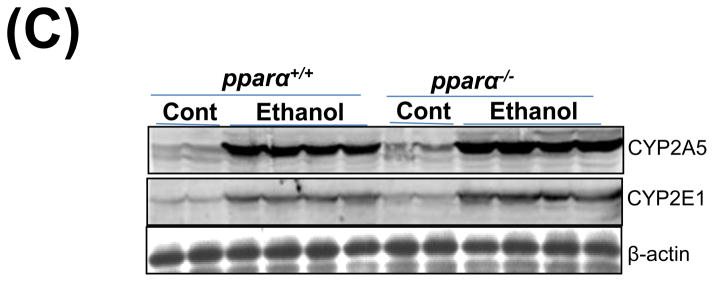

Ethanol-induced liver injury is more severe in peroxisome proliferator-activated receptor α knockout mice than peroxisome proliferator-activated receptor α wild type mice. (A) Serum activity of alanine aminotransferase and aspartate aminotransferase; (B) Serum triglycerides; (C) Liver expression of cytochrome P450 2E1 and cytochrome P450 2A5; (D) Activity of cytochrome P450 2E1 and cytochrome P450 2A5. * P<0.05, compared with Cont group; # P<0.05, compared with pparα+/+ Ethanol group; &P<0.05, compared with pparα−/− Control Group.
ALT, alanine aminotransferase; AST, aspartate aminotransferase; TG, triglyceride; pparα−/−; mice, peroxisome proliferator-activated receptor α knockout mice; pparα+/+ mice, peroxisome proliferator-activated receptor α wild type mice.
DISCUSSION
Recently, we found that ethanol induction of CYP2A5 was CYP2E1-dependent (9, 12). It is well known that ethanol can induce CYP2E1, and that CYP2E1-mediated oxidative stress is a risk factor for alcoholic liver injury (10, 11). Indeed, ethanol-induced fatty liver, an early stage of alcoholic liver injury, was observed in WT mice but not in cyp2e1−/− mice (17); when human CYP2E1 was reintroduced and expressed in cyp2e1−/− mice, the alcoholic liver injury was observed again (23). We initially hypothesized that CYP2A5 is a downstream molecule of CYP2E1 signalling that promotes alcohol-induced oxidative stress and liver injury. However, in this study we found that CYP2A5 plays an antioxidant role, i.e. CYP2A5 protects against alcoholic liver injury and does not promote it.
How can CYP2E1-dependent CYP2A5 induction inhibit oxidative stress? Besides generating oxidants including ROS, CYP2E1 can also up-regulate antioxidants, a function that may reflect an adaptive mechanism to remove CYP2E1-derived oxidants (24). In CYP2E1 over-expressing HepG2 cells, antioxidants including GSH, catalase, and GST are up-regulated (25, 26). Due to the increase in ROS produced by the elevated levels of CYP2E1, Nrf2 is up-regulated in CYP2E1 over-expressing HepG2 cells and in livers from ethanol-fed rodents (27, 28). It is generally accepted that Nrf2 up-regulates antioxidant enzymes, such as heme oxygenase 1(HO-1) and glutamyl cysteinylglycine synthase (a rate-limiting enzyme for GSH synthesis), to antagonize CYP2E1-mediated liver injury (13). Ethanol-induced liver injury was more severe in Nrf2 knockout (Nrf2−/−) mice than WT mice, suggesting that the up-regulation of Nrf2 protects against alcoholic liver disease (14). It was also reported that chronic ethanol feeding does not induce HO-1 in rodents (29). In the present study, a similar decrease in GSH levels was observed in ethanol-treated WT mice and cyp2a5−/− mice; thus, other Nrf2-regulated mechanisms may be involved. CYP2A6, the human orthologue to CYP2A5, is regulated by Nrf2 (7, 30). Recently, we found that the ethanol induction of CYP2A5 occurs through a CYP2E1-ROS-Nrf2 pathway. Nrf2 appears to play a central role in the ethanol induction of CYP2A5 as the increase in CYP2A5 was less in Nrf2−/− mice than WT mice, but the increase in CYP2E1 was comparable in Nrf2−/− and WT mice (12). Whether cyp2a5 is among the panel of Nrf2-regulated antioxidant genes is a very interesting issue that needs further studies. Alcoholic liver diseases include a spectrum of disorders ranging from steatosis (fatty liver) to steatohepatitis (inflammation), liver fibrosis, cirrhosis, and even liver cancer. In patients with alcoholic and non-alcoholic fatty liver, hepatic CYP2A6 was up-regulated and, very interestingly, liver CYP2A6 expression co-localized with lipid droplets (8). These results suggest that human CYP2A6 may participate in the regulation of lipid metabolism for the development of both alcoholic and non-alcoholic fatty liver. Kirby et al first proposed the notion that CYP2A5 may involve hepatic lipid metabolism (3). Here we found that the ethanol-induced liver content of TG, as well as the serum levels of TG and glucose, were higher in cyp2a5−/− mice than cyp2a5+/+ mice; similarly, alcoholic fatty liver was also more pronounced in cyp2a5−/− than cyp2a5+/+ mice. In another model, after high-fat diet feeding, the body weight was increased more rapidly in cyp2a5−/− than cyp2a5+/+ mice and fatty liver was more pronounced in cyp2a5−/− than cyp2a5+/+ mice (unpublished results). The results for both alcoholic and non-alcoholic fatty liver animal models suggest that CYP2A5 contributes to hepatic lipid metabolism. FAS and AOX are two major enzymes involved in lipid metabolism. In the present study, we found that the basal levels of FAS and AOX are higher in cyp2a5−/− than cyp2a5+/+ mice, suggesting that there is a more active lipid metabolism in cyp2a5−/− mice than cyp2a5+/+ mice. After ethanol feeding, FAS was comparably decreased in cyp2a5−/− and cyp2a5+/+ mice, while AOX was decreased in cyp2a5−/− mice but not in cyp2a5+/+ mice. AOX is regulated by PPARα, and basal levels of PPARα are also higher in cyp2a5−/− than cyp2a5+/+ mice. It was reported that pparα−/− mice developed more pronounced alcoholic fatty liver (31). Indeed, we also found that after 3 weeks of ethanol feeding serum ALT, AST, and TG were significantly increased in Pparα−/− mice but not in pparα+/+ mice (Figure 5A, 5B), suggesting that PPARα protects against alcoholic liver injury. However, CYP2E1 and CYP2A5 levels were comparable in pparα−/− and pparα+/+ mice (Figure 5C, 5D), suggesting that PPARα regulates lipid oxidation independently of CYP2E1 and CYP2A5.
Hepatic stellate cells (HSCs), that are normally quiescent, represent a major cell type responsible for liver fibrogenesis. Upon chronic liver injury, quiescent HSCs become activated and α-SMA is used as a marker for activated HSCs (32). Activated HSCs synthesize and secrete extra fibrillar collagen-I, which contributes to liver fibrosis (32). In primary isolated mouse HSCs, CYP2A5, but not CYP2E1, was detected by western blotting analysis (Supplementary Figure S1). Usually, the Lieber-Decarli ethanol model does not induce fibrosis. In fact, although we detected more collagen deposit after ethanol feeding, no fibrosis was observed. In another model of liver fibrosis, bile duct ligation (BDL)-induced liver fibrosis was more severe in cyp2a5−/− than cyp2a5+/+ mice (Supplementary Figure S2). Whether CYP2A5 in HSCs can be induced by ethanol feeding and whether CYP2A5 in HSCs may inhibit HSCs activation and protect against liver fibrogenesis require further studies.
In conclusion, although ethanol induction of CYP2A5 is CYP2E1-dependent, unlike CYP2E1, CYP2A5 protects against alcohol-induced oxidative stress and liver injury. CYP2A5 may participate in lipid metabolism, by inhibiting fat accumulation in liver and, consequently, inhibiting steatohepatitis.
Supplementary Material
Acknowledgments
Grants: These studies were supported by USPHS grants R21 AA-0213625 and AA -020877 from the National Institute on Alcohol Abuse and Alcoholism and ABMRF/The Foundation for Alcohol Research.
We thank Dr. Xinxin Ding for cyp2a5−/− mice, Dr. Jerome Lasker for CYP2E1 antibody, Dr. Risto Juvonen for CYP2A5 antibody, Professor Paul Van Veldhoven for AOX antibody.
Footnotes
Conflict of interest
We, the authors the article entitled “Absence of cytochrome P450 2A5 enhances alcohol-induced liver injury in mice”, declare that there is not any conflict of interest.
Publisher's Disclaimer: This is a PDF file of an unedited manuscript that has been accepted for publication. As a service to our customers we are providing this early version of the manuscript. The manuscript will undergo copyediting, typesetting, and review of the resulting proof before it is published in its final citable form. Please note that during the production process errors may be discovered which could affect the content, and all legal disclaimers that apply to the journal pertain.
References
- 1.Su T, Ding X. Regulation of the cytochrome P4502A genes. Toxicol Appl Pharmacol. 2004;199:285–294. doi: 10.1016/j.taap.2003.11.029. [DOI] [PubMed] [Google Scholar]
- 2.Abu-Baka A, Hakkola J, Juvonen R, et al. Function and regulation of the Cyp2a5/CYP2A6 genes in response to toxic insults in the liver. Curr Drug Metab. 2013;14:137–50. [PubMed] [Google Scholar]
- 3.Kirby GM, Nichols KD, Antenos M. CYP2A5 induction and hepatocellular stress: an adaptive response to perturbations of heme homeostasis. Curr Drug Metab. 2011;12:186–97. doi: 10.2174/138920011795016845. [DOI] [PubMed] [Google Scholar]
- 4.Raunio H, Rahnasto-Rilla M. CYP2A6: genetics, structure, regulation, and function. Drug Metabol Drug Interact. 2012;27:73–88. doi: 10.1515/dmdi-2012-0001. [DOI] [PubMed] [Google Scholar]
- 5.Honkakoski P, Negishi M. The structure, function, and regulation of cytochrome P450 2A enzymes. Drug Metab Rev. 1997;29:977– 96. doi: 10.3109/03602539709002240. [DOI] [PubMed] [Google Scholar]
- 6.Raunio H, Syngelma T, Pasanen M, et al. Immunochemical and catalytical studies on hepatic coumarin 7-hydroxylase in man, rat, and mouse. Biochem Pharmacol. 1988;37:3889–3895. doi: 10.1016/0006-2952(88)90070-6. [DOI] [PubMed] [Google Scholar]
- 7.Jin M, Kumar A, Kumar S. Ethanol-mediated regulation of cytochrome P450 2A6 expression in monocytes: role of oxidative stress-mediated PKC/MEK/Nrf2 pathway. PLoS One. 2012;7:e35505. doi: 10.1371/journal.pone.0035505. [DOI] [PMC free article] [PubMed] [Google Scholar]
- 8.Niemela O, Parkkila S, Juvonen RO, et al. Cytochromes P4502A6, 2E1 and 3A and production of protein aldehyde adducts in the liver of patients with alcoholic and non-alcoholic liver diseases. J Hepatol. 2000;33:893–901. doi: 10.1016/s0168-8278(00)80120-8. [DOI] [PubMed] [Google Scholar]
- 9.Lu Y, Zhuge J, Wu D, et al. Ethanol induction of CYP2A5: permissive role for CYP2E1. Drug Metab Dispos. 2011;39:330–6. doi: 10.1124/dmd.110.035691. [DOI] [PMC free article] [PubMed] [Google Scholar]
- 10.Lu Y, Cederbaum AI. CYP2E1 and oxidative liver injury by alcohol. Free Rad Biol Med. 2008;44:723–738. doi: 10.1016/j.freeradbiomed.2007.11.004. [DOI] [PMC free article] [PubMed] [Google Scholar]
- 11.Cederbaum AI, Lu Y, Wu D. Role of oxidative stress in alcohol-induced liver injury. Arch Toxicol. 2009;83:519–548. doi: 10.1007/s00204-009-0432-0. [DOI] [PubMed] [Google Scholar]
- 12.Lu Y, Zhang XH, Cederbaum A. Ethanol induction of CYP2A5: role of CYP2E1-ROS-Nrf2 pathway. Toxicol Sci. 2012;128:427–38. doi: 10.1093/toxsci/kfs164. [DOI] [PMC free article] [PubMed] [Google Scholar]
- 13.Cederbaum A. Nrf2 and antioxidant defense against CYP2E1 toxicity. Expert Opin Drug Metab Toxicol. 2009;5:1223–44. doi: 10.1517/17425250903143769. [DOI] [PubMed] [Google Scholar]
- 14.Lamlé J, Marhenke S, Borlak J, et al. Nuclear factor-eythroid 2-related factor 2 prevents alcohol-induced fulminant liver injury. Gastroenterology. 2008;134:1159–68. doi: 10.1053/j.gastro.2008.01.011. [DOI] [PubMed] [Google Scholar]
- 15.Zhou X, Zhuo X, Xie F, et al. Role of CYP2A5 in the clearance of nicotine and cotinine: insights from studies on a CYP2a5-null mouse model. J Pharmacol Exp Ther. 2010;332:578–587. doi: 10.1124/jpet.109.162610. [DOI] [PMC free article] [PubMed] [Google Scholar]
- 16.Lieber CS, DeCarli LM. Animal models of chronic ethanol toxicity. Methods Enzymol. 1994;233:585–594. doi: 10.1016/s0076-6879(94)33061-1. [DOI] [PubMed] [Google Scholar]
- 17.Lu Y, Zhuge J, Wang X, et al. Cytochrome P450 2E1 contributes to ethanol-induced fatty liver in mice. Hepatology. 2008;47:1483–94. doi: 10.1002/hep.22222. [DOI] [PubMed] [Google Scholar]
- 18.Lu Y, Cederbaum AI. Cisplatin-induced hepatotoxicity is enhanced by elevated expression of cytochrome P450 2E1. Toxicol Sci. 2006;89:515–23. doi: 10.1093/toxsci/kfj031. [DOI] [PubMed] [Google Scholar]
- 19.Lu Y, Wang X, Cederbaum AI. Lipopolysaccharide-induced liver injury in rats treated with the CYP2E1 inducer pyrazole. Am J Physiol Gastrointest Liver Physiol. 2005;289:G308–19. doi: 10.1152/ajpgi.00054.2005. [DOI] [PubMed] [Google Scholar]
- 20.You M, Matsumoto M, Pacold CM, et al. The role of AMP-activated protein kinase in the action of ethanol in the liver. Gastroenterology. 2004 Dec;127(6):1798–808. doi: 10.1053/j.gastro.2004.09.049. [DOI] [PubMed] [Google Scholar]
- 21.Kersten S, Seydoux J, Peters JM, et al. Peroxisome proliferator-activated receptor alpha mediates the adaptive response to fasting. J Clin Invest. 1999;103:1489–1498. doi: 10.1172/JCI6223. [DOI] [PMC free article] [PubMed] [Google Scholar]
- 22.Leone TC, Weinheimer CJ, Kelly DP. A critical role for the peroxisome proliferator-activated receptor alpha (PPARalpha) in the cellular fasting response: the PPARalpha-null mouse as a model of fatty acid oxidation disorders. Proc Natl Acad Sci USA. 1999;96:7473–7478. doi: 10.1073/pnas.96.13.7473. [DOI] [PMC free article] [PubMed] [Google Scholar]
- 23.Lu Y, Wu D, Wang X, et al. Chronic alcohol-induced liver injury and oxidant stress are decreased in cytochrome P4502E1 knockout mice and restored in humanized cytochrome P4502E1 knock-in mice. Free Radic Biol Med. 2010;49:1406–16. doi: 10.1016/j.freeradbiomed.2010.07.026. [DOI] [PMC free article] [PubMed] [Google Scholar]
- 24.Marí M, Cederbaum AI. Induction of catalase, alpha, and microsomal glutathione S-transferase in CYP2E1 overexpressing HepG2 cells and protection against short-term oxidative stress. Hepatology. 2001;33:652–61. doi: 10.1053/jhep.2001.22521. [DOI] [PubMed] [Google Scholar]
- 25.Marí M, Cederbaum AI. CYP2E1 overexpression in HepG2 cells induces glutathione synthesis by transcriptional activation of gamma-glutamylcysteine synthetase. J Biol Chem. 2000;275:15563–71. doi: 10.1074/jbc.M907022199. [DOI] [PubMed] [Google Scholar]
- 26.Marí M, Wu D, Nieto N, et al. CYP2E1-dependent toxicity and up-regulation of antioxidant genes. J Biomed Sci. 2001;8:52–8. doi: 10.1007/BF02255971. [DOI] [PubMed] [Google Scholar]
- 27.Gong P, Cederbaum AI. Transcription factor Nrf2 protects HepG2 cells against CYP2E1 plus arachidonic acid-dependent toxicity. J Biol Chem. 2006a;281:14573–9. doi: 10.1074/jbc.M600613200. [DOI] [PubMed] [Google Scholar]
- 28.Gong P, Cederbaum AI. Nrf2 is increased by CYP2E1 in rodent liver and HepG2 cells and protects against oxidative stress caused by CYP2E1. Hepatology. 2006b;43:144–53. doi: 10.1002/hep.21004. [DOI] [PubMed] [Google Scholar]
- 29.Mandal P, Pritchard MT, Nagy LE. Anti-inflammatory pathways and alcoholic liver disease: role of an adiponectin/interleukin-10/heme oxygenase-1 pathway. World J Gastroenterol. 2010;16:1330–6. doi: 10.3748/wjg.v16.i11.1330. [DOI] [PMC free article] [PubMed] [Google Scholar]
- 30.Yokota S, Higashi E, Fukami T, et al. Human CYP2A6 is regulated by nuclear factor-erythroid 2 related factor 2. Biochem Pharmacol. 2011;81:289–94. doi: 10.1016/j.bcp.2010.09.020. [DOI] [PubMed] [Google Scholar]
- 31.Okiyama W, Tanaka N, Nakajima T, et al. Polyenephosphatidylcholine prevents alcoholic liver disease in PPARalpha-null mice through attenuation of increases in oxidative stress. J Hepatol. 2009;50:1236–46. doi: 10.1016/j.jhep.2009.01.025. [DOI] [PMC free article] [PubMed] [Google Scholar]
- 32.Mallat A, Lotersztajn S. Cellular mechanisms of tissue fibrosis. 5. Novel insights into liver fibrosis. Am J Physiol Cell Physiol. 2013;305:C789–799. doi: 10.1152/ajpcell.00230.2013. [DOI] [PubMed] [Google Scholar]
Associated Data
This section collects any data citations, data availability statements, or supplementary materials included in this article.