

Abstract
Multiple histologic measurements are commonly used to assess degenerative changes in intervertebral disc (IVD) structure; however, there is no consensus on which stains offer the clearest visualization of specific areas within the IVD. The objective of this study was to compare multiple tinctorial stains, evaluate their ability to highlight structural features within the IVD, and investigate how they influence the capacity to implement a degeneration scoring system. Lumbar IVDs from seven human autopsy specimens were stained using six commonly used stains (Hematoxylin/Eosin, Toluidine Blue, Safranin‐O/Fast Green, Extended FAST, modified Gomori's Trichrome, and Picrosirius Red Alcian Blue). All IVDs were evaluated by three separate graders to independently determine which stains (i) were most effective at discerning different structural features within different regions of the IVDs and (ii) allowed for the most reproducible assessment of degeneration grade, as assessed via the Rutges histological scoring system (Rutges et al. A validated new histological classification for intervertebral disc degeneration. Osteoarthritis Cartilage, 21, 2039‐47). Although Trichrome, XFAST and PR/AB stains were all effective at highlighting different regions of whole IVDs, we recommend the use of PR/AB because it had the highest degree of rater agreement on assigned degeneration grade, allowed greater resolution of degeneration grade, has an inferential relationship between color and composition, and allowed clear differentiation of the different regions and structural disruptions within the IVD. The use of a standard set of stains together with a histological grading scheme can aid in the characterization of structural changes in different regions of the IVD and may simplify comparisons across the field. This collection of human IVD histological images highlights how IVD degeneration is not a single disease but a composite of multiple processes such as aging, injury, repair, and disease, each of which are unique to the individual.
Keywords: degeneration, human, intervertebral disc, Picrosirius Red/Alcian Blue staining
Introduction
The intervertebral disc (IVD) is the fibro‐cartilaginous structure that transfers and distributes spinal loads between vertebral bodies while allowing mobility. The IVD consists of three distinct regions, the annulus fibrosus (AF), nucleus pulposus (NP) and the cartilaginous endplate (CEP). The NP is located in the center of the IVD and is largely composed of proteoglycans held together by a loose network of randomly oriented collagen type II fibers (Roughley, 2004). The AF surrounds and contains the gelatinous NP and consists of concentric fibrous layers, made up of highly organized collagen type I fibers. The CEP is a thin layer of hyaline cartilage that acts as an interface between the IVD and adjacent vertebrae and is rich in proteoglycans held together by a network of type II collagen fibers. With advancing age the composition of the IVD undergoes substantial changes and accumulates structural defects, frequently leading to loss of structural competency. There are multiple measurement techniques available to visualize the structural changes within the IVD, ranging from magnetic resonance imaging (Lotz et al. 2012) to histology. Histologic assessment is a common endpoint measurement used to identify changes in the gross morphology of the IVD. However, there is no clear consensus on which stains offer the clearest visualization of specific areas within the IVD. Human IVDs undergo alterations in composition and structure with aging and degeneration that are typically more substantial than those observed in most animal models, making the identification and understanding of these structural features particularly important. The large changes in structure and composition that occur with human disc degeneration make it a priority to help standardize investigative techniques and improve comparisons across the field.
Low back pain is the ‘leading’ cause of disability throughout the world (Vos et al. 2012) and IVD degeneration is considered a key factor in its development (Andersson, 1999; Samartzis et al. 2013). Human IVDs exhibit changes that result from development, aging, injury, attempted repair, and disease. Recent work has highlighted the role that structural defects, such as annular fissure and endplate disruptions, can play in the development of painful IVD degeneration (Adams & Dolan, 2012; Stefanakis et al. 2012; Lotz et al. 2013). Given the importance that structural defects have in the degenerative process, and their possible association with pain, it is important to be able to clearly visualize specific areas within the IVD.
Histological investigations can identify relevant structural and compositional changes occurring during human IVD degeneration. These features are an important outcome in many basic science studies. Multiple tinctorial stains have been used to study the IVD, with some stains chosen because they are sensitive to changes in composition, others chosen to highlight specific structural features, and others chosen because of familiarity. It remains unclear whether stains that are good at visualizing healthy IVDs will be effective at identifying important structural and compositional features of aged and degenerated IVDs, since IVDs are known to undergo substantial structural, compositional and pH changes as degeneration progresses (Lotz et al. 2012).
The objective of this study was to compare multiple commonly used tinctorial staining protocols on matched sagittal sections from a collection of human IVDs. Human lumbar IVDs of diverse ages were obtained from autopsy services and selected for use in this study. The stains chosen for evaluation in this study are commonly used in both IVD and cartilage studies to highlight structural and cellular morphology, and included: Hematoxylin/Eosin (H&E), Safranin‐O/Fast Green (Saf‐O/FG), Toluidine Blue, modified Gomori's Trichrome (Trichrome), Picosirius Red/Alcian Blue (PR/AB) (Gruber et al. 2002), and the extended FAST (XFAST) (Leung et al. 2009). The Rutges histological grading scheme for IVD degeneration was applied since this classification was previously validated to have high reproducibility for both inexperienced and experienced researchers and allowed characterization of degenerative changes in multiple regions of the IVD (Rutges et al. 2013). The most appropriate stain for visualizing the different regions of the IVD at different magnifications and at different stages of degeneration was determined by evaluating the degeneration grade, inter‐observer reliability of that staining method, and qualitative assessments of IVD structure and staining specificity.
Materials and methods
Human tissue preparation
Permission was obtained for use of cadaveric material prior to specimen procurement. Seven human lumbar IVDs were isolated from seven spinal segments (Table 1). Following procurement, all excess tissue was removed via bulk dissection. A bandsaw (Marmed, Cincinnati, OH, USA) was used to isolate each IVD by cutting through the vertebrae while retaining a thin layer of the superior and inferior vertebral endplates. Tissue taken for histology consisted of either a central sagittal strip of tissue (~ 10 mm wide) or alternately the IVD was sectioned sagitally in the mid‐line and one hemi‐disc was taken. A Thompson degeneration grade was assigned for each isolated IVD segment prior to fixation. All tissue was fixed in zinc formalin (Z‐Fix®, Anatech LTD, Battle Creek, MI, USA) for at least 48 h. All samples were processed and embedded in methyl‐methacrylate (MMA) as previously described (Laudier et al. 2007) and summarized in Supplemental Table 1. Embedding in MMA allows reliable assessment of IVD structure and cellular morphology on intact vertebra‐IVD‐vertebra sections without a decalcification step. Additionally, MMA facilitates the best possible retention of the original structure and retains the ability to conduct standard histochemical assays including immunohistochemistry (Erben, 1997; Laudier et al. 2007; Torgersen et al. 2009). Serial sections (5 μm thick) were taken from each sample using a sledge microtome (Leica SM2500 base) with a D‐profile tungsten carbide knife and stained with the selection of tinctorial stains.
Table 1.
Human intervertebral disc specimen information
| Age, years | Gender | Level/region | Thompson grade |
|---|---|---|---|
| 8 | F | Lumbar | 1 |
| 44 | M | Lumbar | 2 |
| 53 | M | T12/L1 | 3 |
| 81 | F | Lumbar | 3 |
| 93 | M | L2/3 | 3 |
| 47 | F | L2/3 | 4 |
| 85 | M | L4/5 | 5 |
Tinctorial stain comparison
All IVDs were stained with multiple tinctorial stains: H&E, Saf‐O/FG, Toluidine Blue, Trichrome, PR/AB and XFAST, which consists of Light Green, Alcian Blue, Safranin‐O, and Tartrazine. In both XFAST and Saf‐O/FG staining procedures, Light Green (Cat# 02753, Polysciences Inc., Warrington, PA, USA) was used in place of Fast Green, as both stains have similar staining specificity (Green, 1991) and Light Green gives greater contrast and color fidelity. All samples were deplasticized in two 10‐min serial washes of xylene followed by a wash in 50% xylene/50% 2‐ethoxyethanol (EGME) and three serial rinses of EGME. After slides were deplasticized they were stained with one of the following staining protocols. H&E: Slides were stained in Gomori's hematoxylin (Polyscientific, Bay Shore, NY, USA) for 5 min, rinsed, and stained in Eosin Y for 1 min. Saf‐O/FG: Slides were stained in 1% Light Green for 3 min and 0.1% Safranin‐O for 5 min with a brief rinse in 1% acetic acid in water in between stains. Toluidine Blue: Slides were stained in 10% Toluidine Blue for 15 min, rinsed and coverslipped. Trichrome: Slides were stained in one‐step Gormori's Trichrome (w/Aniline Blue) for 20 min, rinsed in water, 1% acetic acid, water and then coverslipped. PR/AB: Slides were stained as previously described (Gruber et al. 2002); however, the Weigert's H&E was not included. XFAST: Slides were stained as previously described (Leung et al. 2009), with Light Green used in place of Fast Green.
All images were taken on an upright light microscope (Ziess, AxioImager Z1) using axiovision software. All low magnification images (2.5× and 10×) are composite images of multiple individual images that have been ‘stitched’ together to create a mosaic and represent either the entire IVD (2.5×) or a region of interest (10×). Regions of interest focused on the CEP and NP/AF transition representing an area ~ 12 mm2 and Schmorl's node regions representing an area ~ 26 mm2. High magnification images were acquired at 63×. All images were qualitatively assessed for clarity of the different structural features within the IVD including the demarcation between the different regions (NP/AF boundary and CEP/NP separation) and the degree of structural disruption and fibrosis within the NP.
IVD degeneration scoring comparison
The degeneration score of each IVD mosaic image (2.5×) with all the different stains was assessed using the scoring system described by Rutges et al. (2013). The Rutges scoring system was chosen because it focuses on the assessment of degeneration within different regions of the IVD, has been previously validated and is relatively easy to use for both experienced and inexperienced graders. The Rutges scheme consists of six categories which characterize the degenerative changes within each region of the IVD (Endplate structure, AF Morphology, AF/NP Boundary, NP Cellularity, NP matrix distribution, and NP matrix staining) with each category receiving a score of between 0 and 2. We assessed only the low magnification (2.5×) stitched mosaics that demonstrated the overall amount of degeneration and also allowed assessment of each individual region. However, due to use of low magnification images, changes in NP cellularity category could not be clearly identified and we therefore modified this scheme to have a maximum score of 10. The results presented for the degeneration scores ranged between 0 for the healthiest IVDs and 10 for the most severely degenerated IVDs.
To investigate whether one stain allowed a more consistent assessment of a degeneration score, the degree of agreement of assigned scores (inter‐rater reliability) was calculated for all stained IVDs. Three graders (two experienced and one inexperienced) scored all of the samples and each section was graded twice by each grader to allow calculation of the inter‐ and intra‐observer reliabilities for each scoring category, and for each stain.
Statistics
All intra‐ and interobserver reliabilities were assessed via the interclass correlation coefficient (ICC), using a two‐way mixed model based on absolute agreement. The ICCs presented are the ‘average measures’ ICCs, which are a measure of the consistency between scorers. The agreement between reviewers is considered ‘moderate’ if the ICC is 0.41–0.6, ‘substantial’ if it is 0.61–0.8 and ‘almost perfect’ if it is 0.81–1 (Landis & Koch, 1977), with 1 representing perfect agreement. For intra‐observer reliability, average ICCs were calculated from repeated scoring of the same samples by an individual grader. For interobserver reliability, average ICCs were calculated from the scoring of the same samples by multiple reviewers. All statistical analyses were performed using Statistical Package for the Social Sciences (spss) 20.0. It was not possible to determine whether there were statistical differences between ICCs.
Results
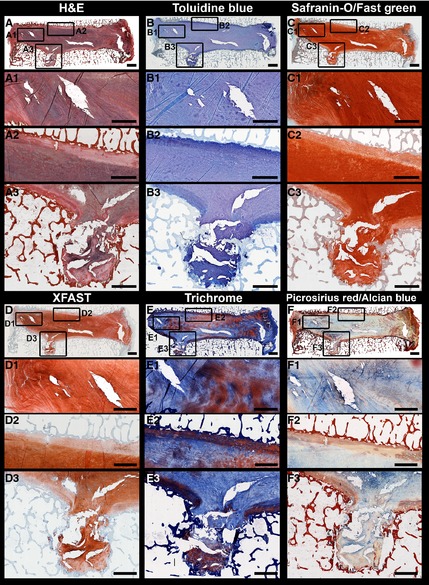
The clearest differences between stains were evident in the distinction of the degree of structural disruption and fibrosis within the NP and in the demarcation within the transition regions (NP/AF and CEP/NP). At low magnification (2.5×, Fig. 1) both the Saf‐O/FG and Toluidine Blue staining showed only subtle differences in the staining intensity between the different regions of the IVD and overall did not highlight the differences in structure (Fig. 1A). This trend was consistent across all degrees of degeneration. H&E staining did allow some differentiation of the CEP and of the NP/AF regions, but the distinction between the NP/AF was lost in more degenerated samples. The three stains that gave the clearest structural distinction at low magnification were XFAST, PR/AB, and Trichrome staining (Fig. 1B). XFAST and PR/AB stains clearly distinguished the three regions of the IVD and were the most sensitive to structural disruptions and changes in composition. Trichrome staining clearly highlighted structural features of the CEP, NP, and AF with very high ICC for NP structure and NP matrix staining (Table 2). However, Trichrome staining provided poor differentiation between the NP/AF boundary and poor agreement in the assigned grade of endplate structure, as reflected in the low ICC values (Table 2).
Figure 1.

(A) Human intervertebral disc (IVD) stain comparison: Stitched mosaic of 2.5× images of isolated human IVDs demonstrating progressive degrees of degeneration. Staining methods include Hematoxylin & Eosin (H&E), Toluidine Blue, and Safranin‐O/Fast Green. Scale bar: 5 mm. (B) Human IVD stain comparison: Stitched mosaic of 2.5× images of isolated human IVDs demonstrating progressive degrees of degeneration. Staining methods include Extended FAST (XFAST), Modified Gomori's Trichrome (Trichrome), and Picrosirius Red/Alcian Blue. Scale bar: 5 mm.
Table 2.
Interclass correlation coefficient (ICC) to assess inter‐observer reliability for each scoring category. All values are means with 95% confidence intervals (95%CI)
| H&E | Tol. blue | Saf‐O/FG | XFAST | Trichrome | PR/AB | |
|---|---|---|---|---|---|---|
| Scoring category | ||||||
| Endplate structure | 0.93 (0.74–0.99) | 0.94 (0.80–0.99) | 0.92 (0.73–0.99) | 0.93 (0.74–0.99) | 0.78 (0.22–0.88) | 0.93 (0.74–0.99) |
| AF morphology | 0.92 (0.74–0.99) | 0.91 (0.69–0.98) | 0.92 (0.69–0.99) | 0.80 (0.31–0.96) | 0.87 (0.52–0.98) | 0.89 (0.56–0.98) |
| AF/NP boundary | 0.86 (0.46–0.98) | 0.71 (0.10–0.94) | 0.86 (0.54–0.97) | 0.94 (0.77–0.99) | 0.59 (0–0.91) | 0.88 (0.56–0.98) |
| NP strucutre | 0.74 (0.12–0.95) | 0.86 (0.48–0.97) | 0.88 (0.55–0.98) | 0.74 (0.12–0.95) | 0.91 (0.66–0.98) | 0.84 (0.46–0.97) |
| NP matrix staining | 0.61 (0–0.93) | 0.85(0.46–0.97) | 0.51 (0–0.89) | 0.78 (0.22–0.96) | 0.96 (0.86–0.99) | 0.92 (0.71–0.99) |
| Average ICC | 0.81 | 0.85 | 0.82 | 0.84 | 0.82 | 0.89 |
| Total score | 0.97 (0.90–1.0) | 0.98 (0.90–1.0) | 0.98 (0.93–1.0) | 0.94 (0.78–0.99) | 0.94 (0.73–0.99) | 0.98 (0.91–1.0) |
The differences in staining within the transition zones (between the NP/AF and between the CEP/NP) became more evident at higher magnifications, especially in the healthier IVDs (Fig. 2). In the 44‐year‐old male IVD, the three stains that gave the clearest structural distinction were again XFAST, Trichrome, and PR/AB staining. Both XFAST and PR/AB staining (Fig. 2D,F) gave good differentiation of the three regions (CEP/NP/AF); however, the PR/AB staining was more intense and allowed clear definition of the different lamellae in the NP/AF transition zone. Trichrome staining highlighted both the demarcation of the CEP boundaries and the details of the structural variation within the CEP. In the 47‐year‐old female IVD the differences between the stains was less evident (Fig. 3). The CEP was clearly seen with three stains (Trichrome, H&E, and XFAST, Fig. 3D‐F); however, Trichrome staining showed the largest amount of variation within the CEP, suggesting it may be more sensitive to slight structural or compositional differences, although the exact compositional specificity is unclear. The NP region of the 47‐year‐old female IVD was very fibrous and contributed to the lack of visualization of the transition zones; however, both XFAST and PR/AB staining allowed visualization of the fiber structure within the AF and the NP (Fig. 3D,F). The 47‐year‐old female also had a Schmorl's node, which is a structural defect in the vertebral endplate that has been associated with degenerative processes (Mok et al. 2010). At 10× magnification, H&E XFAST and Trichrome stains allowed visualization of the remaining CEP and of the surrounding structural disruption, demonstrating the local effects of structural disruptions in the human IVD. At high magnification, the same stains (H&E, XFAST, and Trichrome) also accentuated the organization of chondrocytes and matrix in the cartilaginous endplate and intercalated blue and orange staining in the matrix‐surrounding cell clusters (Figs 4 and 5).
Figure 2.

Thompson grade 2 intervertebral disc (IVD) structures: Stitched mosaics of 2.5× images of the 44‐year‐old male IVD for stains (A) H&E, (B) Toluidine Blue, (C) Safranin‐O/Fast Green, (D) XFAST, (E) Trichrome, and (F) Picrosirius Red/Alcian Blue. Stitched mosaics of 10× images showing the (1) NP/AF transition and (2) CEP/NP transition. Scale bar: 1 mm.
Figure 3.
Thompson grade 4 intervertebral disc (IVD) structures: Stitched mosaics of 2.5× images of the 47‐year‐old female IVD for stains (A) H&E, (B) Toluidine Blue, (C) Safranin‐O/Fast Green, (D) XFAST, (E) Trichrome, (F) Picrosirius Red/Alcian Blue. High magnification stitched mosaics of 10× images showing the NP/AF transition (1) and the CEP/NP transition (2) and Schmorl's node (3). Scale bar: 1 mm.
Figure 4.

Thompson grade 2 intervertebral disc (IVD) cellular morphology: High magnification (63×) images of annulus fibrosus (AF), nucleus pulposus (NP), and cartilaginous endplate (Endplate) regions of the 44‐year‐old male IVD for all stains: (A) H&E, (B) Toluidine Blue, (C) Safranin‐O/Fast Green, (D) XFAST, (E) Trichrome, (F) Picrosirius Red/Alcian Blue. Scale bar: 20 μm.
Figure 5.
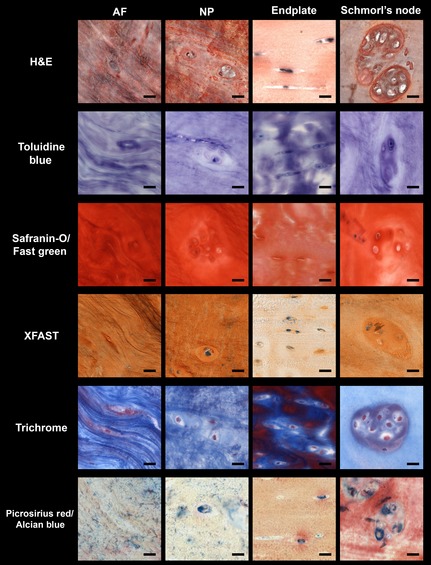
Thompson grade 4 intervertebral disc (IVD) cellular morphology: High magnification (63×) images of annulus fibrosus (AF), nucleus pulposus (NP), cartilaginous endplate (Endplate), and Schmorl's node regions of 47‐year‐old female IVD for all stains: (A) H&E, (B) Toluidine Blue, (C) Safranin‐O/Fast Green, (D) XFAST, (E) Trichrome, (F) Picrosirius Red/Alcian Blue. Scale bar: 20 μm.
H&E provided excellent imaging of the cells at the highest magnification (Figs 4 and 5) allowing differentiation of both the cellular morphology and the pericellular structure in all three regions of the IVD. Both the AF and NP cells and structure were clearly seen with H&E staining in both healthy and degenerated IVDs. In the 44‐year‐old male IVD, the stains that allowed clearest visualization of the CEP were Trichrome and XFAST staining (Fig. 4). Both stains also offered good identification of the pericellular regions in contrast to the rest of the bulk matrix. In the 47‐year‐female IVD, both H&E and Trichrome stains clearly highlighted the cellular morphology and potential variation in composition. PR/AB staining allowed visualization of the pericellular matrix and offered clear differences in the composition of the different regions but this staining did not have as clear structural resolution at high magnifications compared with the other stains in the degenerated IVD (Fig. 5).
When assessing whether one stain facilitated a more reliable assessment of a degeneration score we found that the agreement for all categories was characterized as ‘almost perfect’ (ICC > 0.84) when IVDs were stained with PR/AB, where for the other stains there was at least one category in which the degree of agreement fell below this threshold (Table 2). While scores within each region displayed some variation, the total scores exhibited excellent inter‐ and intra‐rater reliabilities with values > 0.92 (Supporting Information Table S2). The average assigned grade for each IVD was influenced by the chosen stain (Table 3, Supporting Information Table S3).
Table 3.
Average Rutges degeneration score of each patient by stain choice
| Spine | H&E | Toluidine blue | Saf‐O/FG | XFAST | Trichrome | PR/AB |
|---|---|---|---|---|---|---|
| 8/F | 1 | 1 | 0 | 2 | 1 | 0 |
| 44/M | 3 | 5 | 5 | 2 | 4 | 4 |
| 53/M | 4 | 7 | 5 | 4 | 5 | 3 |
| 81/F | 4 | 4 | 4 | 5 | 6 | 4 |
| 93/M | 6 | 6 | 5 | 7 | 7 | 8 |
| 47/F | 8 | 8 | 8 | 7 | 8 | 7 |
| 85/M | 10 | 10 | 10 | 10 | 10 | 10 |
Discussion
Multiple staining protocols have been described which allow histologic evaluation of IVD structure and composition (Gruber et al. 2002; Kim et al. 2003; Leung et al. 2009; Pattappa et al. 2012). However, there is no consensus on which stain is the most appropriate for visualizing different regions within the IVD with different levels of degeneration. The development of a standard set of stains and a scoring system to characterize the structural changes in different regions of the IVD will facilitate comparison of IVD structure between multiple studies and longitudinally. This study provided comparisons across different stains on matched sections of human IVDs with varying levels of degeneration. Our results show that the ability to assess important structural and cellular morphology features is influenced by stain choice, magnification, and the region(s) of interest. Our results further document that XFAST, PR/AB, and Trichrome staining all exhibit excellent demarcation of structures and visualization of individual cellular and structural components at different magnifications and stages of degeneration.
The overall utility of a staining scheme together with a scoring system is characterized by (i) the ability of multiple reviewers to agree on an assigned grade and (ii) the capacity of that stain to discriminate between grades of degeneration. The recommended stains (Table 4) are based on a combination of these two factors. One of the most useful aspects of the Rutges scoring system together with the XFAST and PR/AB stains is the ability to differentiate between degenerative changes/scores that are all encompassed within one grade of degeneration using the Thompson scale. For example, the 53, 81, and 93‐year‐old IVDs were all classified as a Thompson grade 3. However, when stained with either the XFAST stain or the PR/AB stain these same IVDs were all assigned different degeneration grades using the Rutges scale (Table 3). The greater resolution is due to the improved distinction of the structural disruptions within the NP region of the IVD (Fig. 1B). While it is notable that there was strong agreement between graders for the total degeneration score for all stains (Table 2), it is important to note that agreement alone is of limited value. For example, the Saf‐O/FG staining had high inter‐rater agreement (Table 2) but had poor resolution in discriminating the degree of degeneration, with four of the IVDs receiving scores of 4–5 (Table 3).
Table 4.
Stain recommendations by region and magnification
| Histologic features | Disease state | Region of interest | |||||
|---|---|---|---|---|---|---|---|
| Whole IVD | AF/NP transition | Annulus Fibrosus | Nucleus Pulposus | Cartilaginous Endplate | Schmorl's node | ||
| Cellular (63x) | Healthy | – | – | H&E | H&E | Trichrome, XFAST | – |
| Degenerated | – | – | H&E, Trichrome | H&Ea | Trichrome, H&E | H&E, Trichrome, PR/AB | |
| Matrix (2.5x/10x) | Healthy | PR/AB, XFAST | PR/AB, XFAST | PR/AB, XFAST | PR/AB, XFAST | Trichrome, PR/AB | – |
| Degenerated | PR/AB, XFAST | PR/AB, XFAST | PR/AB, XFAST | PR/AB, XFAST | Trichrome, XFAST, H&E | H&E, Trichrome | |
All stains, excluding Saf‐O/FG, are comparable.
Trichrome, XFAST, and PR/AB stains were all effective at highlighting different regions of whole IVDs. However, we recommend the use of PR/AB because it had the highest degree of rater agreement on assigned degeneration grade, allowed greater resolution of degeneration grade, provided inferential knowledge of changes in composition, and allowed clear differentiation of the different regions and structural disruptions within the IVD. XFAST staining gave clear differentiation between regions and highlighted changes in the NP region; however, the differences in color are more difficult to link to composition as Alcian Blue and Safranin‐O can both stain proteoglycans. Trichrome staining provided clear differentiation of the CEP and possible variations in composition. However, Trichrome staining did not allow the differentiation between the NP and AF region, which was reflected in the lowest inter‐rater reliability within the NP/AF boundary category. Furthermore, the differences in color are difficult to directly relate to a particular compositional component. At high magnifications (63×) H&E staining gave excellent cellular morphology and visualization of the different structural components within both the AF and NP regions.
Many of the structural changes associated with the progression of IVD degeneration were evident in this cohort of samples and these changes were clearest with the PR/AB, XFAST, and Trichrome staining. The 8‐year‐old female IVD had a clearly defined CEP of uniform thickness, extremely well‐organized AF morphology, the clearest distinction between the AF/NP regions, gelatinous NP structure, and intense NP matrix staining. The 44‐year‐old male IVD had a clearly defined and relatively uniform but thin CEP, well‐organized AF morphology, clear demarcation of the AF/NP boundary, and a NP matrix with some structural disruptions suggestive of the initiation of tissue fibrosis. The 53‐year‐old female IVD (with similar morphology as the 44‐year‐old male) had mild endplate defects, good AF structure, good NP/AF distinction and some minor structural disruptions in the NP. The 81‐year‐old female IVD and 93‐year‐old male IVD have somewhat similar appearances, with a thin CEP which had some structural irregularities, an intact AF structure, minor loss of NP/AF distinction, NP structure deterioration, and NP staining loss. The higher degeneration score for the 93‐year‐old female IVD is attributed to the greater loss of NP staining and deterioration of the NP structure as well as the observable buckling of the AF structure. The 47‐year‐old female IVD had a relatively uniform CEP thickness, excluding the Schmorl's node and the greatest numbers of AF fissures, but there was no distinction between the NP/AF and a loss of NP staining. The 85‐year‐old male IVD was the most severely degenerated with no discernible IVD structures. The vertebral endplates of the 81‐ and 93‐year‐old IVDs bow‐out, characteristic of ‘fish mouth’ vertebrae suggestive of osteopenia or osteoporosis. Mild osteoporosis has been shown to inversely correlate with IVD degeneration (Margulies et al. 1996; Harada et al. 1998; Mariconda et al. 2004); however, spines with severe osteoporosis also commonly exhibit severe IVD degeneration (Hansson & Roos, 1981; Fazzalari et al. 2001; Simpson et al. 2001; Pollintine et al. 2004).
This cohort of autopsy IVD samples demonstrates many examples where age does not correlate with degenerative changes. The 8‐, 44‐ and 53‐year‐old IVDs all retained a relatively healthy IVD morphology. However, the 47‐year‐old female had a higher degeneration score because of the many degenerative changes, including the Schmorl's node endplate defect and associated fissuring, loss of GAG, and extensive changes in cytomorphology with increased amounts of cloned cells in the area of the Schmorl's node. Most histologic assessments of IVD degeneration rely on the degree of structural changes within the IVD. However, as many structural defects can accumulate over a lifetime through multiple processes including aging, injury, attempted repair, and disease, older IVDs would be expected to have a greater amount of structural disruptions which may not be explicitly related to painful IVD degeneration. There is currently no set standard for what degree (amount and type) of changes should be considered ‘expected’ and the result of age or the degree of changes that would fall outside this range and could otherwise be associated with painful IVD degeneration. Establishing a standard set of structural changes associated with age may aid in the understanding of what specifically defines pathological IVD degeneration and may enhance current work which has suggested that there are distinct phenotypes of IVD degeneration (Adams & Dolan, 2012). While the assessment of age‐related changes requires a large cohort at all ages, this work is a first step in developing a standardized staining and scoring approach that in the future may be used to aid in better defining IVD degeneration.
All IVDs in this study were embedded in MMA, which in our opinion has many advantages over typical paraffin embedding, but it does require more time for processing than traditional paraffin embedding. MMA embedding facilitates the best possible morphological preservation while still allowing standard histochemical assays including immunohistochemical analyses (Erben, 1997; Torgersen et al. 2009). The increased rigidity of the MMA embedding medium also allows thinner sections, which can retain calcified bone and aid in the sectioning of larger samples. While some cutting artifacts can be observed in the sections from this study, they are minimized with MMA sections and the observation that fissures and clefts are of consistent size and shape on all sections from the same block demonstrates that they are not an artifact of the cutting process. It is important to note that the stain choice recommendations in this study are independent of the embedding method and should be applicable to both paraffin and MMA embedding.
We conclude that there is an extremely large variety of structural, compositional and cellular alterations in human IVDs and these distinct structural features provide a unique fingerprint combining genetic, environmental, and disease processes. Many degenerative changes to the IVD are not directly correlated with specimen age. This cohort of specimens demonstrates that endplate defects may be particularly important in their association with GAG loss, AF fiber buckling, and loss of NP structure and fissuring. This comprehensive stain comparison study with mosaic images allowed visualization of these extensive structural, compositional, and cellular features in the context of their niche within the entire IVD. We recommend the use of PR/AB together with low magnification mosaics, to implement the Rutges degeneration scoring system because this combination allowed consistent assessment of degeneration grade and characterization of degenerative changes within each region of the IVD. For visualization of specific regions of the IVD under higher magnification, we recommend PR/AB, H&E, and Trichrome because they allow distinction of important structural, compositional, and cellular features in human IVD degeneration. It is hoped that this stain comparison will simplify the choice of histologic measurements and their interpretations of degenerative changes within human IVDs and represent a step towards a standard approach that can aid in the characterization of structural changes in different regions of the IVD and their comparisons across studies.
Conflict of interest
The authors have no conflict of interest with this study. Dr. Andrew Hecht is a consultant for Depuy, Zimmer, Stryker and Medtronic.
Supporting information
Table S1. Summary of processing steps for MMA embedding.
Table S2. Intra‐ and interobserver reliability, shown for the reliability of the total scores by stain.
Table S3. Average Rutges degeneration score of three raters by category.
Acknowledgements
Research reported in this publication was supported by the National Institute of Arthritis and Musculoskeletal and Skin Diseases of the National Institutes of Health under Award Number R01AR057397 and R01AR064157.
References
- Adams MA, Dolan P (2012) Intervertebral disc degeneration: evidence for two distinct phenotypes. J Anat 221, 497–506. [DOI] [PMC free article] [PubMed] [Google Scholar]
- Andersson GB (1999) Epidemiological features of chronic low‐back pain. Lancet 354, 581–585. [DOI] [PubMed] [Google Scholar]
- Erben RG (1997) Embedding of bone samples in methylmethacrylate: an improved method suitable for bone histomorphometry, histochemistry, and immunohistochemistry. J Histochem Cytochem 45, 307–313. [DOI] [PubMed] [Google Scholar]
- Fazzalari NL, Manthey B, Parkinson IH (2001) Intervertebral disc disorganisation and its relationship to age adjusted vertebral body morphometry and vertebral bone architecture. Anat Rec 262, 331–339. [DOI] [PubMed] [Google Scholar]
- Green FJ (1991) The Sigma‐Aldrich Handbook of Stains, Dyes and Indicators. Milwaukee: Aldrich Chemical Company Inc. [Google Scholar]
- Gruber HE, Ingram J, Hanley EN Jr (2002) An improved staining method for intervertebral disc tissue. Biotech Histochem 77, 81–83. [PubMed] [Google Scholar]
- Hansson T, Roos B (1981) The relation between bone mineral content, experimental compression fractures, and disc degeneration in lumbar vertebrae. Spine (Phila Pa 1976), 6, 147–153. [DOI] [PubMed] [Google Scholar]
- Harada A, Okuizumi H, Miyagi N, et al. (1998) Correlation between bone mineral density and intervertebral disc degeneration. Spine (Phila Pa 1976), 23, 857–861; discussion 862. [DOI] [PubMed] [Google Scholar]
- Kim KW, Lim TH, Kim JG, et al. (2003) The origin of chondrocytes in the nucleus pulposus and histologic findings associated with the transition of a notochordal nucleus pulposus to a fibrocartilaginous nucleus pulposus in intact rabbit intervertebral discs. Spine (Phila Pa 1976), 28, 982–990. [DOI] [PubMed] [Google Scholar]
- Landis JR, Koch GG (1977) The measurement of observer agreement for categorical data. Biometrics 33, 159–174. [PubMed] [Google Scholar]
- Laudier D, Schaffler MB, Flatow EL, et al. (2007) Novel procedure for high‐fidelity tendon histology. J Orthop Res 25, 390–395. [DOI] [PubMed] [Google Scholar]
- Leung VY, Chan WC, Hung SC, et al. (2009) Matrix remodeling during intervertebral disc growth and degeneration detected by multichromatic FAST staining. J Histochem Cytochem 57, 249–256. [DOI] [PMC free article] [PubMed] [Google Scholar]
- Lotz JC, Haughton V, Boden SD, et al. (2012) New treatments and imaging strategies in degenerative disease of the intervertebral disks. Radiology 264, 6–19. [DOI] [PubMed] [Google Scholar]
- Lotz JC, Fields AJ, Liebenberg EC (2013) The role of the vertebral end plate in low back pain. Global Spine J 3, 153–164. [DOI] [PMC free article] [PubMed] [Google Scholar]
- Margulies JY, Payzer A, Nyska M, et al. (1996) The relationship between degenerative changes and osteoporosis in the lumbar spine. Clin Orthop Relat Res, 324, 145–152. [DOI] [PubMed] [Google Scholar]
- Mariconda M, Lotti G, Fava R, et al. (2004) Quantitative ultrasound measurements of the calcaneus in the prediction of lumbar spine degeneration. Eur Spine J 13, 346–353. [DOI] [PMC free article] [PubMed] [Google Scholar]
- Mok FP, Samartzis D, Karppinen J, et al. (2010) ISSLS prize winner: prevalence, determinants, and association of Schmorl nodes of the lumbar spine with disc degeneration: a population‐based study of 2449 individuals. Spine (Phila Pa 1976), 35, 1944–1952. [DOI] [PubMed] [Google Scholar]
- Pattappa G, Li Z, Peroglio M, et al. (2012) Diversity of intervertebral disc cells: phenotype and function. J Anat 221, 480–496. [DOI] [PMC free article] [PubMed] [Google Scholar]
- Pollintine P, Dolan P, Tobias JH, et al. (2004) Intervertebral disc degeneration can lead to ‘stress‐shielding’ of the anterior vertebral body: a cause of osteoporotic vertebral fracture? Spine (Phila Pa 1976), 29, 774–782. [DOI] [PubMed] [Google Scholar]
- Roughley PJ (2004) Biology of intervertebral disc aging and degeneration: involvement of the extracellular matrix. Spine 29, 2691–2699. [DOI] [PubMed] [Google Scholar]
- Rutges JP, Duit RA, Kummer JA, et al. (2013) A validated new histological classification for intervertebral disc degeneration. Osteoarthritis Cartilage 21, 2039–2047. [DOI] [PubMed] [Google Scholar]
- Samartzis D, Ito K, Wang JC (2013) Disk degeneration and pain. Global Spine J 3, 125–126. [DOI] [PMC free article] [PubMed] [Google Scholar]
- Simpson EK, Parkinson IH, Manthey B, et al. (2001) Intervertebral disc disorganization is related to trabecular bone architecture in the lumbar spine. J Bone Miner Res 16, 681–687. [DOI] [PubMed] [Google Scholar]
- Stefanakis M, Al‐Abbasi M, Harding I, et al. (2012) Annulus fissures are mechanically and chemically conducive to the ingrowth of nerves and blood vessels. Spine (Phila Pa 1976), 37, 1883–1891. [DOI] [PubMed] [Google Scholar]
- Torgersen JS, Takle H, Andersen O (2009) Localization of mRNAs and proteins in methyl methacrylate‐embedded tissues. J Histochem Cytochem 57, 825–830. [DOI] [PMC free article] [PubMed] [Google Scholar]
- Vos T, Flaxman AD, Naghavi M, et al. (2012) Years lived with disability (YLDs) for 1160 sequelae of 289 diseases and injuries 1990–2010: a systematic analysis for the Global Burden of Disease Study 2010. Lancet 380, 2163–2196. [DOI] [PMC free article] [PubMed] [Google Scholar]
Associated Data
This section collects any data citations, data availability statements, or supplementary materials included in this article.
Supplementary Materials
Table S1. Summary of processing steps for MMA embedding.
Table S2. Intra‐ and interobserver reliability, shown for the reliability of the total scores by stain.
Table S3. Average Rutges degeneration score of three raters by category.