

Abstract
Objective
To investigate the role of an abnormal prostate-specific antigen (PSA) level and abnormal findings on a digital rectal examination (DRE) in the detection of prostate cancer in men in Qatar.
Patients and methods
Between June 2008 and September 2012, 651 patients had a transrectal ultrasonography-guided biopsy of the prostate (TRUSBP) at our centre. The indications for a biopsy were a high PSA level (>4 ng/mL), or an abnormal DRE result. Patients were assessed by a thorough history, clinical examination and routine laboratory investigations. Data, including age, DRE findings, TRUS findings, total PSA level, prostate volume and the pathology results, were evaluated.
Results
The mean (SD) age of the 651 patients was 64.1 (7.4) years. Prostate cancer was detected in 181 men (27.8%), benign prostatic hyperplasia in 275 (42.2%) and prostatitis in 236 (36.4%). The sensitivity and specificity for detecting prostate cancer were 93.9% and 8.5% for an abnormal PSA level (>4 ng/mL), 46.1% and 84.7% for abnormal DRE findings, and 95% and 30.2% for the two combined. Using a receiver operating characteristics curve, a PSA threshold of 7.9 ng/mL had a sensitivity of 56.6% and specificity of 52.8%. When a PSA threshold of 7.9 ng/mL was used in combination with abnormal DRE findings, the overall accuracy was 76.9%.
Conclusion
The PSA threshold level of 7.9 ng/mL, determined by this analysis, has a higher likelihood of detecting prostate cancer in men in Qatar. However, it failed to detect cancer in substantially many men with statistically significant disease.
Abbreviations: TRUSBP, TRUS-guided prostate biopsy; PPV, positive predictive value; NPV, negative predictive value; ROC, receiver operating characteristics (curve)
Keywords: Transrectal ultrasonography, Biopsy, Prostate cancer, PSA
Introduction
Prostate cancer is the most common solid neoplasm in men in Europe and the USA, outnumbering lung and colorectal cancers [1,2]. The factors that determine the risk of developing clinical prostate cancer are not well known, although three well-established risk factors have been identified, i.e., increasing age, ethnicity, and heredity [2]. The disease affects elderly men more often and therefore is a greater health concern in developed countries because of the longer life span [2]. There are large regional differences in the incidence rate of prostate cancer.
The frequency of autopsy-detected prostate cancers is roughly the same in different parts of the world [3,4]. This finding is in sharp contrast with the incidence of clinical cancer, which differs widely among different geographical areas, being high in the USA and Northern Europe and low in south-east Asia [5]. However, in Japanese men living in the USA, their risk of prostate cancer increases and approaches that of American men [6].
These findings indicate that exogenous factors affect the risk of progression from so-called latent disease to clinical cancer. Factors such as food consumption, patterns of sexual behaviour, alcohol consumption, exposure to ultraviolet radiation and occupational exposure have all been discussed as being of aetiological importance [4,7].
TRUS-guided biopsy of the prostate (TRUSBP) is the standard method for diagnosing prostate cancer; it is usually indicated if there is an abnormal level of PSA, abnormal findings on a DRE, or abnormal finding on TRUS when used to assess prostatic enlargement in patients presenting with LUTS.
The predictive value of an abnormal PSA level and/or abnormal DRE findings in the accurate detection of prostate cancer is mainly based on data from the USA and Europe, and might not be relevant to other geographical areas or ethnic groups [8,9]. The aim of the present study was to investigate the role of abnormal PSA levels and abnormal DRE findings in the detection of prostate cancer in men in Qatar.
Patients and methods
In this prospective study, between October 2008 and September 2012, biopsies were taken from 651 men at our centre. The indications for a biopsy were a PSA level of >4 ng/mL (normal, 0–4 ng/mL), or an abnormality on a DRE. All patients were assessed by a thorough history, clinical examination and routine laboratory investigations. None of the patients had current UTIs, clinical prostatitis or a history of previous prostate surgery (TURP or open prostatectomy).
The study was conducted in accordance with the Declaration of Helsinki. All patients signed a fully informed written consent and the study was approved by the local ethics committee.
Data including age, DRE findings, TRUS findings, total PSA level, prostate volume, and pathology results were evaluated. Patients diagnosed as having prostate cancer were further investigated and managed appropriately.
For TRUSBP the patient was placed in the left lateral decubitus position, and after a DRE, local anaesthesia applied using lidocaine hydrochloride 2% sterile gel anaesthetic ointment. A 7.5 MHz transducer was gently advanced into the rectum and 10 mL of lidocaine 1% injected locally at both prostate edges. After obtaining the measurements, an 18-G needle loaded in a spring-action biopsy device was used to obtain the specimens. A 12-core biopsy is the standard at our institution.
At our institute PSA is measured using the Architect i2000SR analyser (Abbott Manufacturing Inc., Texas, USA). The total PSA assay is a two-step immunoassay to determine the presence of total PSA (both free PSA and PSA complexed to α1-antichymotrypsin) in human serum, using a chemiluminescent microparticle immunoassay with flexible assay protocols. This method of measurement was easy to use, accurate, precise and suitable for a routine clinical laboratory [10].
The 12-core TRUSBP specimens were assessed for adequacy and individually stored in different containers, each labelled with the patient’s identification and with a number mapped according to their designated site. The containers were assessed in the histopathology department and examined by a qualified pathologist who reported the findings according to the College of American Pathologists guidelines [11]. If adenocarcinoma was diagnosed, the report usually included the length of each biopsy and the percentage of cancer involvement in each biopsy, the Gleason grade(s) and the extent of any high-grade (Gleason 4 or 5) component, the number of biopsy cores positive for cancer, and their location.
The data are presented as the mean (SD) for continuous variables, and the frequency and percentage for ordinal and nominal variables. The correlation between age and prostate cancer was assessed by a simple linear regression analysis. anova was used to compare continuous values. The diagnostic accuracy of total PSA level, DRE results and the combination of both in the diagnosis of prostate cancer was calculated. Considering TRUSBP as the reference standard for the diagnosis, the calculations included sensitivity, specificity, overall accuracy, positive predictive value (PPV) and negative predictive value (NPV). The optimal threshold value of PSA for detecting cancer was determined from the receiver operating characteristic (ROC) curve.
Results
The study included 651 patients with a mean (SD) age of 64.1 (7.4) years. Table 1 shows the age distribution of the patients stratified into decades of life. The characteristics of the patients are also summarised in Table 1. The major complications (sepsis, shock and gross haematuria) were reported in eight patients (1.3%), whilst there were minor complications in 34 (5.3%; Table 1).
Table 1.
Age distribution, characteristics and complications after TRUSBP of the patients.
| Variable | Value |
|---|---|
| n (%) in age range (years) | |
| <50 | 12 (1.9) |
| 50–59 | 170 (26.1) |
| 60–69 | 311 (47.8) |
| >70 | 158 (24.3) |
| Mean (SD) age (years) | 64.1 (7.4) |
| Indication for TRUSPB, n | |
| Abnormal PSA | 507 |
| Abnormal DRE | 19 |
| Combined | 125 |
| Mean (SD) | |
| Prostate volume (mL) | 65.0 (36.0) |
| Number of cores | 12.1 (1.15) |
| Repeat biopsy, n | 58 |
| Complications after TRUSBP, n (%) | |
| Major | 8 (1.20) |
| Septicaemia | 3 (0.46) |
| Shock | 2 (0.30) |
| Haematuria | 3 (0.46) |
| Minor | 34 (5.2) |
| Fever | 26 (3.99) |
| Haematospermia | 3 (0.46) |
| Rectal bleeding | 5 (0.76) |
Prostate cancer was detected in 180 patients (27.6%), BPH in 275 (42.2%) and prostatitis in 236 (36.4%). Table 2 summarises mean age, prostate volume and PSA level in patients with the three pathologies detected. Patients with cancer had a significantly higher PSA level and were older (P = 0.012). The prostate was significantly larger among patients with prostatitis (P = 0.026).
Table 2.
A comparison of prostate cancer, BPH and prostatitis against means of age, PSA level and prostate volume.
| Mean (SD) variable | Cancer | BPH | Prostatitis | P |
|---|---|---|---|---|
| Age (years) | 65.8 (7.5) | 63.3 (7.4) | 63.2 (7.13) | 0.700 |
| PSA (ng/mL) | 14.1 (12.8) | 9.2 (7.90) | 11.2 (7.30) | 0.012 |
| Prostate volume (mL) | 56.7 (34.3) | 66.7 (35.6) | 76.0 (37.0) | 0.026 |
Using a PSA threshold of >4 ng/mL alone for diagnosing cancer gave a sensitivity of 93.9% and a specificity of 8.5%, an overall accuracy of 32.2%, a PPV of 28.3% and a NPV of 78.4% (Table 3). Using the ROC curve (Fig. 1), a PSA threshold of 7.9 ng/mL gave the best results (Table 3). The results for other tests and their combinations are also given in Table 3. The combination of a PSA level of ⩾7.9 ng/mL with an abnormal DRE gave the highest specificity (87.7%), PPV (67.4%) and overall accuracy (76.9%). The Gleason grading of the cancer specimens was correlated with the proposed PSA threshold (Table 4). Of the 102 patients who had a PSA level of ⩾7.9 ng/mL, 54 (52%) had clinically significant cancer (Gleason grade ⩾7). However, 21 (26%) of 78 patients who had a PSA level of <7.9 ng/mL also had clinically significant cancer.
Table 3.
Diagnostic accuracy of PSA levels and DRE findings, separately and combined.
| Category | Biopsy, n |
Total | % |
|||||
|---|---|---|---|---|---|---|---|---|
| Positive | Negative | Sensitivity | Specificity | PPV | NPV | Accuracy | ||
| PSA level (ng/mL) | ||||||||
| ⩾4 | 169 | 431 | 600 | 93.9 | 8.5 | 28.3 | 78.4 | 32.2 |
| <4 | 11 | 40 | 51 | |||||
| PSA threshold of 7.9 ng/mL | ||||||||
| ⩾7.9 | 102 | 249 | 351 | 56.9 | 47.2 | 29.3 | 74.0 | 49.7 |
| <7.9 | 78 | 222 | 300 | |||||
| DRE | ||||||||
| Abnormal | 83 | 72 | 155 | 46.1 | 84.7 | 53.5 | 80.4 | 74.0 |
| Normal | 97 | 399 | 496 | |||||
| Combined (156 patients) | ||||||||
| PSA>4 ng/mL + abnormal DRE | 76 | 53 | 129 | 95.0 | 30.2 | 58.9 | 85.1 | 63.4 |
| PSA < 4 ng/mL + normal DRE | 4 | 23 | 27 | |||||
| Combined, PSA > 7.9 ng/mL (326 patients) | ||||||||
| >7.9 + abnormal DRE | 56 | 27 | 83 | 53.8 | 87.8 | 67.4 | 80.2 | 76.9 |
| <7.9 + normal DRE | 48 | 195 | 243 | |||||
Figure 1.
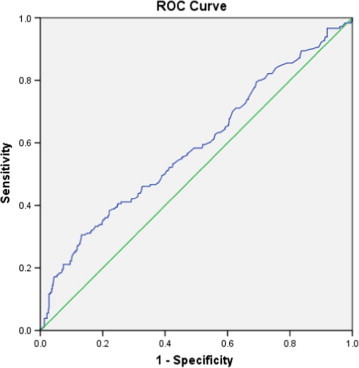
ROC curve for total PSA level against the incidence of prostate cancer. The area under the curve was 0.638.
Table 4.
Relationship between Gleason score and PSA level (threshold 7.9 ng/mL).
| Gleason score |
n with PSA level (ng/mL) |
|
|---|---|---|
| <7.9 | ⩾7.9 | |
| 2–6 | 57 | 48 |
| 7 | 16 | 20 |
| 8–10 | 5 | 34 |
| Total | 78 | 102 |
| P | <0.001 | |
Discussion
In the present study the mean (SD) age of the patients diagnosed with cancer was 65.8 (7.8) years, a value that is consistent with internationally reported ages, showing a median of 68 years in the USA [12] and 69 years in Australia [13]. In the present study, statistical analysis showed that using a PSA threshold of 4 ng/mL resulted in a sensitivity and specificity for diagnosing prostate cancer of 93.9% and 8.5%. However, from the ROC curve, a PSA threshold of 7.9 ng/mL was associated with the highest specificity (47.3%), with a sensitivity of 56.9%.
The incidence of prostate cancer varies throughout the world, with the highest rates reported in North America and Europe, and the lowest rates reported in south–east and central Asia [14]. Several potential risk factors have been identified for the development of prostate cancer. A higher risk was associated with obesity [15], and with the consumption of diets rich in saturated fat [16] and red meat [17]. Smoking was associated with more aggressive disease and with higher prostate cancer-related mortality rates [18]. Although prostate cancer can occur sporadically, it has a strong familial and hereditary predisposition. Zeegers et al. [18] showed that the relative risk increases according to the number of affected family members, their degree of relatedness, and the age at which they were affected.
Since its first description by Weaver et al. in 1991 [19], TRUSBP has become a standard technique for diagnosing prostate cancer. The diagnostic yield of TRUSBP has been studied thoroughly, and its sensitivity in cancer detection depends on the population being studied, at 20–35% with sextant biopsies [20], with an increase of up to 35% when 10 or 12 cores are taken [21,22]. The present study showed that cancer was detected in 27.6% of the men with a 12-core biopsy, a rate consistent with internationally reported values. TRUSBP is not without risks, as it is an invasive procedure that is associated with several minor and major complications [23]. In the present study the reported major complications were septicaemia, septic shock and gross haematuria, in 1.2%, and minor complications such as fever, haematospermia and minimal rectal bleeding in 5.2% of men undergoing TRUSBP. Therefore, the search for a marker with the highest sensitivity and specificity to indicate TRUSBP is warranted.
The diagnostic accuracy of an abnormal PSA level and of the DRE in screening for prostate cancer were evaluated in a meta-analysis by Mistry et al. [24]. The sensitivity of the PSA level, taking >4 ng/mL as an abnormal value, in detecting prostate carcinoma was 72.1% (66.7–100%) and the specificity was 93.2% (63.1–100%). The sensitivity of a DRE for detecting prostate carcinoma was 53.2% (49–69.2%) and the specificity was 83.6% (18–99.5%). An abnormal PSA level (>4 ng/mL) in the present men was more sensitive (93.9%) but less specific (8.5%) for detecting cancer than in previous published series, whilst the values for an abnormal DRE were almost consistent with the published results, with a sensitivity of 46.1% and a specificity of 84.7%. Combining the PSA level and DRE was more effective in screening for cancer than either alone [25,26]. The sensitivity and specificity of PSA level, a DRE, and PSA + DRE, as reported by Crawford et al. [26] were 34.1% and 63.1%, 27.1% and 20.8%, and 38% and 87.1%, respectively. Catalona et al. [25] found a cancer detection rate of 3.2% for the DRE, 4.6% for PSA level and 5.8% for the two methods combined. The present results also showed an improvement in the sensitivity when both tests were combined (95%), with a specificity of 30.2%. However, when a PSA threshold of 7.9 ng/mL was used, the combination of an abnormal PSA level and abnormal DRE yielded the highest results in terms of specificity (87.7%), PPV (67.4%) and overall accuracy (76.9%).
The reasons underlying the higher threshold PSA value in the present study are not clear but they might be attributable to histological prostatitis or to racial influences. It is well known that PSA is prostate-specific but not cancer-specific, with conditions like prostatitis affecting the level. In the present study, the incidence of histological prostatitis was 36.4%, a considerable rate although not the highest reported. Evidence of chronic histological inflammation was reported in >78% of men who underwent TRUSBP in the REDUCE trial [27]. However, previous studies have shown racial differences in the mean PSA level, with that by Abdulla et al. [28] reporting a higher mean serum PSA level in African-American men (21.6 ng/mL) than in white men (mean 10.96 ng/mL) and Hispanic men (mean 8.25 ng/mL).
Using a higher PSA threshold is not without implications and should be addressed with caution. The European Association of Urology Guidelines clearly state that clinically significant prostate cancer can be present even with low PSA levels [2]. There is a trend for investigators to use a lower PSA threshold because some men with levels of <4 ng/mL and a normal DRE are still found to have cancer [29,30]. In a subset analysis from the placebo arm of the Prostate Cancer Prevention Trial, 449 of 2950 men (15.2%) aged 62–91 years, who had consistently normal PSA levels and a normal DRE for 7 years of annual screening, had prostate cancer present in an end-of-study biopsy, with 67 (2.3%) of them having high-grade disease (Gleason score ⩾7) [31]. The present data suggest that although a PSA threshold of 7.9 ng/mL improved the cancer detection rate, 78 (26%) of the 300 patients who had a PSA level of <7.9 ng/mL had prostate cancer (Table 3). As expected, there was a higher incidence of a high-grade Gleason score when the PSA level was ⩾7.9 ng/mL. However, the data also showed that 26% of patients with a PSA level of <7.9 ng/mL had a Gleason score of ⩾7.
The present study has the advantage of being prospective, analysing a homogeneous group of patients from one community. The sample size was sufficient to be a good representation of the population. Qatar is a small country, with a population of 1.87 million. Despite that, they are very diverse in their ethnic and racial backgrounds. Not taking account of the racial influences on the PSA level could be considered a limitation to this study. Another limitation that should be addressed in future studies is to determine why the optimum PSA threshold is higher in this community.
In conclusion, the ROC curve showed that a PSA threshold of 7.9 ng/mL was associated with a higher cancer detection rate in men in Qatar. This value differs from those reported internationally, which could be attributable to prostatitis or to racial influences in our community. Despite that, significantly many patients who had a PSA level of <7.9 ng/mL still had prostate cancer. Hence, this study supports the need for other diagnostic tests to help in solving this dilemma.
Conflict of interest
None.
Source of Funding
None.
Footnotes
Peer review under responsibility of Arab Association of Urology.

Editorial comment: A study by Rumaihi et al. [32] reported in this issue set out to investigate how an abnormal PSA level and DRE findings were used to detect prostate cancer in a group of 651 men referred to their centre and who had a 12-core TRUS-guided biopsy of the prostate (TRUSBP), based on an abnormal PSA level (>4 ng/mL) or an abnormal DRE. The biopsy findings were cancer in 27.6%, BPH in 42.2% and prostatitis in 36.4%. The investigators then set out to study the capability of total PSA level, a DRE and combinations of both for detecting prostate cancer, and calculating the sensitivity, specificity, positive predictive value, negative predictive value and overall accuracy for each measurement. They also analysed the receiver operator characteristic curves of different PSA levels, finding that a value of 7.9 ng/mL should prompt a biopsy, rather than the ‘normal’ level of 4 ng/mL, and gave the ‘best results’ from a statistical perspective view. Indeed, using the higher rather than the lower value to justify TRUSBP resulted in almost 50% accuracy compared to 32.2% with a PSA level of 4 ng/mL. Combining an abnormal DRE with the two PSA thresholds gave an accuracy of 63.4% for a PSA level of 4 ng/mL, which could be improved to 76.9% using the higher value. The higher threshold was initially accepted as statistically superior; consideration that it might be related to higher levels of prostatitis found in men referred to them was discussed and then they became aware of failing to detect prostate cancers by using the higher PSA value to prompt TRUSBP. Certainly, 78 such cases (43% of all their detected cancers) would have been missed by using a threshold PSA level of 7.9 ng/mL to justify TRUSBP! When these cases were analysed by Gleason score, it was found that 27% had scores of ⩾7. Thus, despite the statistical superiority of using the higher PSA value to initiate TRUSBP, the clinical effect made little sense. Why would you want to not detect 43% of the cancers, particularly when a quarter of those missed were aggressive cases? The authors concluded appropriately that their ‘study supports the need for other diagnostic tests to help in solving this dilemma’. This has always been the case with the use of PSA and PSA derivatives for detecting prostate cancer.
References
- 1.Jemal A., Siegel R., Ward E., Hao Y., Xu J., Murray T. Cancer statistics, 2008. CA Cancer J Clin. 2008;58:71–96. doi: 10.3322/CA.2007.0010. [DOI] [PubMed] [Google Scholar]
- 2.Heidenreich APJ, Bastian J, Bellmunt M, Bolla S, Joniau MD, Mason V, et al. The updated EAU Guidelines on Prostate Cancer. 2012. Available at <http://www.uroweb.org/gls/pdf/08%20Prostate%20Cancer_LR%20March%2013th%202012.pdf>.
- 3.Breslow N., Chan C.W., Dhom G., Drury R.A., Franks L.M., Gellei B. Latent carcinoma of prostate at autopsy in seven areas. The International agency for research on cancer, Lyons, France. Int J Cancer. 1977;15:680–688. doi: 10.1002/ijc.2910200506. [DOI] [PubMed] [Google Scholar]
- 4.Heidenreich AP, Aus G, Abbou CC, Bolla M, Joniau S, Matveev V, et al. Guidelines on Prostate Cancer. European Association of Urology 2007: 7–9 Available at <http://www.uroweb.org/fileadmin/user_upload/Guidelines/Prostate%20Cancer.pdf>.
- 5.Quinn M., Babb P. Patterns and trends in prostate cancer incidence, survival, prevalence and mortality. Part I. International comparisons. BJU Int. 2002;90:162–173. doi: 10.1046/j.1464-410x.2002.2822.x. [DOI] [PubMed] [Google Scholar]
- 6.Zaridze D.G., Boyle P., Smans M. International trends in prostatic cancer. Int J Cancer. 1984;15:223–230. doi: 10.1002/ijc.2910330210. [DOI] [PubMed] [Google Scholar]
- 7.Kolonel L.N. Fat, meat, and prostate cancer. Epidemiol Rev. 2001;23:72–81. doi: 10.1093/oxfordjournals.epirev.a000798. [DOI] [PubMed] [Google Scholar]
- 8.Moslemi M.K., Lotfi F., Tahvildar S.A. Evaluation of prostate cancer prevalence in Iranian male population with increased PSA level, a one center experience. Cancer Manag Res. 2011;3:227–231. doi: 10.2147/CMR.S18147. [DOI] [PMC free article] [PubMed] [Google Scholar]
- 9.Dadkhah F., Safarinejad M.R., Amini E., Lashay A.R., Baghayee A. Utility of prostate specific antigen density and free to total prostate specific antigen ratio for detecting prostate cancer in Iranian men: a prospective study of 187 cases. Curr Urol. 2010;4:1–5. [Google Scholar]
- 10.Berlitz FA, Ghanem Filho OA, Masson G, Santos J, Pfutzenreuter H, Ganske R. Method for evaluation of total PSA immunoassay on the Architect i2000sr. AACC Annual, Meeting Abstracts 2012: C-02.
- 11.van der Kwast Th.H., Lopes C., Santonja C., Pihl C.-G., Neetens I., Martikainen P. Guidelines for processing and reporting of prostatic needle biopsies. J Clin Pathol. 2003;56:336–340. doi: 10.1136/jcp.56.5.336. [DOI] [PMC free article] [PubMed] [Google Scholar]
- 12.Ries LA, Melbert D, Krapcho M, et al. SEER Cancer Statistics Review, 1975–2004. National Cancer Institute, Bethesda, MD, based on November 2006 SEER data submission, posted to the SEER web site 2007. <http://seer.cancer.gov/csr/1975_2005/>.
- 13.AIHW (Australian Institute of Health and Welfare) & AACR (Australasian Association of Cancer Registries) 2007. Cancer in Australia: an overview, 2006. Cancer series no. 37 Cat. no. CAN 32, Canberra, AIHW.
- 14.American Cancer Society . American Cancer Society; Atlanta: 2010. Cancer Facts & Figures. [Google Scholar]
- 15.MacInnis R.J., English D.R. Body size and composition and prostate cancer risk: systematic review and meta-regression analysis. Cancer Causes Control. 2006;17:989–1003. doi: 10.1007/s10552-006-0049-z. [DOI] [PubMed] [Google Scholar]
- 16.Wright M.E., Bowen P., Virtamo J., Albanes D., Gann P.H. Estimated phytanic acid intake and prostate cancer risk: a prospective cohort study. Int J Cancer. 2012;131:1396–1406. doi: 10.1002/ijc.27372. [DOI] [PMC free article] [PubMed] [Google Scholar]
- 17.Bostwick D.G., Burke H.B., Djakiew D., Euling S., Ho S.M., Landolph J. Human prostate cancer risk factors. Cancer. 2004;101:2371–2490. doi: 10.1002/cncr.20408. [DOI] [PubMed] [Google Scholar]
- 18.Zeegers J.A., Ostrer H. Empiric risk of prostate carcinoma for relatives of patients with prostate carcinoma: a metaanalysis. Cancer. 2003;97:1894–1903. doi: 10.1002/cncr.11262. [DOI] [PubMed] [Google Scholar]
- 19.Weaver R.P., Noble M.J., Weigle J.W. Correlation of ultrasound guided and digitally directed transrectal biopsies of palpable prostatic abnormalities. J Urol. 1991;145:516–518. doi: 10.1016/s0022-5347(17)38384-2. [DOI] [PubMed] [Google Scholar]
- 20.Hodge K.K., McNeal J.E., Terris M.K., Stamey T.A. Random systematic versus directed ultrasound guided transrectal core biopsies of the prostate. J Urol. 1989;142:71–74. doi: 10.1016/s0022-5347(17)38664-0. [DOI] [PubMed] [Google Scholar]
- 21.Gore J.L., Shariat S.F., Miles B.J., Kadmon D., Jiang N., Wheeler T.M. Optimal combinations of systematic sextant and laterally directed biopsies for the detection of prostate cancer. J Urol. 2001;165:1554–1559. [PubMed] [Google Scholar]
- 22.Eskew L.A., Bare R.L., McCullough D.L. Systematic 5 region prostate biopsy is superior to sextant method for diagnosing carcinoma of the prostate. J Urol. 1997;157:199–202. [PubMed] [Google Scholar]
- 23.Rodríguez L.V., Terris M.K. Risks and complications of transrectal ultrasound guided prostate needle biopsy: a prospective study and review of the literature. J Urol. 1998;160:2115–2120. doi: 10.1097/00005392-199812010-00045. [DOI] [PubMed] [Google Scholar]
- 24.Mistry K., Cable G. Meta-analysis of prostate-specific antigen and digital rectal examination as screening tests for prostate carcinoma. J Am Board Fam Pract. 2003;16:95–101. doi: 10.3122/jabfm.16.2.95. [DOI] [PubMed] [Google Scholar]
- 25.Catalona W.J., Richie J.P., Ahmann F.R., Hudson M.A., Scardino P.T., Flanigan R.C. Comparison of digital rectal examination and serum prostate specific antigen in the early detection of prostate cancer: results of a multicenter clinical trial of 6,630 men. J Urol. 1994;151:1283–1290. doi: 10.1016/s0022-5347(17)35233-3. [DOI] [PubMed] [Google Scholar]
- 26.Crawford E.D., Leewansangtong S., Goktas S., Holthaus K., Baier M. Efficiency of prostate-specific antigen and digital rectal examination in screening, using 4.0 ng/ml and age-specific reference range as a cutoff for abnormal values. Prostate. 1999;38:296–302. doi: 10.1002/(sici)1097-0045(19990301)38:4<296::aid-pros5>3.0.co;2-p. [DOI] [PubMed] [Google Scholar]
- 27.Nickel J.C., Roehrborn C.G., O’Leary M.P., Bostwick D.G., Somerville M.C., Rittmaster R.S. Examination of the relationship between symptoms of prostatitis and histologic inflammation: baseline data from the REDUCE chemoprevention trial. J Urol. 2007;178:896–900. doi: 10.1016/j.juro.2007.05.041. [DOI] [PubMed] [Google Scholar]
- 28.Abdalla I., Ray P., Vaida F., Vijayakumar S. Racial differences in prostate-specific antigen levels and prostate-specific antigen densities in patients with prostate cancer. Am J Clin Oncol. 1999;22:537–541. doi: 10.1097/00000421-199912000-00001. [DOI] [PubMed] [Google Scholar]
- 29.Catalona W.J., Smith D.S., Ornstein D.K. Prostate cancer detection in men with serum PSA concentrations of 2.6–4.0 ng/mL and benign prostate examination. Enhancement of specificity with free PSA measurements. JAMA. 1997;277:1452. [PubMed] [Google Scholar]
- 30.Babaian R.J., Johnston D.A., Naccarato W., Ayala A., Bhadkamkar V.A., Fritsche H.A., Jr. The incidence of prostate cancer in a screening population with a serum prostate specific antigen between 2.5 and 4.0 ng/ml: relation to biopsy strategy. J Urol. 2001;165:757. [PubMed] [Google Scholar]
- 31.Thompson I.M., Pauler D.K., Goodman P.J., Tangen C.M., Lucia M.S., Parnes H.L. Prevalence of prostate cancer among men with a prostate-specific antigen level < or ⩾4.0 ng per milliliter. N Engl J Med. 2004;350:2239–2246. doi: 10.1056/NEJMoa031918. [DOI] [PubMed] [Google Scholar]
- 32.Al Rumaihi K., Al Jalham K., Younes N., Majzoub A.A., Shokeir A.A. The role of an abnormal prostate-specific antigen level and an abnormal digital rectal examination in the diagnosis of prostate cancer: a cross-sectional study in Qatar. Arab. J. Urol. 2013 doi: 10.1016/j.aju.2013.08.014. [DOI] [PMC free article] [PubMed] [Google Scholar]