

Abstract
Aims: To study the relationship between thioredoxin-interacting protein (TXNIP) and pancreatic β-cell function in patients with impaired glucose regulation and patients with both impaired glucose regulation and hypertriglyceridemia. Methods: We analyzed a population of 90 patients with impaired glucose regulation (IGR), 87 patients with IGR and hypertriglyceridemia, and 90 subjects with normal glucose tolerance (NGT). The levels of plasma TXNIP, a regulator of cellular oxidative stress, were measured. The homeostasis model assessment for insulin resistance (HOMA-IR) was used to evaluate insulin resistance in all subjects. In addition, two factors (HOMA for β-cell function [HOMA-β]) and first-phase insulin response [FPIR]) were used to evaluate pancreatic β-cell function. The correlations between the plasma levels of TXNIP, insulin resistance, and islet β-cell dysfunction were analyzed using Pearson’s correlation analysis. Results: Compared with NGT, patients with IGR had significantly lower HOMA-β and FPIR, and higher plasma levels of TXNIP. Compared with the IGR group, patients with both IGR and hypertriglyceridemia had significantly lower HOMA-β and FPIR, and higher plasma levels of TXNIP. There was also a negative correlation between TXNIP and HOMA-β or FPIR, and a positive correlation between TXNIP and HOMA-IR. Conclusions: These data showed that the level of TXNIP is increased in patients with IGR and patients with both IGR and hypertriglyceridemia, islet β-cell dysfunction was related to the increased TXNIP in IGR patients.
Keywords: Impaired glucose regulation, hypertriglyceridemia, β-cell dysfunction, TXNIP
Introduction
Type 2 diabetes (T2D) is caused by a progression from normal glucose tolerance (NGT) to impaired glucose regulation (IGR) and then diabetes, which is characterized by insulin resistance and β-cell dysfunction. The term “IGR”, also known as non-diabetic hyperglycemia or prediabetes, describes an intermediate condition where fasting and/or 2 h postprandial plasma glucose levels are above the highest normal value, but below the cut-off levels used to diagnose diabetes [1]. Previous studies showed that chronic glucose excess exerts toxic effects on the structure and function of many organs, particularly pancreatic islets [2]. In diabetes, β-cells deteriorate steadily with hyperglycemia worsens, secreting reducing amounts of insulin and gradually losing their function. Hypertriglyceridemia is a prominent feature of dyslipidemia in patients with IGR and T2D [3]. The chronic elevation of glucose (hyperglycemia) and lipids (hyperlipidemia), particularly when hyperglycemia and hyperlipidemia co-occur, are thought to play a role in β-cell failure [4].
Elevated concentrations of glucose and free fatty acids can lead to oxidative stress, which has been shown to be responsible for the progression of T2D [5]. Thioredoxin (TRX) is one of the most important members of the thiol-disulfide oxidoreductase family, which is a cytoprotective antioxidant. Thioredoxin- interacting protein (TXNIP) mediates oxidative stress by inhibiting thioredoxin activity [6]. Recent studies demonstrated that the induction of TXNIP plays a critical role in β-cell glucose toxicity and apoptosis [7]. The expression of TXNIP is increased significantly in pancreatic β-cells, as well as in human and murine pancreatic islets exposed to high levels of glucose [8]. Paradoxically, free fatty acids can inhibit the transcription of TXNIP, and therefore could be considered to be protective factors [9].
The aim of the present study was to examine the relationship between islet β-cell function and oxidative stress (TXNIP) in patients with NGT, IGR, and IGR with HTG to understand the effect of glucose and lipid disorders on islet β-cell function in patients with pre-diabetes.
Subjects and methods
Subjects
The study was performed in 87 patients with impaired glucose tolerance (IGT) with combined HTG (IGT + HTG), 90 IGR patients without hypertriglyceridemia, and 90 subjects with NGT without HTG who were enrolled from the Endocrine outpatient clinic and Emergency room of Cangzhou Central Hospital and Hebei General Hospital, China. IGR was diagnosed based on the revised World Health Organization (WHO) consulting group criteria [1]. NGT subjects had a fasting plasma glucose (FPG) < 6.1 mmol/L, and a 2 h postprandial glucose (PG) < 7.8 mmol/L. Of the 90 subjects with IGR, 50 had IGT with an FPG < 6.1 mmol/L and 7.8 ≤ 2 h PG < 11.1 mmol/L, and 40 exhibited impaired fasting glucose (IFG) and IGT, with 6.1 ≤ FPG < 7.0 mmol/L and 7.8 ≤ 2 h PG < 11.1 mmol/L. Eighty-seven subjects with IGR + HTG were enrolled, including 48 subjects with IGT, and 39 with IFG + IGT. The diagnosis of HTG was made according to NECP ATPШ criteria [10]; therefore triglycerides (TG) > 2.3 mmol/L were defined as HTG. All subjects were selected randomly. The enrollment criterion for subjects with NGT was no family history of diabetes in their first-degree relatives. The enrollment criteria of all subjects were aged > 20 years, a body mass index (BMI) < 35 kg/m2, and no history of receiving pharmacological agents for the treatment of hyperlipidemia or hypertension. Patients with clinically significant neurological, endocrinological, or other systemic diseases, as well as acute illness or chronic inflammatory or infective diseases were excluded from the study.
All subjects enrolled in the present study were of Chinese ethnicity. The Ethics Committee of Cangzhou Central Hospital and Hebei General Hospital approved the study protocol, and written informed consent to participate in the study was obtained from all subjects.
Methods
Anthropometric measurements
Anthropometric measurements including weight, height, and blood pressure (BP) were recorded after overnight fasting. BMI was calculated as weight (in kilograms) divided by height (in meters) squared.
Biochemical parameters
A 2 h OGTT (oral glucose tolerance test) using 75 g glucose was measured in all subjects after an overnight fast. Fasting and 2 h blood samples were taken from the cubital vein. FPG, 2 h PG, serum TG, total cholesterol (TC), high-density lipoprotein cholesterol (HDL-C), and low-density lipoprotein cholesterol (LDL-C) were analyzed using a Hitachi-7600 automatic biochemistry analyzer (Hitachi Co, Tokyo, Japan), and HbA1c was measured using high-performance liquid chromatography (Arkray Inc, Kyoto, Japan). Plasma FFAs were measured using standard colorimetric methods supplied with a commercial kit (Roche Diagnostics, Mannheim, Germany).
Plasma TXNIP concentrations were determined using enzyme immunoassay (EIA) kits (MBL Co. Ltd., Japan) according to manufacturer’s protocol. Briefly, plasma samples and standards were incubated in 96-well microtiter plates. After washing, horseradish peroxidase (HRP)-conjugated antibodies were added, and the plates were incubated for 1.5 hours at 25°C. Plates were then washed, and TMB (3,3’,5,5’-tetramethylbenzidine) substrate was added. The color development was stopped after 20 min, and the optical density was measured at 450 nm. The amount of TXNIP in each sample was calculated according to a standard curve constructed using known levels of TXNIP. The sensitivity of the assay was 9.41 pg/mL. The intra- and inter-assay coefficients of variation were within 10%.
Intravenous glucose tolerance test
An intravenous glucose tolerance test (IVGTT) was performed after a 12-h fast. Briefly, an intravenous catheter was placed in the antecubital vein, and an intravenous bolus of 0.3 g glucose/kg body weight as a 50% water solution was injected into the contralateral antecubital vein within 60 sec. Additional samples for blood glucose and plasma insulin measurements were harvested at 0, 3, 5, 8, and 10 min. Plasma insulin was measured using an electrochemiluminescence immunoassay kit (Roche Diagnostics).
The homeostasis model assessment for insulin resistance (HOMA-IR; FPG [mmol/l] × FPI (Fasting insulin, which was measured using an electrochemiluminescence immunoassay kit [Roche Diagnostics]) [mU/L] 22.5) was used to evaluate IR [11]. In addition, two indices were used for to evaluate pancreatic β-cell secretion function [12,13]: (1) homeostasis model assessment for β-cell function (HOMA-β; 20 × FPI (mU/L)/FPG [mmol/L] -3.5), and (2) first-phase insulin response (FPIR), which was assessed according to the mean insulin secretion rate during the first 10 min after the glucose bolus was subtracted from the basal insulin secretion rates.
Statistical analysis
Continuous data are expressed as means ± S.D. All analyses were performed using SPSS13.0. The distributions of quantitative variables were subjected to normality testing and, if necessary, log transformation was used to obtain a normal distribution. Comparisons between the groups of three means were performed using one-way ANOVA followed by Tukey’s multiple comparison procedure with P < 0.05 as the criterion for significance. Pearson’s correlation analysis was used to determine the relationship between continuous variables within each of the three study groups.
Results
Clinical and biochemical features of the study subjects
The physical and clinical characteristics of subjects with NGT (n = 90), subjects with IGR (n = 90), and those with IGR + HTG (n = 87) are shown in Table 1. No differences were observed in the anthropometric parameters, including gender distribution, age, BMI, TC, LDL-C, HDL-C, and systolic and diastolic BP among groups. FPG, 2 h-PG, HbA1c, FPI, and HOMA-IR were all significantly higher in the IGR and IGR + HTG groups compared with the NGT group (P < 0.01 or P < 0.05), but there were no significant differences between the IGR and IGR + HTG groups. TG and FFA levels were highest in patients with IGR + HTG, and lowest in those with NGT (P < 0.01 or P < 0.05). Conversely, FPIR and HOMA-β were lowest in patients with IGR + HTG, and highest in those with NGT (P < 0.01 or P < 0.05).
Table 1.
Clinical characteristics of the study subjects
| Variable | NGT | IGR | IGR + HTG |
|---|---|---|---|
| Gender (M/F) | 44/46 | 47/43 | 45/42 |
| Age (years) | 48.3 ± 12.23 | 51.1 ± 11.75 | 50.8 ± 13.34 |
| BMI (kg/m2) | 21.5 ± 2.01 | 21.7 ± 3.72 | 22.4 ± 2.93 |
| SBP (mmHg) | 114.3 ± 12.1 | 118.7 ± 18.2 | 120.4 ± 17.73 |
| DBP (mmHg) | 75.2 ± 7.3 | 77.4 ± 7.9 | 76.7 ± 10.9 |
| HbA1c (%) | 5.41 ± 0.37 | 5.82 ± 0.64* | 5.84 ± 0.59* |
| FPG (mmol/L) | 5.10 ± 0.24 | 6.06 ± 0.41* | 6.32 ± 0.57** |
| 2h-PG (mmol/L) | 5.87 ± 1.32 | 8.14 ± 1.75* | 8.32 ± 1.81** |
| FPI (mU/L) | 8.45 ± 1.87 | 12.33 ± 2.09* | 12.12 ± 1.36** |
| TG (mmol/L) | 1.37 ± 0.24 | 1.41 ± 0.27 | 3.25 ± 0.52**,## |
| TC (mmol/L) | 4.10 ± 0.53 | 4.23 ± 0.70 | 4.31 ± 0.83 |
| LDL-C (mmol/L) | 2.33 ± 0.21 | 2.41 ± 0.37 | 2.44 ± 0.52 |
| HDL-C (mmol/L) | 1.52 ± 0.39 | 1.28 ± 0.36 | 1.20 ± 0.41 |
| FFA | 0.56 ± 0.08 | 0.60 ± 0.12 | 0.93 ± 0.18**,## |
| HOMA-IR | 1.95 ± 0.67 | 3.46 ± 1.09* | 3.48 ± 1.15** |
| HOMA-β | 109 ± 41.5 | 97.3 ± 38.7* | 83.2 ± 36.9**,# |
| FPIR (mU/L) | 57.6 ± 7.43 | 40.3 ± 4.11* | 33.8 ± 3.98**,# |
Values are expressed as means ± SDs.
P < 0.05;
P < 0.01 vs. subjects with NGT;
P < 0.05;
P < 0.01 vs. subjects with IGR.
BMI, body mass index; SBP, systolic blood pressure; DBP, diastolic blood pressure; HbA1c, hemoglobin A1c; FPG, fasting plasma glucose; 2 h PG, 2 h postprandial glucose level in an OGTT; FPI, fasting plasma insulin; TG, triglyceride; TC, total cholesterol; LDL-C, low density lipoprotein cholesterol; HDL-C, high density lipoprotein cholesterol; FFA, free fatty acids; FPIR, first-phase insulin response.
The mean plasma levels of TXNIP were highest in patients with IGR + HTG, and lowest in those with NGT. The differences were statistically significant between NGT with IGR or IGR + HTG (P < 0.05 and P < 0.01, respectively), as well as between the IGR and IGR + HTG groups (P < 0.05; Figure 1).
Figure 1.
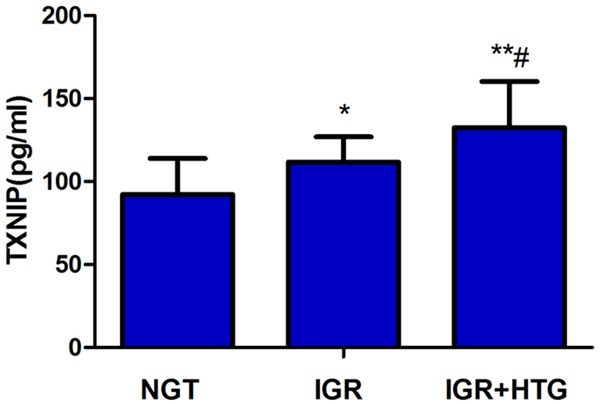
The comparison of plasma TXNIP levels in three groups. The mean plasma levels of TXNIP were significantly increased in patients with IGR + HTG, compared with NGT and IGR, **P < 0.01, *P < 0.05; as well as between the IGR and NGT groups #P < 0.05.
Correlations between islet function and various parameters
Next, we assessed whether the levels of TXNIP correlated with β-cell function in the test subjects. We performed Pearson’s linear correlation analysis between HOMA-β, FPIR and the various parameters examined. Among the subjects with IGR, HOMA-β showed a negative correlation with FPG (r = -0.227, P = 0.038), HbA1c (r = -0.342, P = 0.029), TXNIP (r = -0.482, P = 0.014) and positive correlation with FPI (r = 0.228, P = 0.037); FPIR showed a negative correlation with 2h-PG (r = -0.342, P = 0.029), HbA1c (r = -0.355, P = 0.028), TXNIP (r = -0.493, P = 0.013). Among the subjects with IGR + HTG, HOMA-β showed a negative correlation with FPG (r = -0.231, P = 0.037), HbA1c (r = -0.301, P = 0.030), FFA (r = -0.427, P = 0.016), TG (r = -0.402, P = 0.018), TXNIP (r = -0.545, P = 0.008) and positive correlation with FPI (r = 0.301, P = 0.030). FPIP showed a negative correlation with 2h-PG (r = -0.385, P = 0.026), HbA1c (r = -0.382, P = 0.026), FFA (r = -0.389, P = 0.026), TG (r = -0.393, P = 0.024) and TXNIP (r = -0.558, P = 0.005) (Table 2).
Table 2.
Correlations between HOMA-β, FPIR and clinical parameters
| Variable | HOMA-β | FPIR | ||||
|---|---|---|---|---|---|---|
|
| ||||||
| NGT | IGR | IGR + HTG | NGT | IGR | IGR + HTG | |
| Age (years) | 0.025 | 0.032 | 0.037 | 0.091 | 0.104 | 0.122 |
| BMI (kg/m2) | 0.019 | 0.027 | 0.010 | 0.021 | 0.100 | 0.103 |
| SBP (mmHg) | 0.035 | 0.105 | 0.114 | 0.023 | 0.081 | 0.093 |
| DBP (mmHg) | 0.017 | 0.021 | 0.102 | 0.018 | 0.016 | 0.021 |
| HbA1c (%) | 0.021 | -0.342* | -0.301* | 0.010 | -0.355* | -0.382* |
| FPG (mmol/L) | 0.008 | -0.227* | -0.231* | 0.008 | 0.106 | 0.101 |
| 2h-PG (mmol/L) | 0.125 | 0.121 | 0.133 | 0.125 | -0.342* | -0.385* |
| FPI (mU/L) | 0.102 | 0.228* | 0.301* | 0.100 | 0.104 | 0.103 |
| FFA (mmol/L) | 0.060 | 0.127 | -0.427* | 0.045 | 0.109 | -0.389* |
| TG (mmol/L) | 0.030 | 0.153 | -0.402* | 0.031 | 0.121 | -0.393* |
| TC (mmol/L) | 0.021 | 0.025 | 0.122 | 0.019 | 0.042 | 0.009 |
| LDL-C (mmol/L) | 0.058 | 0.131 | 0.163 | 0.103 | 0.049 | 0.112 |
| HDL-C (mmol/L) | 0.041 | 0.008 | 0.151 | 0.031 | 0.019 | 0.134 |
| TXNIP (pg/mL) | -0.120 | -0.482* | -0.545** | -0.120 | -0.493* | -0.558** |
P < 0.05;
P < 0.01.
Discussion
In this study, we assessed the relationship between pancreatic islet β-cell function and oxidative stress (TXNIP levels) in patients with NGT, IGR, and IGR with HTG. Compared with NGT subjects, patients with IGR exhibited higher levels of TXNIP, and impaired islet β-cell function. Importantly, patients with both IGR and HTG had significantly higher levels of TXNIP and reduced islet β-cell function than patients with IGR, but without HTG.
Previous studies reported that β-cell function is reduced by 50% in patients diagnosed with T2D according to the UKPDS. Therefore, the loss of β-cell function begins 10-12 years before diagnosis with T2D [14]. The impaired β-cell function in these patients with IGR leads to a pronounced defect in early insulin secretion [15]. HTG is a prominent feature of dyslipidemia during both IGR and T2D. Hypertriglyceridemia results in elevated plasma FFAs after TG hydrolysis, which could lead to β-cell dysfunction. The prolonged exposure of β-cells to fatty acids inhibits glucose-stimulated insulin secretion in vitro [16], in rats in vivo [17], and in humans [18]. The synergistic combination of glucose toxicity and lipotoxicity is harmful, which leads to glucolipotoxicity [2]. Consistent with this, the present study demonstrated that β-cell function was decreased significantly in patients with both IGR and HTG compared with patients with IGR without HTG, suggesting that lipotoxicity and glucotoxicity are both associated with β-cell dysfunction. Therefore, our clinical data strongly supported the hypothesis that IGR combined with HTG is associated with significantly more severe β-cell damage than IGR alone.
Possible explanations for β-cell dysfunction include oxidative stress, which occurs during the oxidative metabolism of glucose and free fatty acids, the production of proinflammatory cytokines, and the induction of endoplasmic reticulum stress [19-21]. Recent findings suggested that chronic oxidative stress plays an important role in islet β-cell dysfunction, and causes apoptosis in β-cells [5]. Islets have very low levels of free radical quenching enzymes such as catalase, glutathione peroxidase, and superoxide dismutase; therefore, very low levels of the intrinsic antioxidant defense system. This suggests that β-cells are at a uniquely high risk of oxidative stress and are sensitive to apoptosis [22]. Consistent with this, patients in the current study with IGR and HTG exhibited higher levels of TXNIP that did individuals with NGT, suggesting that they had higher levels of oxidative stress.
To maintain the intracellular redox balance, cells rely on scavenging systems, and in particular two major intracellular thiol-reducing mechanisms: the interacting glutathione and thioredoxin systems [23]. Thioredoxin reduces the levels of reactive oxygen species (ROS), which are generated during metabolic reactions, by reversibly oxidizing thioredoxin at Cys-32 and Cys-35 residues [24]. TXNIP inhibits the antioxidative function of thioredoxin by binding to its redox-active cysteine residues [6]. In addition, a recent study showed TXNIP impairs glucose and insulin tolerance in mice [25]. Taken together, these data and the observations in the current study suggest that the oxidative stress manifested by increased levels TXNIP could be an important mechanism underlying the progression of pre-diabetes into overt diabetes.
Recent studies showed that free fatty acids suppress TXNIP levels [9]. However, in the current study patients with the combination of IGR and HTG had higher levels of TXNIP compared with patients with IGR alone. This suggests that HTG might have different effects on TXNIP expression in patients with IGR and NGT. In individuals with IGR, HTG was not associated with beneficial effects to relieve glucose-induced TXNIP overexpression, but instead exhibited an aggravation of its expression.
Preventing or delaying the development of diabetes in pre-diabetic patients is a major challenge for clinicians. Treatments that aim to control serum TG levels and relieve oxidative stress in patients with IGR are expected to effectively halt the progression from pre-diabetes to diabetes. The present observational study suggests that controlling lipotoxicity, for example with fenofibrate, the widely used hypolipidaemic agent, might ameliorate the natural course of pre-diabetes by preventing hypertriglyceridemia [26].
In summary, we measured the levels of the oxidative stress marker TXNIP in plasma samples collected from patients with NGT, IGT and IGT + HTG. However, because data are cross-sectional and were measured only at a fixed time point, it is possible that our data might underestimate the fluctuations in the levels of oxidative stress. Nevertheless, we demonstrated a strong relationship between the combination of islet β-cell dysfunction and hyperlipidemia with the activation of oxidative stress in subjects with NGT, IGR, and the combination of IGR and HTG. We conclude that reducing glucose and TG levels in patients with IGR is important for minimizing oxidative stress-induced β-cell damage.
Disclosure of conflict of interest
None.
References
- 1.WHO. Definition, diagnosis and classification of diabetes mellitus and its complications: report of a WHO consultation. 2009 [Google Scholar]
- 2.Poitout V, Robertson RP. Minireview: secondary beta-cell failure in type 2 diabetes--a convergence of glucotoxicity and lipotoxicity. Endocrinology. 2002;143:339–342. doi: 10.1210/endo.143.2.8623. [DOI] [PubMed] [Google Scholar]
- 3.Holman RR. Assessing the potential for alpha-glucosidase inhibitors in prediabetic states. Diabetes Res Clin Pract. 1998;40(Suppl):S21–25. doi: 10.1016/s0168-8227(98)00038-2. [DOI] [PubMed] [Google Scholar]
- 4.Poitout V, Amyot J, Semache M, Zarrouki B, Hagman D, Fontes G. Glucolipotoxicity of the pancreatic beta cell. Biochim Biophys Acta. 2010;1801:289–298. doi: 10.1016/j.bbalip.2009.08.006. [DOI] [PMC free article] [PubMed] [Google Scholar]
- 5.Evans JL, Goldfine ID, Maddux BA, Grodsky GM. Are oxidative stress-activated signaling pathways mediators of insulin resistance and beta-cell dysfunction? Diabetes. 2003;52:1–8. doi: 10.2337/diabetes.52.1.1. [DOI] [PubMed] [Google Scholar]
- 6.Patwari P, Higgins LJ, Chutkow WA, Yoshioka J, Lee RT. The interaction of thioredoxin with Txnip. Evidence for formation of a mixed disulfide by disulfide exchange. J Biol Chem. 2006;281:21884–21891. doi: 10.1074/jbc.M600427200. [DOI] [PMC free article] [PubMed] [Google Scholar]
- 7.Chen J, Hui ST, Couto FM, Mungrue IN, Davis DB, Attie AD, Lusis AJ, Davis RA, Shalev A. Thioredoxin-interacting protein deficiency induces Akt/Bcl-xL signaling and pancreatic beta-cell mass and protects against diabetes. FASEB J. 2008;22:3581–3594. doi: 10.1096/fj.08-111690. [DOI] [PMC free article] [PubMed] [Google Scholar]
- 8.Minn AH, Hafele C, Shalev A. Thioredoxin-interacting protein is stimulated by glucose through a carbohydrate response element and induces beta-cell apoptosis. Endocrinology. 2005;146:2397–2405. doi: 10.1210/en.2004-1378. [DOI] [PubMed] [Google Scholar]
- 9.Shaked M, Ketzenel-Gilad M, Cerasi E, Kaiser N, Leibowitz G. AMP-activated protein kinase (AMPK) mediates nutrient regulation of thioredoxin-interacting protein (TXNIP) in pancreatic beta-cells. PLoS One. 2011;6:e28804. doi: 10.1371/journal.pone.0028804. [DOI] [PMC free article] [PubMed] [Google Scholar]
- 10.Expert Panel on Detection, Evaluation, and Treatment of High Blood Cholesterol in Adults. Executive Summary of the Third Report of the National Cholesterol Education Program (NCEP) Expert Panel on Detection, Evaluation, and Treatment of High Blood Cholesterol in Adults (Adult Treatment Panel III) JAMA. 2001;285:2486–2497. doi: 10.1001/jama.285.19.2486. [DOI] [PubMed] [Google Scholar]
- 11.Matthews DR, Hosker JP, Rudenski AS, Naylor BA, Treacher DF, Turner RC. Homeostasis model assessment: insulin resistance and beta-cell function from fasting plasma glucose and insulin concentrations in man. Diabetologia. 1985;28:412–419. doi: 10.1007/BF00280883. [DOI] [PubMed] [Google Scholar]
- 12.Jensen CC, Cnop M, Hull RL, Fujimoto WY, Kahn SE. Beta-cell function is a major contributor to oral glucose tolerance in high-risk relatives of four ethnic groups in the U. S. Diabetes. 2002;51:2170–2178. doi: 10.2337/diabetes.51.7.2170. [DOI] [PubMed] [Google Scholar]
- 13.Hahn RG, Ljunggren S, Larsen F, Nystrom T. A simple intravenous glucose tolerance test for assessment of insulin sensitivity. Theor Biol Med Model. 2011;8:12. doi: 10.1186/1742-4682-8-12. [DOI] [PMC free article] [PubMed] [Google Scholar]
- 14.U.K. prospective diabetes study 16. Overview of 6 years’ therapy of type II diabetes: a progressive disease. U.K. Prospective Diabetes Study Group. Diabetes. 1995;44:1249–1258. [PubMed] [Google Scholar]
- 15.Faerch K, Vaag A, Holst JJ, Hansen T, Jorgensen T, Borch-Johnsen K. Natural history of insulin sensitivity and insulin secretion in the progression from normal glucose tolerance to impaired fasting glycemia and impaired glucose tolerance: the Inter99 study. Diabetes care. 2009;32:439–444. doi: 10.2337/dc08-1195. [DOI] [PMC free article] [PubMed] [Google Scholar]
- 16.Zhou YP, Grill VE. Long-term exposure of rat pancreatic islets to fatty acids inhibits glucose-induced insulin secretion and biosynthesis through a glucose fatty acid cycle. J Clin Invest. 1994;93:870–876. doi: 10.1172/JCI117042. [DOI] [PMC free article] [PubMed] [Google Scholar]
- 17.Mason TM, Goh T, Tchipashvili V, Sandhu H, Gupta N, Lewis GF, Giacca A. Prolonged elevation of plasma free fatty acids desensitizes the insulin secretory response to glucose in vivo in rats. Diabetes. 1999;48:524–530. doi: 10.2337/diabetes.48.3.524. [DOI] [PubMed] [Google Scholar]
- 18.Paolisso G, Gambardella A, Amato L, Tortoriello R, D’Amore A, Varricchio M, D’Onofrio F. Opposite effects of short- and long-term fatty acid infusion on insulin secretion in healthy subjects. Diabetologia. 1995;38:1295–1299. doi: 10.1007/BF00401761. [DOI] [PubMed] [Google Scholar]
- 19.Robertson RP. Oxidative stress and impaired insulin secretion in type 2 diabetes. Curr Opin Pharmacol. 2006;6:615–619. doi: 10.1016/j.coph.2006.09.002. [DOI] [PubMed] [Google Scholar]
- 20.Maedler K, Donath MY. Beta-cells in type 2 diabetes: a loss of function and mass. Horm Res. 2004;62(Suppl 3):67–73. doi: 10.1159/000080503. [DOI] [PubMed] [Google Scholar]
- 21.Eizirik DL, Cardozo AK, Cnop M. The role for endoplasmic reticulum stress in diabetes mellitus. Endocr Rev. 2008;29:42–61. doi: 10.1210/er.2007-0015. [DOI] [PubMed] [Google Scholar]
- 22.Tiedge M, Lortz S, Drinkgern J, Lenzen S. Relation between antioxidant enzyme gene expression and antioxidative defense status of insulin-producing cells. Diabetes. 1997;46:1733–1742. doi: 10.2337/diab.46.11.1733. [DOI] [PubMed] [Google Scholar]
- 23.Nordberg J, Arner ES. Reactive oxygen species, antioxidants, and the mammalian thioredoxin system. Free Radic Bio Med. 2001;31:1287–1312. doi: 10.1016/s0891-5849(01)00724-9. [DOI] [PubMed] [Google Scholar]
- 24.World CJ, Yamawaki H, Berk BC. Thioredoxin in the cardiovascular system. J Mol Med (Berl) 2006;84:997–1003. doi: 10.1007/s00109-006-0109-6. [DOI] [PubMed] [Google Scholar]
- 25.Jo SH, Kim MY, Park JM, Kim TH, Ahn YH. Txnip contributes to impaired glucose tolerance by upregulating the expression of genes involved in hepatic gluconeogenesis in mice. Diabetologia. 2013;56:2723–2732. doi: 10.1007/s00125-013-3050-6. [DOI] [PubMed] [Google Scholar]
- 26.Wan Q, Wang F, Guan Q, Liu Y, Wang C, Feng L, Gao G, Gao L, Zhao J. Regression to normoglycaemia by fenofibrate in pre-diabetic subjects complicated with hypertriglyceridaemia: a prospective randomized controlled trial. Diabet Med. 2010;27:1312–1317. doi: 10.1111/j.1464-5491.2010.03107.x. [DOI] [PubMed] [Google Scholar]