

Abstract
Fifteen SNPs from nine different genes were genotyped on 1379 individuals, 758 T2DM patients and 621 controls, from the city of Hyderabad, India, using Sequenom Massarray platform. These data were analyzed to examine the role of gene–gene and gene–environment interactions in the manifestation of T2DM. The multivariate analysis suggests that TCF7L2, CDKAL1, IGF2BP2, HHEX and PPARG genes are significantly associated with T2DM, albeit only the first two of the above 5 were associated in the univariate analysis. Significant gene–gene and gene–environment interactions were also observed with reference to TCF7L2, CAPN10 and CDKAL1 genes, highlighting their importance in the pathophysiology of T2DM. In the analysis for cumulative effect of risk alleles, SLC30A8 steps in as significant contributor to the disease by its presence in all combinations of risk alleles. A striking difference between risk allele categories, 1–4 and 5–6, was evident in showing protective and susceptible roles, respectively, while the latter was characterized by the presence of TCF7L2 and CDKAL1 variants. Overall, these two genes TCF7L2 and CDKAL1 showed strong association with T2DM, either individually or in interaction with the other genes. However, we need further studies on gene–gene and gene–environment interactions among heterogeneous Indian populations to obtain unequivocal conclusions that are applicable for the Indian population as a whole.
Keywords: Population of Hyderabad, India, Type 2 diabetes mellitus, Gene–gene interactions, Gene–environment interactions
Highlights
-
•
Evidence for the role of gene-gene and gene–environment interactions with T2DM
-
•
TCF7L2 and CDKAL1 emerged as prominent T2DM susceptible genes in this population.
-
•
Contributes to the knowledge of understanding the interactions in the etiology of T2DM
Introduction
Type 2 diabetes is the most common form of diabetes mellitus, constituting ~ 95% of the diabetic population. It is characterized by elevated levels of plasma glucose which is caused by the combination of insulin resistance and relative insulin deficiency. In recent years, genome-wide association studies (GWAS) and candidate gene studies have identified a large number of Single Nucleotide Polymorphisms (SNPs) that were associated with T2DM (Kommoju and Reddy, 2011). The genes involved in blood-glucose homeostasis, insulin pathway and pancreatic development pathways are considered to be excellent candidates in the etiology of T2DM. Therefore, to test the pattern of genetic association with T2DM in the population of Hyderabad, we focused on the most studied and widely replicated 15 SNPs of the 9 prominent genes that are known to play important roles in the pathophysiology of T2DM. Given the multifactorial nature of the complex genetic diseases such as T2DM, wherein a large number of genes each with a small effect contribute to the development of the disease, identification of susceptible genes has always been a major challenge. In addition to the individual contributions of genetic and environmental factors, the gene–gene and gene–environment interactions also play a crucial role in the etiology of complex genetic diseases. Therefore, it is important to know the combinatorial effect of genes on the manifestation of the disease of interest. A few studies showed evidence of interaction/epistasis among genes and supported the hypothesis that the genes with no significant main effects may turn out to be significant in concert with other genes (Cordell, 2010, Culverhouse et al., 2002). There is also evidence for a significant role of Gene–Environment interactions in the etiology of T2DM (Kommoju and Reddy, 2011, Franks, 2012). However, most of the replication studies hitherto focused on a single locus strategy where the association was examined with reference to individual variants.
Despite the vast genetic heterogeneity and high prevalence of T2DM in India, very few validation studies of these genes have been carried out (Chauhan et al., 2010, Chidambaram et al., 2010, Kommoju and Reddy, 2011). Hyderabad has been considered as the ‘Diabetic capital of India’ (Mohan et al., 2007) and yet its population has not been explored for the nature of genetic predisposition to T2DM. It is therefore imperative to screen this population as well as others from this linguistic region for the susceptible genetic variants and see if we can validate the patterns of genetic association observed in other populations. With this objective, we have initiated this project and already published results based on individual genes in specific pathways (Uma Jyothi et al., 2013a, Uma Jyothi et al., 2013b, Uma Jyothi et al., 2014). In the present paper, we focus on the results of multivariate genetic analysis and attempt to assess the possible interactions among the genes as well as between genes and environmental factors in order to understand the synergetic nature of the effect of genetic and environmental factors towards developing T2DM.
Material and methods
Study design
For this genetic study of diabetes with case-control design, we collected a total sample of 1379 subjects, 758 T2DM patients and 621 normal controls from Hyderabad, India, during 2010–2011. The T2DM patients were recruited from J.P. Endocrine Center, Hyderabad, as per the American Diabetes Association (ADA, 2010) criteria (with a diagnostic value of fasting plasma glucose ≥ 126 mg/dl or 2-h plasma glucose ≥ 200 mg/dl or random plasma glucose ≥ 200 mg/dl). Healthy individuals aged ≥ 40 yrs, with no family history of T2DM and with a random plasma glucose ≤ 140 mg/dl were recruited as controls by conducting free diabetic camps in different organizations in Hyderabad. The anthropometric measurements such as height, weight, waist and hip circumferences were measured for all the subjects and consequently Body mass index (BMI) and the waist to hip ratio (WHR) were calculated. The background information such as age, gender (male/female), lifestyle patterns like food habits (vegetarian or non-vegetarian), junk food, smoking, alcohol consumption, physical activity and migration pattern (native or migrant) was also collected along with other details as described elsewhere (Uma Jyothi et al., 2013a, Uma Jyothi et al., 2013b, Uma Jyothi et al., 2014). The abovementioned variables were used as covariates in the interaction analysis. Among these covariates only age and BMI were quantitative variables while junk food, smoking, alcohol, migration pattern were binary variables (yes/no) and physical activity was categorized as low, medium and high.
Population
Hyderabad is a conglomeration of people from different parts of the state and the mother tongue of the most of its population is Telugu, one of the four Dravidian languages. Besides considerable size of the native Muslim population in Hyderabad, there has been recent influx of a large number of people from other regions of India, due to rapid industrialization that provided enormous scope for employment and business. For the sake of relative homogeneity of the sample, we recruited only native Telugu speaking subjects, both cases and controls representing similar ethnic and linguistic backgrounds. It would be also pertinent to note that despite the subdivision of Telugu population into a number of traditionally endogamous castes and sub-castes, Reddy et al. (2005) observed genetic differentiation among the populations of Andhra Pradesh to be very low and insignificant, the Markov chain Monte Carlo analysis of population structure which implements model based clustering method for grouping individuals into populations (Falush et al., 2003, Pritchard et al., 2000) did not reveal any unique population clusters and therefore suggest high degree of genetic homogeneity of the population of Andhra Pradesh. Given that the patients of the clinics as well as the employees of different organizations from where the controls were drawn constitute similar ethnic and linguistic backgrounds, we could ensure broad matching for ethnicity of the cases and controls.
Blood collection, DNA extraction and ethics statement
About 3–5 ml of blood was collected in K3-EDTA coated vacutainers after obtaining a written informed consent from the subjects. Genomic DNA was isolated from the blood samples using Phenol–chloroform method (Sambrook et al., 1989). Indian Statistical Institute Review Committee for Protection of Research Risks to Humans specifically approved this study.
Selection of genes/SNPs and genotyping
A panel of 15 SNPs from nine prominent T2DM genes of different pathways were considered in the present study i.e TCF7L2 (rs7903146, rs11196205, rs12255372), IGF2BP2 (rs4402960, rs1470579), SLC30A8 (rs13266634), CDKAL1 (rs7754480, rs7756992), CDKN2A/B (rs10811661), HHEX (rs1111875, rs7923837), IRS-1 (rs1801278), CAPN10 (rs3792267, rs5030952) and PPARG (rs1801282). Considering both the candidate gene studies and GWAS till the year 2010, we prioritized SNPs that were most widely replicated among Indian (Chauhan et al., 2010, Chidambaram et al., 2010) as well as non-Indian populations (Horikawa et al., 2008, Ng et al., 2008). Despite the large number of SNPs that were found associated with T2DM in different populations, due to resource constraint we had to restrict our choice of genotyping to 15 SNPs only. Genotyping was carried out on the Sequenom MassArray platform (Seq. Inc.) at The Center for Genomic Application (TCGA), Delhi. DNA samples were quantified and fresh aliquots were prepared to perform the assay according to the manufacturer's protocol (Gabriel et al., 2009). The QC procedure was already outlined in one of our earlier publications (Uma Jyothi et al., 2013a). The samples with complete genotype information for all the 9 SNPs from nine genes only were included for the interaction analysis (cases = 657 and controls = 487).
Statistical analysis
The multivariate logistic regression analyses of alleles and genotypes were done using ‘Epicalc’ package of R program (version3.2). The pair-wise analysis of gene–gene interactions, involving parametric approach, was carried out using PLINK software (version1.07) and gene–environment interactions using R program. The non-parametric approach of gene–gene interactions was done using GMDR (version 0.9). For understanding the cumulative effect of each risk allele category (based on number of risk alleles) ROC (Receiver operator curve) was plotted using SPSS (version 18.0) and for the relative effect of different risk allele combinations, within each of the risk allele categories, Z test for 2-sample proportions was carried out for testing the significance of the differences between cases and controls using Microsoft Excel 2007 and MINITAB (version 16.0).
Results and discussion
The detailed description of the clinical profile of subjects was presented in an earlier paper (Uma Jyothi et al., 2013a). The results based on individual SNP analysis were published earlier (Uma Jyothi et al., 2013a, Uma Jyothi et al., 2013b, Uma Jyothi et al., 2014) and for the sake of convenience we present these results in a supplementary table (S1); out of the 15 only 6 SNPs, two each from TCF7L2 (rs7903146, rs12255372) and CDKAL1(rs7754840, rs7756992) and one each from CAPN10(rs3792267) and IRS-1(rs1801278) genes, showed significant association with T2DM and this significance was retained even after Bonferroni correction for multiple testing. The logistic regression analysis revealed odds ratios to range between 1.35 and 1.89, suggesting risk conferring nature of these SNPs towards T2DM in the population of Hyderabad.
The Linkage Disequilibrium (LD) plot of SNPs on the same gene, showed strong LD with D′ values ranging (0.80–1.00) (Uma Jyothi et al., 2013a, Uma Jyothi et al., 2013b, Uma Jyothi et al., 2014). However, LD was not apparent with reference to genes located on the same chromosome between TCF7L2 & HHEX, IRS-1 & CAPN10, IGF2BP2 & PPARG, suggesting the independent nature of these genes. The genes on different chromosomes were obviously not in LD. Based on the observed LD pattern, we considered only 9 of the 15 SNPs, one SNP that is most significantly associated with T2DM, from each of the nine genes (TCF7L2 (rs7903146), IGF2BP2 (rs1470579), SLC30A8 (rs13266634), CDKAL1 (rs7756992), CDKN2A/B (rs10811661), HHEX (rs1111875), IRS-1 (rs1801278), CAPN10 (rs3792267) and PPARG (rs1801282)). Therefore, in the subsequent sections we refer genes as synonymous to the respective SNPs. We structured the analysis into four stages and presented results accordingly:
-
1)
Multivariate logistic regression analysis of alleles and genotypes.
-
2)
Gene–gene interaction analysis: Parametric and non-parametric approaches.
-
3)
Gene–environment interaction analysis.
-
4)
Cumulative effect of the risk alleles.
Multivariate logistic regression of T2DM on alleles and genotypes
The results of multivariate logistic regression analysis of the alleles with covariates (Table 1) suggest significant association of the variant alleles — T of TCF7L2 (p < 0.001) and G of CDKAL1 (p = 0.009) with T2DM, which is in congruence with the results of individual SNP analysis. However, the two SNPs of IRS-1 and CAPN10 genes that were significantly associated in the univariate context failed to show significant association in the multivariate context. Instead, the C allele of IGF2BP2 and G allele of HHEX that were not significant in the univariate analysis turned out to be significant in the multivariate context (p = 0.009 and 0.025, respectively). While the IGF2BP2 showed risk conferring role, the HHEX showed a protective role towards T2DM. This supports the notion that some genetic variants, which are not independently associated with the phenotype, may show association in concert with other variants and provide evidence of interaction effects (Cordell, 2010, Culverhouse et al., 2002). Except age and alcohol, all the other covariates were found to be significant at 5% level in their association with the phenotype (Table 1). The SNPs of TCF7L2, IGF2BP2, CDKAL1 and HHEX genes remained significant even after adjusting for the abovementioned covariates suggesting that the confounding nature of the covariates is not such so as to qualitatively change the pattern of genetic association.
Table 1.
Multivariate logistic regression analysis of alleles and genotypes of T2DM cases and controls with and without using covariates.
| SNP | Allele | Adjusted for covariates |
Genotype | Adjusted for covariates |
|||||
|---|---|---|---|---|---|---|---|---|---|
| OR† | 95%C.I. | p-Value‡ | OR | 95%C.I. | p-Value‡ | ||||
| Gene± | |||||||||
| TCFL2 | rs7903146 | T | 2.02 | 1.61–2.52 | < 0.001 | CT | 1.99 | 1.49–2.64 | < 0.001⁎ |
| TT | 3.58 | 2.09–6.13 | < 0.001 | ||||||
| IGF2BP2 | rs1470579 | C | 1.31 | 1.07–1.61 | 0.009 | CA | 1.27 | 0.91–1.76 | 0.161 |
| CC | 1.22 | 0.83–1.78 | 0.312 | ||||||
| SLC30A8 | rs13266634 | C | 1.19 | 0.94–1.51 | 0.156 | CT | 1.09 | 0.56–2.11 | 0.799 |
| CC | 1.1 | 0.57–2.10 | 0.777 | ||||||
| CDKAL1 | rs7756992 | G | 1.3 | 1.03–1.64 | 0.025 | AG | 1.3 | 0.98–1.73 | 0.068 |
| GG | 1.97 | 1.09–3.56 | 0.025 | ||||||
| CDKN2A/B | rs10811661 | T | 1.2 | 0.91–1.59 | 0.188 | CT | 0.64 | 0.21–1.97 | 0.433 |
| TT | 0.95 | 0.31–2.87 | 0.927 | ||||||
| HHEX | rs1111875 | G | 0.79 | 0.65–0.98 | 0.028 | AG | 1.11 | 0.81–1.51 | 0.516 |
| GG | 0.88 | 0.59–1.30 | 0.52 | ||||||
| IRS-1 | rs1801278 | A | 1.21 | 0.74–1.99 | 0.45 | AA | 1.46 | 0.12–18.01 | 0.77 |
| GA | 1.45 | 0.85–2.47 | 0.175 | ||||||
| CAPN10 | rs3792267 | A | 1.81 | 0.89–1.56 | 0.242 | AA | 1.58 | 0.66–3.77 | 0.307 |
| GA | 1.27 | 0.92–1.74 | 0.147 | ||||||
| PPARG | rs1801282 | C | 1.14 | 0.84–1.54 | 0.413 | GC | 0.7 | 0.50–0.99 | 0.046 |
| GG | 1.22 | 0.41–3.59 | 0.721 | ||||||
| Covariates | |||||||||
| Age | 0.99 | 0.98–1.00 | 0.069 | 0.99 | 0.97–1.01 | 0.217 | |||
| Gender | 0.74 | 0.58–0.94 | 0.012 | 0.7 | 0.50–0.99 | 0.045 | |||
| Migration | 0.45 | 0.37–0.55 | < 0.001 | 0.44 | 0.33–0.58 | < 0.001 | |||
| V/NV | 0.67 | 0.52–0.85 | 0.001 | 0.68 | 0.48–0.97 | 0.035 | |||
| Junk food | 1.41 | 1.14–1.75 | 0.002 | 1.36 | 0.99–1.86 | 0.055 | |||
| Alcohol | 1.1 | 0.86–1.40 | 0.44 | 1.13 | 0.8–1.66 | 0.497 | |||
| Smoking | 0.68 | 0.51–0.90 | 0.007 | 0.65 | 0.43–0.99 | 0.046 | |||
| Physical activity | 1.19 | 1.06–1.33 | 0.003 | 1.18 | 1.0–1.4 | 0.048 | |||
| BMI | 1.16 | 1.13–1.19 | < 0.001 | 1.16 | 1.12–1.2 | < 0.001 | |||
Gene name — Abbreviation: Transcription factor 7 like 2 — TCF7L2, insulin growth factor2 mRNA binding protein 2 — IGF2BP2, solute carrier (Zinc transporter) 30 member 8 — SLC30A8, CDK5 regulatory subunit associated protein 1 — like 1 — CDKAL1, Cyclin-dependent kinase inhibitor 2A/B — CDKN2A/B, Hematopoietically expressed homeo box gene — HHEX, Insulin receptor substrate1—IRS1, Calcium activated cysteine protease — CAPN10, Peroxisome proliferator activated receptor gamma—PPARG.
5% and 10% significance was considered.
Odds ratio calculated with respect to risk allele.
Significant p values bolded.
The results of genotype-wise multivariate logistic regression analysis (Table 1) suggests significant odds (p < 0.001) for the heterozygous (CT) and the homozygous (TT) genotypes of the TCF7L2 gene. Similarly the heterozygous (AG) carriers and homozygous (GG) genotypes of CDKAL1 (p ≤ 0.006) were also significant. The genotypes of these two genes showed a risk conferring nature towards T2DM, which is consistent with the individual gene analysis. Interestingly, the heterozygous carrier (GA) of IRS-1 and CAPN10 genes also showed a significant association at 5 and 10% (p value = 0.03 and 0.086), respectively, conferring risk towards the development of T2DM, which is again consistent with the individual SNP analysis (results of unadjusted p values not presented). When the logistic regression analysis was repeated using covariates, a significant association of gender, migration pattern, smoking and BMI was found with T2DM. However, after adjusting for the covariates, besides TCF7L2 and CDKAL1 only the heterozygote genotype (GC) of PPARG turned to be significant, while the heterozygote (GA) of IRS-1 and CAPN10 did not show significant association. This is possibly a demonstration of the confounding nature of the effects of covariates with that of the genetic factors, particularly in the form of genotypes, on the manifestation of this complex phenotype.
Overall, of the nine genes considered for our study TCF7L2 and CDKAL1 emerged as prominent and showed significant association with T2DM in the population of Hyderabad, both in the univariate and multivariate analyses. On the other hand, while IGF2BP2, HHEX and PPARG that were not independently associated, turned out to be significant in the multivariate context. IRS-1 and CAPN10 that were associated individually failed to show association in the multivariate analysis, both these situations conforming probably to the phenomenon of epistasis (Cordell, 2010, Culverhouse et al., 2002); where as in the first case, the genes with no independent effect, turn out to be significant in the presence of other genes, in case of the latter the potential independent effects of IRS-1 and CAPN10 were probably masked by other genes.
Gene–gene interactions
We used both parametric and non-parametric statistical approaches to study the nature of gene–gene interactions. The logistic regression analysis is considered to be the standard parametric approach to detect the gene–gene interactions in the presence of main effects. While the non parametric approach of MDR analysis was designed specifically to improve the power to detect epistasis in the absence of detectable main effects (www.epistasis.org). The parametric approach was implemented through pair-wise logistic regression analysis of the nine genes with the help of PLINK software and the results are presented in Table 2. Of the 33 pairs computed, only CAPN10–CDKAL1 and CAPN10–TCF7L2 showed significant interaction (p ≤ 0.038) in their association with T2DM, albeit CAPN10 confers protection against T2DM in contrast to its risk conferring role in the univariate context, which may highlight the epistatic role that CAPN10 gene might play in the etiology of T2DM in this particular population. Although these genes are related through the insulin secretion pathway, the intricate mechanism involved in the epistatic role of CAPN10 gene needs to be elucidated before one can throw light on how this interaction with CAPN10 results in changed direction of their combined effect.
Table 2.
Pair-wise gene–gene interaction analysis using logistic regression.
| Gene–gene | SNP–SNP | OR | p value |
|---|---|---|---|
| IRS1–CAPN10† | rs1801278–rs3792267 | 0.8191 | 0.6768 |
| IRS1–PPARG | rs1801278–rs1801282 | 0.8852 | 0.7425 |
| IRS1–IGF2BP2 | rs1801278–rs1470579 | 0.6701 | 0.2194 |
| IRS1–CDKAL1 | rs1801278–rs7756992 | 0.7329 | 0.3829 |
| IRS1–SLC30A8 | rs1801278–rs13266634 | 0.4999 | 0.1207 |
| IRS1–CDKN2A/B | rs1801278–rs10811661 | 1.676 | 0.2796 |
| IRS1–HHEX | rs1801278–rs1111875 | 1.691 | 0.1382 |
| IRS1–TCF7L2 | rs1801278–rs7903146 | 0.6869 | 0.2722 |
| CAPN10–PPARG | rs3792267–rs1801282 | 1.053 | 0.8523 |
| CAPN10–IGF2BP2 | rs3792267–rs1470579 | 0.9752 | 0.879 |
| CAPN10–CDKAL1 | rs3792267–rs7756992 | 0.6568 | 0.037⁎ |
| CAPN10–SLC30A8 | rs3792267–rs13266634 | 0.8354 | 0.3714 |
| CAPN10–CDKN2A/B | rs3792267–rs10811661 | 0.705 | 0.1837 |
| CAPN10–HHEX | rs3792267–rs1111875 | 0.8798 | 0.4466 |
| CAPN10–TCF7L2 | rs3792267–rs7903146 | 0.6702 | 0.038 |
| PPARG–IGF2BP2 | rs1801282–rs1470579 | 1.27 | 0.212 |
| PPARG–CDKAL1 | rs1801282–rs7756992 | 1.017 | 0.936 |
| PPARG–SLC30A8 | rs1801282–rs13266634 | 1.006 | 0.9785 |
| PPARG–CDKN2A/B | rs1801282–rs10811661 | 1.051 | 0.8517 |
| PPARG–HHEX | rs1801282–rs1111875 | 1.262 | 0.2174 |
| PPARG–TCF7L2 | rs1801282–rs7903146 | 0.9236 | 0.7022 |
| IGF2BP2–CDKAL1 | rs1470579–rs7756992 | 0.8414 | 0.2244 |
| IGF2BP2–SLC30A8 | rs1470579–rs13266634 | 0.8659 | 0.315 |
| IGF2BP2–CDKN2A/B | rs1470579–rs10811661 | 1.177 | 0.3708 |
| IGF2BP2–HHEX | rs1470579–rs1111875 | 1.081 | 0.5149 |
| IGF2BP2–TCF7L2 | rs1470579–rs7903146 | 0.9879 | 0.9337 |
| CDKAL1–SLC30A8 | rs7756992–rs13266634 | 1.171 | 0.3507 |
| CDKAL1–CDKN2A/B | rs7756992–rs10811661 | 1.005 | 0.9796 |
| CDKAL1–HHEX | rs7756992–rs1111875 | 1.148 | 0.3382 |
| CDKAL1–TCF7L2 | rs7756992–rs7903146 | 1.023 | 0.8892 |
| SLC30A8–CDKN2A/B | rs13266634–rs10811661 | 0.8075 | 0.3433 |
| SLC30A8–HHEX | rs13266634–rs1111875 | 0.9575 | 0.7633 |
| SLC30A8–TCF7L2 | rs13266634–rs7903146 | 0.8404 | 0.3244 |
| CDKN2A/B-HHEX | rs10811661–rs1111875 | 1.114 | 0.5285 |
| CDKN2A/B-TCF7L2 | rs10811661–rs7903146 | 0.9969 | 0.988 |
| HHEX–TCF7L2 | rs1111875–rs7903146 | 1.016 | 0.9072 |
Results presented according to the ascending order of chromosomal location.
Significant p values bolded — 5% and 10% significance was considered.
Multidimensionality reduction (MDR) analysis
MDR is a non-parametric approach with no hypothesis concerning the value of any statistical parameter and it does not also assume a particular genetic model (Cho et al., 2004, Hahn et al., 2003, Motsinger and Ritchie, 2006). It overcomes the problems of a traditional parametric approach where with the increasing number of interactions, the contingency cells may be left with very few data leading to spurious results. In principle, it reduces the multidimensional genotype predictor into a single dimension and allows detection of interactions even in small sample sizes. Generalized Multidimensional Reduction (GMDR) software is based on MDR which permits adjustment for covariates in the gene–gene interactions, by internally calculating the score statistic for each of the covariates and computes the statistical significance of the model (Chen et al., 2011, Lou et al., 2007). A 10 fold cross-validation with two, three and four way interactions were used to detect gene–gene interactions using GMDR. Based on the testing balance accuracy and minimal prediction error, the best models were selected. A minimum cutoff value of 0.55 was considered for the testing balance accuracy.
The GMDR results (Table 3) showed significant interactions of two, three and four loci combinations — TCF7L2–IRS-1, TCF7L2–CDKAL1–HHEX, TCF7L2–IGF2BP2–CDKAL1–HHEX — with p values ≤ 0.001 with a 10 fold cross-validation consistency (CVC) and the observed results remained qualitatively similar when adjusted for covariates. Interestingly, IGF2BP2 and HHEX genes, which were not individually significant, turned out to be significant in the three and four loci combination. The significant combinations of genes observed in the non-parametric approach of gene–gene interactions (TCF7L2–IRS-1,TCF7L2–CDKAL1–HHEX, TCF7L2–IGF2BP2–CDKAL1–HHEX), except in the four loci combination with IGF2BP2 and HHEX, constituted only TCF7L2, IRS-1 and CDKAL1 which were significant in the univariate analysis as well. This may be partly due to the lack of provision for inclusion of higher order interactions (> 4 way interactions) in the MDR analysis because the relatively smaller sample that we have for such an analysis. However, it is pertinent to note that the results of non-parametric approach are consistent with that of the parametric approach of gene–gene interactions, as in both the analyses, combinations involving TCF7L2 and CDKAL1 were significant.
Table 3.
Summary table of best gene–gene interaction models using GMDR with and without adjusting for covariates.
| Combination |
Unadjusted for covariates |
Adjusted for covariates |
||||||
|---|---|---|---|---|---|---|---|---|
| Bal.Acc.CV training | Bal.Acc.CV testing | CVC consistency | Sign test (p) | Bal.Acc.CV training | Bal.Acc.CV testing | CVC consistency | Sign test (p) | |
| TCF7L2 | 0.5936 | 0.5952 | 10/10 | 10 (0.0010) | 0.5972 | 0.5979 | 10/10 | 10 (0.0010) |
| TCF7L2,IRS-1 | 0.5994 | 0.5947 | 9/10 | 10 (0.0107) | 0.5992 | 0.5938 | 10/10 | 10 (0.0010) |
| TCF7L2,CDKAL1,HHEX | 0.6065 | 0.5792 | 10/10 | 10 (0.0010) | 0.6108 | 0.5941 | 10/10 | 10 (0.0010) |
| TCF7L2,IGF2BP2,CDKAL1,HHEX | 0.6349 | 0.5450 | 7/10 | 9 (0.0107) | 0.6352 | 0.5677 | 10/10 | 9 (0.0107) |
Gene–environment interactions
Parametric approach using R program
Using the same set of environmental factors that were considered as covariates in the multivariate logistic regression, gene–environment interaction analysis was carried out under the assumption of additive model and the results were furnished in Table S2. Among these environmental factors, only migration, food habits, smoking, alcohol and BMI were found interacting significantly with different genes (Table 4), albeit only at p ≤ 0.10 in most of those interactions (TCF7L2 ∗ BMI, CDKAL1 ∗ ALCOHOL, CAPN10 ∗ SMOKING) except CDKAL1 ∗ MIGRATION (p = 0.044). The odds ratio suggests a protective nature of the CDKAL1 ∗ MIGRATION interaction, whereas CDKAL1 ∗ ALCOHOL and CAPN10 ∗ SMOKING confer susceptibility to T2DM. Although a fourfold increase in the odds for risk of developing T2DM was observed due to interaction between CAPN10 ∗ SMOKING (Table 4), given that females are non-smokers and confidence interval is too large, the importance of the effect of this interaction on T2DM cannot be overemphasized.
Table 4.
Significant Gene–Environment interactions along with main effects
| Gene | ^Main effects | SNP ∗ environment | OR | Lower95ci | Upper95ci | p value † |
|---|---|---|---|---|---|---|
| TCF7L2 | MG | 0.512 | 0.36 | 0.728 | 0.0002 | |
| VNV | 0.604 | 0.391 | 0.932 | 0.023 | ||
| BMI | 1.126 | 1.081 | 1.174 | < 0.001 | ||
| TCF7L2 ∗ BMI | 1.054 | 0.998 | 1.112 | 0.057 | ||
| IGF2BP2 | MG | 0.347 | 0.221 | 0.546 | < 0.001 | |
| VNV | 0.585 | 0.334 | 1.025 | 0.061 | ||
| Smoking | 0.559 | 0.284 | 1.101 | 0.093 | ||
| BMI | 1.114 | 1.058 | 1.173 | < 0.001 | ||
| IGF2BP2 ∗ BMI | 0.036 | 0.023 | 1.595 | 0.111 | ||
| SLC30A8 | BMI | 1.15 | 1.056 | 1.251 | 0.001 | |
| CDKAL1 | MG | 0.577 | 0.409 | 0.814 | 0.002 | |
| VNV | 0.534 | 0.348 | 0.82 | 0.004 | ||
| BMI | 1.14 | 1.094 | 1.188 | < 0.001 | ||
| CDKAL1 ∗ MG | 0.632 | 0.404 | 0.987 | 0.044 | ||
| CDKAL1 ∗ ALCOHOL | 1.701 | 0.952 | 3.04 | 0.073 | ||
| CDKN2A/B | MG | 0.399 | 0.15 | 1.065 | 0.067 | |
| VNV | 0.321 | 0.098 | 1.05 | 0.06 | ||
| HHEX | MG | 0.42 | 0.276 | 0.639 | < 0.001 | |
| BMI | 1.151 | 1.095 | 1.21 | < 0.001 | ||
| IRS-1 | MG | 0.429 | 0.326 | 0.565 | < 0.001 | |
| VNV | 0.699 | 0.495 | 0.986 | 0.041 | ||
| BMI | 1.15 | 1.11 | 1.18 | < 0.0001 | ||
| CAPN10 | MG | 0.445 | 0.326 | 0.607 | < 0.001 | |
| Smoking | 0.601 | 0.377 | 0.956 | 0.031 | ||
| BMI | 1.147 | 1.106 | 1.19 | < 0.001 | ||
| CAPN10 ∗ smoking | 4.954 | 0.928 | 26.442 | 0.061 | ||
| PPARG | BMI | 1.177 | 1.045 | 1.325 | 0.007 |
† 5% and 10% significance was considered.
Cumulative effect of risk alleles
With the assumption that the larger the number of risk alleles in an individual, the greater would be the risk of developing T2DM, we have categorized subjects based on the number of risk alleles carried by them from among the nine genes. However, because of the low frequency, the extreme risk allele categories, 1 and 8 & 9, were merged with the adjacent categories, 1–2 and 7–9, respectively. Fig. 1 shows frequency distribution of T2DM patients and controls according to the number of risk alleles carried by them. A trend of relatively greater proportion of T2DM cases than controls was observed with increasing number of risk alleles, especially after 4, which appears to have the modal frequency in the distribution. We have also carried out logistic regression analysis to test the association between risk score and T2DM. The odds ratio with 95% confidence interval was computed for each of these categories, by taking 1–2 risk allele categories as the reference. All the risk allele categories were found to be highly significantly associated (p ≤ 0.009) with T2DM, excepting the three risk allele categories. An increasing trend of odds with increasing number of risk alleles was also apparent and the individuals carrying 7 or more risk alleles showed 2.64 fold increased risk for developing T2DM as compared to individuals carrying 1–2 risk alleles (Fig. 2). Despite the limited number of SNPs considered in this study, the pattern of increasing risk for T2DM with increasing number of risk alleles was apparent and a similar pattern was also observed in other populations (Lango et al., 2008, Cauchi et al., 2008, Hu et al., 2009, Chauhan et al., 2010, Rees et al., 2011, Wu et al., 2008).
Fig. 1.

Distribution of risk alleles of T2DM cases and controls.
Fig. 2.

Line plot showing the values of odds ratios and 95% confidence intervals (CI) from logistic regression analysis of the number of risk alleles among the T2DM cases and controls.
Since these results were in conformity to our hypothesis, we attempted to measure the discriminative power of the risk allele scores using ROC (receiver operating curve). The ROC plot was constructed using the predicted probabilities obtained through logistic regression of the risk score and the phenotype category (Fig. 3). The results yielded AUC (area under curve) of 0.557 (95% CI: 0.533–0.581; p = < 0.0001). The observed AUC, despite being highly significant, has limited power to confer these genetic variants as predictors of risk for T2DM. Further studies in relatively larger samples are required before one can establish the status of these variants as predictive/susceptible towards T2DM in general and particularly in the population of Hyderabad.
Fig. 3.
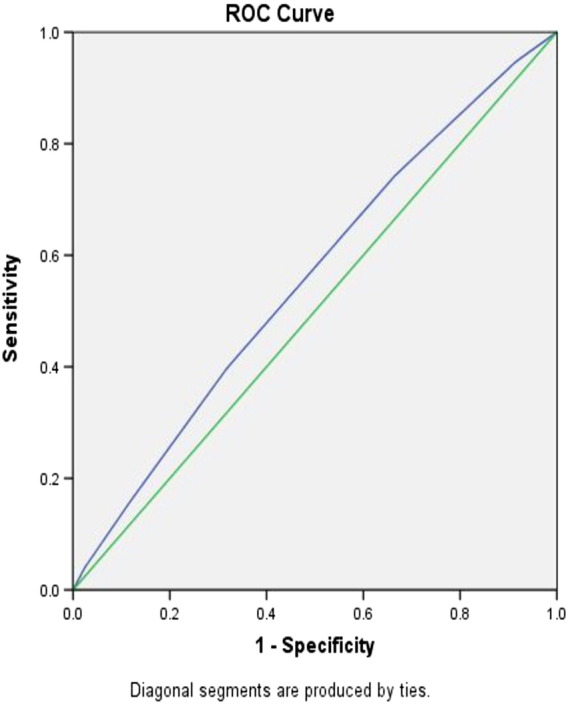
Discriminant analysis using receiver operator curve (ROC) based on the risk allele categories among T2DM cases and controls.
Given that the ROC results showed potential for prediction, we have made an exploratory attempt to gauge which combinations of genes in each of the risk allele categories contribute significant risk to T2DM. We found 170 combinations (results not presented) of which 32 were found to be most frequently observed among the different risk allele categories in both cases and controls (Table S3). Applying Z test, we observed that out of these 32, only 8 combinations i.e (SLC30A8), (SLC30A8, CDKN2A/B), (IGF2BP2, SLC30A8, PPARG), (CDKN2A/B, HHEX, PPARG), (SLC30A8, CDKN2A/B, HHEX, PPARG), (TCF7L2, IGF2BP2, SLC30A8, CDKN2A/B, PPARG), (TCF7L2, SLC30A8, CDKAL1, CDKN2A/B, HHEX, PPARG) showed significant differences in frequency between T2DM cases and controls. Significant to note is that among the six of these eight combinations, SLC30A8 gene was present, emerging as a prominent gene in concert with other genes. Given that this gene was not identified to be associated either in the univariate or multivariate analysis, it may reiterate the possible epistatic nature of interactions among the genes in the diabetic pathways. To reaffirm qualitatively the observed differences in frequencies of each of the 8 significant combinations among T2DM patients and controls, we have carried out one tailed, 2 sample proportion Z test i.e (cases > controls;cases < controls) wherever applicable (Table 5). The results show that the following 1–4 risk alleles categories — SLC30A8; SLC30A8, CDKN2A/B; IGF2BP2, SLC30A8, PPARG; CDKN2A/B, HHEX, PPARG; SLC30A8, CDKN2A/B, HHEX, PPARG — were found to be significantly more frequent in controls, which may suggest a protective role towards developing T2DM. On the other hand, 5–6 risk allele combinations (TCF7L2, IGF2BP2, SLC30A8, CDKN2A/B, PPARG), (TCF7L2, SLC30A8, CDKAL1, CDKN2A/B, HHEX, PPARG) were significantly more frequent among the cases, suggesting risk towards T2DM. Although SLC30A8, IGF2BP2, CDKN2A/B, HHEX and PPARG genes were common in different significant combinations, a markedly qualitative difference between 1–4 and 5–6 risk allele categories showing protective and susceptible roles, respectively, was evident by the presence of TCF7L2 and CDKAL1 genes in the latter, thereby confirming their role as susceptible genetic variants of T2DM. This may suggest that despite the presence of SLC30A8, IGF2BP2, CDKN2A/B, HHEX and PPARG genes in all the categories, it was the presence of TCF7L2 and CDKAL1 genes which could lead individuals to be predisposed to T2DM. This suggests that the TCF7L2 and CDKAL1 genes, which are involved in the beta cell function, might play a crucial role in predisposing individuals to T2DM in this population. Overall, our findings provide support to the possible role of gene–gene and gene–environment interactions in the manifestation of T2DM. Although the post-hoc power of the study for individual SNPs was estimated to be above 90% (Uma Jyothi et al., 2013a, Uma Jyothi et al., 2013b), the power to detect interactions accurately would be probably low and Bonferroni correction for multiple testing was not applied, hence there would be a chance for false positive. Therefore, our results should be considered as tentative and provide heuristic trends rather than establishing the nature of gene–gene and gene–environment interactions and/or the precise magnitude of the cumulative effect of the genes considered. Further studies with relatively larger sample and more stringent conditions are warranted to gauge the precise magnitude of the cumulative effect of these genes which might help developing predictive markers for T2DM in the population of Hyderabad.
Table 5.
Two-sampled proportion Z test for T2DM cases and controls for the eight significant combinations. Blue color indicates — protective; red color indicates susceptible to T2DM based on their frequencies among cases and controls.
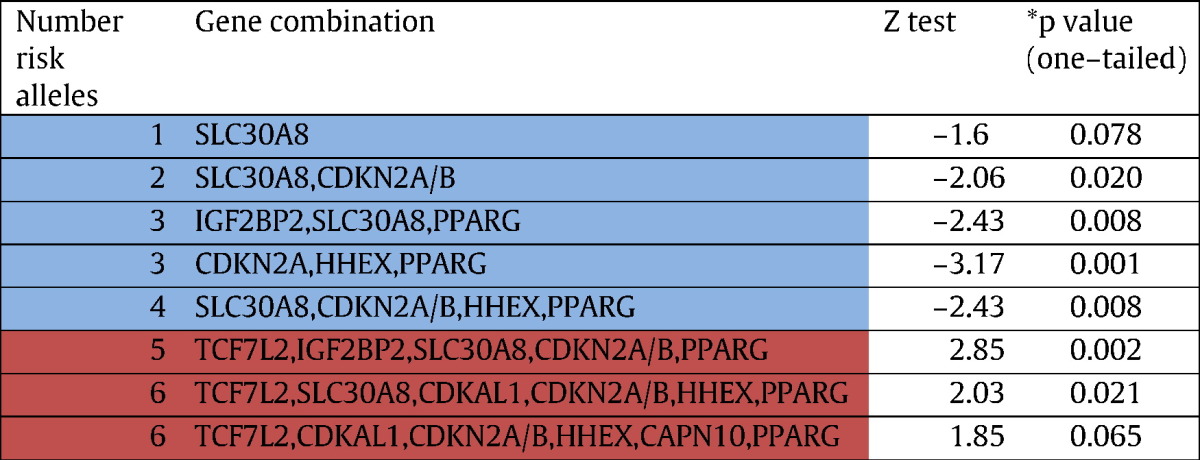
*5% and 10% significance was considered.
Conclusions
Our study fills the lacunae in understanding the complex interplay of genes and environment in the etiology of T2DM in the population of Hyderabad, which has not been explored hitherto. Among the nine genes studied, TCF7L2 and CDKAL1 emerged as prominent T2DM genes in our population showing significant association in the multivariate context as well as interaction with the other genes studied. Our study also brought out IGF2BP2, SLC30A8, HHEX, CDKN2A/B, PPARG genes as significantly interacting among them as well as environmental factors such as BMI, alcohol and smoking were found to be interacting with TCF7L2, CDKAL1, CAPN10 genes as well, providing support for gene–gene and gene–environment interactions in the manifestation of T2DM in this population. However, further studies among different Indian populations with relatively large samples are required with an emphasis on gene–gene and gene–environment interactions before one can reach unequivocal conclusions on the nature of gene–gene and gene–environment interactions and/or cumulative effect of the risk alleles of different genes in the Indian population at large, which may help in developing predictive markers for T2DM.
The following are the supplementary data related to this article.
Genotype and allele frequencies for 15 SNPs in the univariate analysis.
Gene–Environment interactions of 9 T2DM genes.
‡ Frequencies based on combination of the risk alleles in T2DM cases and controls from the cumulative analysis.
Acknowledgments
This study is funded by Indian Statistical Institute, India. The authors thank Professor Bimal K. Roy, Director, Indian Statistical Institute for logistic support. We thank Mr. Jayaraj, Subbu Raj and Ms. Kumuda for their help in the collection of blood samples and background information and Dr. JP Kotla for his help and cooperation in collecting blood samples of T2DM patients. Our sincere thanks are due to Dr. Samsiddhi Bhattacharjee (National Institute of Biomedical Genomics-Kalyani) for the valuable suggestions in carrying out the gene–gene and gene–environment interactions using Plink and R programs. We also thank Dr. ALN Murthy (Indian Statistical Institute-Hyderabad) in helping to interpret the interaction results and guiding throughout the cumulative analysis of risk alleles.
References
- American Diabetes Association (ADA) Diagnosis and classification of diabetes mellitus. Diabetes Care. 2010;33(Suppl. 1):62–69. doi: 10.2337/dc10-S062. [DOI] [PMC free article] [PubMed] [Google Scholar]
- Cauchi S., Meyre D., Durand E. Post genome-wide association studies of novel genes associated with type 2 diabetes show gene–gene interaction and high predictive value. PLoS ONE. 2008;3(5) doi: 10.1371/journal.pone.0002031. (e2031) [DOI] [PMC free article] [PubMed] [Google Scholar]
- Chauhan G., Spurgeon C.J., Tabassum R. Impact of common variants of PPARG, KCNJ11, TCF7L2, SLC30A8, HHEX, CDKN2A, IGF2BP2, and CDKAL1 on the risk of type 2 diabetes in 5,164 Indians. Diabetes. 2010;59:2068–2074. doi: 10.2337/db09-1386. [DOI] [PMC free article] [PubMed] [Google Scholar]
- Chen G.B., Xu Y., Xu H.M. Practical and theoretical considerations in study design for detecting gene–gene interactions using MDR and GMDR approaches. PLoS ONE. 2011;6 doi: 10.1371/journal.pone.0016981. (e16981) [DOI] [PMC free article] [PubMed] [Google Scholar]
- Chidambaram M., Radha V., Mohan V. Replication of recently described type 2 diabetes gene variants in a South Indian population. Metabolism. 2010;59(12):1760–1766. doi: 10.1016/j.metabol.2010.04.024. [DOI] [PubMed] [Google Scholar]
- Cho Y.M., Ritchie M.D., Moore J.H. Multifactor-dimensionality reduction shows a two-locus interaction associated with type 2 diabetes mellitus. Diabetologia. 2004;47:549–554. doi: 10.1007/s00125-003-1321-3. [DOI] [PubMed] [Google Scholar]
- Cordell H.J. Detecting gene–gene interactions that underlie human diseases. Nat. Rev. Genet. 2010;10:392–404. doi: 10.1038/nrg2579. [DOI] [PMC free article] [PubMed] [Google Scholar]
- Culverhouse R., Suarez B.K., Lin J. A perspective on epistasis: limits of models displaying no main effect. Am. J. Hum. Genet. 2002;70:461–471. doi: 10.1086/338759. [DOI] [PMC free article] [PubMed] [Google Scholar]
- Falush D., Stephens M., Pritchard J.K. Inferences of population structure using multilocus genotype data: linked loci and correlated allele frequencies. Genetics. 2003;164:1567–1587. doi: 10.1093/genetics/164.4.1567. [DOI] [PMC free article] [PubMed] [Google Scholar]
- Franks P.W. The complex interplay of genetic and lifestyle risk factors in type 2 diabetes: an overview. Scientifica (Cairo) 2012;2012:482186. doi: 10.6064/2012/482186. [DOI] [PMC free article] [PubMed] [Google Scholar]
- Gabriel S., Ziaugra L., Tabbaa D. SNP genotyping using the Sequenom Massarray iPLEX Platform. Curr. Protoc. Hum. Genet. 2009;60:2.12.1–2.12.16. doi: 10.1002/0471142905.hg0212s60. [DOI] [PubMed] [Google Scholar]
- Hahn L.W., Ritchie M.D., Moore J.H. Multifactor dimensionality reduction software for detecting gene–gene and gene–environment interactions. Bioinformatics. 2003;19:376–382. doi: 10.1093/bioinformatics/btf869. [DOI] [PubMed] [Google Scholar]
- Horikawa Y., Miyake K., Yasuda K. Replication of genome-wide association studies of type 2 diabetes susceptibility in Japan. J. Clin. Endocrinol. Metab. 2008;93:3136–3141. doi: 10.1210/jc.2008-0452. [DOI] [PubMed] [Google Scholar]
- Hu C., Zhang R., Wang C. PPARG, KCNJ11, CDKAL1, CDKN2A-CDKN2B, IDE-KIF11-HHEX, IGF2BP2 and SLC30A8 are associated with type 2 diabetes in a Chinese population. PLoS ONE. 2009;4(10) doi: 10.1371/journal.pone.0007643. (e7643) [DOI] [PMC free article] [PubMed] [Google Scholar]
- Kommoju U.J., Reddy B.M. Genetic etiology of type 2 diabetes mellitus: a review. Int. J. Diabetes Dev. Ctries. 2011;31:51–64. [Google Scholar]
- Lango H., UK Type 2 Diabetes Genetics Consortium, Palmer C.N. Assessing the combined impact of 18 common genetic variants of modest effect sizes on type 2 diabetes risk. Diabetes. 2008;57:3129–3135. doi: 10.2337/db08-0504. [DOI] [PMC free article] [PubMed] [Google Scholar]
- Lou X.Y., Chen G.B., Yan L. A generalized combinatorial approach for detecting gene by gene and gene by environment interactions with application to nicotine dependence. Am. J. Hum. Genet. 2007;80:1125–1137. doi: 10.1086/518312. [DOI] [PMC free article] [PubMed] [Google Scholar]
- Mohan V., Sandeep S., Deepa R. Epidemiology of type 2 diabetes: Indian scenario. Indian J. Med. Res. 2007;125:217–230. [PubMed] [Google Scholar]
- Motsinger A.A., Ritchie M.D. Multifactor dimensionality reduction: an analysis strategy for modelling and detecting gene–gene interactions in human genetics and pharmacogenomics studies. Hum. Genomics. 2006;2:318–328. doi: 10.1186/1479-7364-2-5-318. [DOI] [PMC free article] [PubMed] [Google Scholar]
- Ng M.C., Park K.S., Oh B. Implication of genetic variants near TCF7L2, SLC30A8, HHEX, CDKAL1, CDKN2A/B, IGF2BP2, and FTO in Type 2 Diabetes and Obesity in 6,719 Asians. Diabetes. 2008;57:2226–2233. doi: 10.2337/db07-1583. [DOI] [PMC free article] [PubMed] [Google Scholar]
- Pritchard J.K., Stephens M., Donnelly P. Inference of population structure using multilocus genotype data. Genetics. 2000;155:945–959. doi: 10.1093/genetics/155.2.945. [DOI] [PMC free article] [PubMed] [Google Scholar]
- Reddy B.M., Naidu V.M., Madhavi V.K. Microsatellite diversity in Andhra Pradesh, India: genetic stratification versus social stratification. Hum. Biol. 2005;77:803–823. doi: 10.1353/hub.2006.0018. [DOI] [PubMed] [Google Scholar]
- Rees S.D., Hydrie M.Z., Shera A.S. Replication of 13 genome-wide association (GWA)-validated risk variants for type 2 diabetes in Pakistani populations. Diabetologia. 2011;54:1368–1374. doi: 10.1007/s00125-011-2063-2. [DOI] [PubMed] [Google Scholar]
- Sambrook J., Fritschi E.F., Maniatis T. Cold Spring Harbor Laboratory Press; New York: 1989. Molecular Cloning: A Laboratory Manual. [Google Scholar]
- Uma Jyothi K., Jayaraj M., Subburaj K.S. Association of TCF7L2 gene polymorphisms with T2DM in the population of Hyderabad, India. PLoS ONE. 2013;8(4) doi: 10.1371/journal.pone.0060212. (e60212.5) [DOI] [PMC free article] [PubMed] [Google Scholar]
- Uma Jyothi K., Jayaraj M., Subburaj K.S. No detectable association of IGF2BP2 and SLC30A8 genes with type 2 diabetes in the population of Hyderabad, India. MetaGene. 2013 doi: 10.1016/j.mgene.2013.09.003. [DOI] [PMC free article] [PubMed] [Google Scholar]
- Uma Jyothi K., Jayaraj M., Subburaj K.S. Association of IRS1, CAPN10, and PPARG gene polymorphisms with type 2 diabetes mellitus in a high-risk population in Hyderabad, India. Journal of Diabetes. 2014;6:564–573. doi: 10.1111/1753-0407.12142. [DOI] [PubMed] [Google Scholar]
- Wu Y., Li H., Loos R.J. Common variants in CDKAL1, CDKN2A/B, IGF2BP2, SLC30A8, and HHEX/IDE genes are associated with type 2 diabetes and impaired fasting glucose in a Chinese Han Population. Diabetes. 2008;57:2834–2842. doi: 10.2337/db08-0047. [DOI] [PMC free article] [PubMed] [Google Scholar]
Associated Data
This section collects any data citations, data availability statements, or supplementary materials included in this article.
Supplementary Materials
Genotype and allele frequencies for 15 SNPs in the univariate analysis.
Gene–Environment interactions of 9 T2DM genes.
‡ Frequencies based on combination of the risk alleles in T2DM cases and controls from the cumulative analysis.