

Abstract
Cross sections for 61 palmitoylated peptides and 73 cysteine-unmodified peptides are determined and used together with a previously obtained tryptic peptide library to derive a set of intrinsic size parameters (ISPs) for the palmitoyl (Pal) group (1.26 ± 0.04), carboxyamidomethyl (Am) group (0.92 ± 0.04), and the 20 amino acid residues to assess the influence of Pal- and Am-modification on cysteine and other amino acid residues. These values highlight the influence of the intrinsic hydrophobic and hydrophilic nature of these modifications on the overall cross sections. As a part of this analysis, we find that ISPs derived from a database of a modifier on one amino acid residue (CysPal) can be applied on the same modification group on different amino acid residues (SerPal and TyrPal). Using these ISP values, we are able to calculate peptide cross sections to within ± 2% of experimental values for 83% of Pal-modified peptide ions and 63% of Am-modified peptide ions. We propose that modification groups should be treated as individual contribution factors, instead of treating the combination of the particular group and the amino acid residue they are on as a whole when considering their effects on the peptide ion mobility features.
Introduction
Advances in peptide identification by mass spectrometry (MS) and tandem MSMS methods have dramatically improved the analysis of complex mixtures of proteins.1,2 However, various co- and post-translational modifications that occur naturally, as well as modifications that occur as a part of sample work-up [e.g. the alkylation of cysteine (Cys)3 and isotopic labeling of peptides for quantitative proteomics4,5,6], may complicate these analyses. Many alternations may occur in low concentrations; in addition, chemical modifications may decrease ionization efficiency, and introduce complexities in assignments of sequences.7,8
Recently, ion mobility spectrometry (IMS) measurements of peptide ions have been introduced as a means to complement MS-MS-based peptide ion assignments.9,10,11,12,13,14 The IMS approach introduces mass-independent constraints based on the peptide cross section (Ω). From large numbers of cross section measurements it is possible to assess average contributions of each amino acid to the overall size by the derivation of intrinsic size parameters (ISP) for individual amino acids.9,10,11,12,13–14 Amino acid size parameters have now been derived for a range of polypeptide chain lengths, charge states, as well as for polypeptide chains that are ionized with a range of different cations -e.g., hydrogen,9,10,11–12 alkali metal,13 alkaline-earth metal14, and transition metal.15 Once these values are determined, it is possible to use the ISP values to calculate cross sections for peptide sequences that have not been observed previously; such an approach provides a mass-independent parameter that can be used to test the veracity of assignments based on MS and MS-MS data, thus improving the reliability of such analyses.12,16
In this paper, we present a first step in extending the use of ISPs to include peptide modifications. The effect of modification groups on peptide structures in the gas phase has attracted some interest.17–18,19,20,21,22,23 For example, phosphorylation typically causes peptides to adopt structures that are more compact than non-phosphorylated peptide structures, even when differences in molecular weight are considered.17,18 To date, IMS measurements have also been applied as a means of assessing locations of chemical cross-linking,19 phosphorylation,20,21 glycosylation22, and methylation.23 The work presented below focuses on two types of proteomics modifications found primarily on cysteine residues: carboxyamidomethylation3,24,25 (designated as CysAm or CAm), and palmitoylation (designated as CysPal or CPal). Palmitoylation can also occur on hydroxyl- and amino-groups such as those found on serine, threonine, tyrosine, lysine, and the amino terminus, especially when glycine is the first residue.26 Example structures of the CysAm residue and several palmitoylated residues (CysPal, ThrPal and GlyPal) are shown in Figure 1.
Figure 1.

Sample molecular structures and reaction schematics for the carboxyamidomethylation (Am) or palmitoylation (Pal) modifications. (a) Carboxyamidomethylated cysteine residue (CysAm). (b) Palmitoylated cysteine residue (CysPal), with the modification on the thiol group. (c) Palmitoylated threonine residue (ThrPal), with the modification on the hydroxyl group. (d) N-palmitoylated glycine residue (GlyPal), with the modification on the N-terminus of a peptide or protein. (e) Palmitoyl coenzyme A (Pal-CoA). (f) Palmitoylation reaction schematics. (f-1) Reaction via palmitoyl chloride in TFA solution. (f-2) Reaction via Pal-CoA in pH 8.0 phosphate buffer.
The CysAm modification is among the most common that is observed in proteomics studies. This modification is often introduced during sample workup upon addition of excess iodoacetamide (IAM). The irreversible alkylation reaction provides a modification that acts as a protecting group, preventing the reformation of disulfide bonds.3,24,25 Below, we derive an ISP value for the Am modification to be 0.92 ± 0.04, which is smaller than the average intrinsic size (1.00, by definition) that is based on the correlation of molecular weight with peptide size. This result is consistent with our previous findings that hydrophilic residues27 usually have small ISP values9,10,11,12,13–14 because the polar side chains associated with these residues undergo strong interactions with protonated sites, causing an overall compaction of the peptide structure.
Palmitoylation is a naturally occurring modification that involves covalent addition of the hydrophobic palmitate group (CH3(CH2)14CO-) to various amino acid residues (as described above) on proteins.26 This modification has been implicated in regulation of trafficking,26 cellular localization,28 and activity of many intracellular signaling proteins.29,30 Like phosphorylation,31 the modification site for palmitoylation is not limited to one position. Palmitoylation errors (e.g., sites that do not get modified, or sites that are incorrectly modified) can affect cell growth and neuronal development.32 We have derived the ISP value for this highly hydrophobic26 Pal group to be 1.26 ± 0.04. This is consistent with our previous observations that the intramolecular interactions involving hydrophobic residues are relatively weak. Thus, an abundance of these residues in a peptide sequence often leads to these peptides to have larger overall cross sections.9,10,11,12,13–14
At this point, the inclusion of size parameters as an orthogonal test of sequence veracity based on MS and MS-MS analysis is at an early stage.12,16 In earlier work, we used this approach on a commercial IMS-MS instrument and reported a scoring scheme that includes size parameter variables.12 This scheme showed a modest but significant improvement in assisting peptide and protein identification in proteomics research. The ability to include parameters for modified amino acids will extend the utility of this type of approach to many peptides that could not be assessed previously.
Experimental Section
Peptide synthesis
Specific sequences for peptides containing cysteine residues originated from known palmitoylated proteins within several online protein databases [Swiss-Prot (Release 2011_8),33 Protein Data Bank (January 2012),34 and Human Protein Reference Database (Release 9),35] or from membrane proteins predicted by an in-house computational algorithm. All Cys-containing peptides were synthesized by standard solid-phase Fmoc chemistry36 with an Aapptec 396 robotic synthesizer (Aapptec, Louisville, KY) at a 0.05 mmol scale. In brief, the N-terminal deprotection was conducted with 25% (v:v) piperdine in dimethylformamide (DMF), followed by rinsing and coupling cycles with 0.5 mL of 0.5 mmol·mL−1 Fmoc-protected amino acid in N-methyl-2-pyrrolidone (NMP), 0.5 mL of 1.0 mmol·mL−1 DEPBT [3-(diethoxyphosphoryloxy)-1,2,3-benzotriazin-4(3H)-one] in DMF and 0.15 mL N,N-diisopropylethylamine (DIPEA) for 1 hour. After synthesis, peptides were cleaved from the resin with 0.8 mL of cleavage mixture [90:2.5:2.5:2.5:2.5 of trifluoroacetic acid (TFA):triisopropylsilane (TIS):2,2'-(ethylenedioxy)-diethanethiol (DET):thioanisole:methanol] for 2 hrs at ~300 K. The resultant peptides were precipitated and washed with ethyl ether. Wang resin, protected Fmoc amino acids and DEPBT were purchased from Aapptec (Louisville, KY). All solvents described above were purchased from EMD Chemicals (Gibbstown, NJ). All other reagents were purchased from Sigma-Aldrich (St. Louis, MO).
Synthesis of Pal- and Am-modified peptides
Two methods for palmitoylation were used. The first is nonspecific for the palmitoylation of thiol and hydroxyl groups present in peptides. This reaction was performed using a procedure described by Yousefi-Salakdeh et al.37 The reaction scheme for this modification is shown in Figure 1. Briefly, ~1.5 mg of peptide was dissolved in 80 μL dry TFA, and 40 μL palmitoyl chloride (Sigma-Aldrich, St. Louis, MO) was added into the peptide solution. The reaction mixture was slowly stirred at ~300 K for ~12 hrs and quenched with 1 mL diethyl ether to precipitate the product from solution. The resulting precipitate was washed again with 1 mL diethyl ether, collected via centrifuge, and then dissolved in 1:1 acetonitrile:water with 0.1% formic acid to a final concentration of ~0.1 mg·mL−1. This solution was used for testing without further purification.
The second method is selective to only modify thiol groups. This reaction scheme is displayed in Figure 1. Here, unmodified peptides are dissolved in 40:60 water:acetonitrile (v:v ratio) to a concentration of ~1 μmol·mL−1. Phosphate reaction buffer (pH 8.0) was prepared to contain 25 mmol·L−1 sodium-phosphate, 0.1 mmol·L−1 ethylenediaminetetraacetic acid (EDTA) and 0.1 mmol·L−1 tris(2-carboxyethyl)phosphine (TCEP). 10 μL of peptide solution was added into 80 μL reaction buffer, followed by the addition of 10 μL of 5 μmol·mL−1 palmitoyl coenzyme A lithium salt (Pal-CoA, see Figure 1 for structure) water solution. The reaction was performed at 37°C for 4–24 hours. The product was extracted by solid phase extraction with NuTip (Glygen Corp, Columbia, MD) and washed 4 times with 25 μL water. Elution of the product was achieved with three rounds of washing: twice with 20 μL 70:30 acetonitrile:water and a final round with 20 μL 95:5 acetonitrile:water. Water was added to a final volume of 1:1 acetonitrile:water. All of the solvents used in the solid phase extraction procedure contained 0.1% formic acid, including the final solution. This final solution was used for mass spectrometric measurements without further purification. EDTA, TCEP, sodium phosphate and Pal-CoA were obtained from Sigma Aldrich (St. Louis, MO). All other solvents were purchased from EMD Chemicals (Gibbstown, NJ).
All Am-modified peptides are produced by a reaction with IAM under standard conditions using a protocol described in detail previously.12 Briefly, 10 to 100 mg of select proteins were suspended in 2 mL of 200 mmol·L−1 ammonium bicarbonate solution containing 6 mol·L−1 urea. A solution of 100 mmol·L−1 dithiothreitol (DTT) was added in a 40:1 (DTT:protein) molar ratio and incubated for 2 hrs at 37 °C to reduce disulfide bonds. A 100 mmol·L−1 IAM solution was added at a 80:1 (IAM:protein) molar ratio, followed by incubation at 4 °C for 2 hrs in darkness to carboxyamidomethylate Cys thiol groups. Free Cys was added in a 40:1 (cysteine:protein) ratio at 25 °C for 30 min to quench excess IAM. A 200 mmol·L−1 ammonium bicarbonate solution was added to decrease the urea concentration to 2 mol·L−1 prior to addition of TPCK-treated trypsin at a 1:50 trypsin:protein weight ratio. This reaction was performed for ~24 hrs at 37 °C to produce tryptic peptides. Ammonium bicarbonate, urea, DTT, IAM, cysteine, and trypsin were purchased from Sigma-Aldrich Co. (St. Louis, MO).
Instrumentation and cross section measurements
Figure 2 shows a schematic of the home-built IMS-MS instrument used for this study. Detailed descriptions of this instrument and nested ion mobility-MS measurements have been provided previously,38,39 and only a concise description is presented here. Briefly, electrospray ionization (ESI) was used to create peptide ions that were introduced into an hour-glass geometry ion funnel (F1),40,41 where they were accumulated and periodically gated into the drift tube assembly (D1 and D2, with a total length of ~183 cm). The ions migrated through D1 and D2 under the influence of a uniform electric field (~10 V·cm−1) and collided with the He buffer gas (ultrahigh purity, Airgas, Radnor, PA) at a pressure of ~3 Torr and a temperature of ~300 K. The ion packets were radially focused through the two ion funnels (F2 and F3). Upon exiting F3, the mobility separated ions were introduced into the high-vacuum region, where they were orthogonally extracted into a time-of-flight mass spectrometer and then mass analyzed. The data collection time for each sample was ~5 min. The ion mobility resolving power (defined as R = t/Δt where Δt is measured at the full-width-at-half-maximum) for a typical peptide ion peak in the +2 charge state was ~80.
Figure 2.
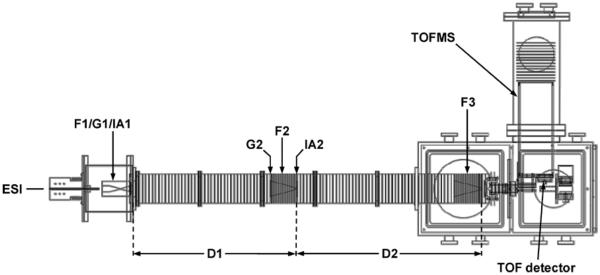
Schematic diagram of the IMS-MS instrument used in this study. Ion gates (G1 and G2), funnels (F1, F2, and F3), and activation regions (IA1 and IA2) are labeled. See text for details of instrument operation.
Calculation of collision cross sections
Experimental drift times (tD) are converted to cross sections (Ω) using equation 1,42
| (1) |
In this equation, the variable ze represents the charge of the ion, kb is the Boltzmann's constant, mI is the ion mass, mB is the mass of the buffer gas, E is the electric field, L is the drift tube length, P is the buffer gas pressure, T is the temperature, and N is the neutral number density of the buffer gas under standard temperature and pressure. All measurements made in this study were calibrated to bradykinin and polyalanine (Sigma-Aldrich, St. Louis, MO) to account for day-to-day variations in experimental conditions and RF voltage used in the ion funnels,43,44 with a relative uncertainty less than 1%.
Results and Discussion
Ion mobility distributions
Figure 3 displays an example ESI-IMS-MS dataset for an equimolar mixture of two peptides containing a Cys residue or the CysAm or CysPal modification. General distribution characteristics of these doubly-protonated peptide ions (generally defined as [Pep+2H]2+) can be observed from the plot. Pal-modified peptides [VLLCPalLK+2H]2+ and [VLLQCPalLK+2H]2+ have a large shift in m/z (119.11 Th) as well as drift time (2.58 ms and 2.70 ms, respectively) upon comparison to the respective unmodified species. On a general trend, the drift time distributions for typical Pal-modified peptides are relatively broader, reflected by the lowering of the IMS resolutions as comparing to their unmodified counterparts. For example, the mono Pal-modified and unmodified peptides listed in Table 1, the peak resolution is 83±20 and 98±18, respectively. This fact suggests that this palmitoylation increases the range of structures that the peptide can adopt. We speculate that this may reflect the flexible nature of the long C16 hydrocarbon chain in the palmitoyl group. The Am-modified peptides [VLLCAmLK+2H]2+ and [VLLQCAmLK+2H]2+ show smaller increases in both m/z (28.51 Th) and drift time (0.42 ms and 0.36 ms, respectively) upon comparison to the respective unmodified species.
Figure 3.

Nested IMS-MS dot plots of the electrosprayed mixture of two peptide sequences containing Cys, CysAm, or CysPal residues. The sample concentration of each component is ~0.01 mg·mL−1 in 1:1 water:acetonitrile with 0.1% formic acid. The intensities of different features are represented using a false color scheme where the least intense features are shown in dark blue and the most intense are shown in red. The compressed mass spectrum displayed on the left is obtained by integrating across the entire range of m/z for each drift time. Drift time distributions are normalized to the peak height and overlayed for each peptide ion (VLLQC*LK and VLLC*LK are displayed in yellow and white, respectively). Within each sequence, C* annotates the modification site as the Cys residue. A branched scheme refers to peaks that correspond to each variable modification [unmodified (Cys) or modified with a carboxyamidomethyl (Am) or palmitoyl (Pal) group].
Table 1.
Cross sections of selected [Pep+2H]2+ palmitoylated peptide ions.
| Peptide sequencea | # of residues | Unmodified peptide mass (Da)b | Unmodified peptide Ω (Å2) | Pal-peptide mass (Da)c | Pal-peptide Ω (Å2) | ΔΩ (Å)d | # of Pal group(s) | ΔΩ per Pal group (Å2) |
|---|---|---|---|---|---|---|---|---|
| CHDFR | 5 | 676.28 | 185.4 | 914.51 | 239.3 | 53.9 | 1 | 53.9 |
| MGCDR | 5 | 580.21 | 173.7 | 818.44 | 217.7 | 44.0 | 1 | 44.0 |
| MCILK | 5 | 606.32 | 182.1 | 844.55 | 230.2 | 48.2 | 1 | 48.2 |
| MACLK | 5 | 564.28 | 179.3 | 802.50 | 218.0 | 38.7 | 1 | 38.7 |
| CENLVK | 6 | 704.35 | 192.6 | 942.58 | 242.9 | 50.3 | 1 | 50.3 |
| MACLLR | 6 | 705.37 | 203.8 | 943.59 | 248.2 | 44.4 | 1 | 44.4 |
| HGCIVK | 6 | 655.35 | 204.8 | 893.57 | 249.2 | 44.4 | 1 | 44.4 |
| FCFPLK | 6 | 753.39 | 219.9 | 991.61 | 262.4 | 42.5 | 1 | 42.5 |
| VCHCLGK | 7 | 758.36 | 199.8 | 1234.81 | 295.0 | 95.2 | 2 | 47.6 |
| DFCFPLK | 7 | 868.42 | 223.6 | 1106.64 | 267.0 | 43.4 | 1 | 43.4 |
| MPLACLR | 7 | 802.42 | 223.6 | 1040.64 | 262.3 | 38.7 | 1 | 38.7 |
| MTVCGGK | 7 | 694.31 | 182.2 | 1170.76 | 279.3 | 97.1 | 2 | 48.6 |
| VGIHLCIK | 8 | 881.52 | 228.5 | 1119.75 | 275.2 | 46.7 | 1 | 46.7 |
| MPALACLR | 8 | 873.46 | 228.3 | 1111.68 | 269.9 | 41.6 | 1 | 41.6 |
| IPCCPVNLK | 9 | 985.51 | 232.3 | 1461.96 | 323.1 | 90.7 | 2 | 45.4 |
| VIEVVQGACR | 10 | 1072.57 | 240.2 | 1310.80 | 290.5 | 50.3 | 1 | 50.3 |
| IAFQELLCLR | 10 | 1204.66 | 271.6 | 1442.89 | 315.6 | 44.0 | 1 | 44.0 |
| Average ΔΩ per Pal group: | 45.5 ± 4.1 | |||||||
Bold letters indicate palmitoylation sites.
Peptide masses are calculated from the molecular compositions.
Palmitoylated peptide masses are calculated from the molecular compositions. The number and location of the palmitoylation sites in the amino acid sequence are provided.
ΔΩ is the change in cross section after palmitoylation, defined as: ΔΩ = ΩPal peptide − Ωunmodified peptide
Range of cross sections upon Cys modification
Figure 4 displays the cross sections for [Pep+2H]2+ peptide ions as a function of molecular mass. The data shown here combines these new Cys-containing and palmitoylated [Pep+2H]2+ peptide cross sections with a database of cross sections (inclusive of 64 CysAm-containing peptides) generated by our group.15 Most palmitoylated peptide ions (~96%) have cross sections that are above the regression curve (second-order) for the range of [Pep+2H]2+ ions. Conversely, the majority of Am-modified peptide ions (~75%) have cross sections that are below this regression curve. This shows that the modification can significantly impact the structure of the ion, independent of the additional mass added to the precursor peptide.
Figure 4.

Cross sections as a function of molecular mass for [Pep+2H]2+ ions. The range of cross sections at a given molecular mass is displayed for [Pep+2H]2+ ions that are Pal-modified (red squares), Am-modified (black circles) or absent a chemical modification (blue triangles). A second-order molecular weight fit for all peptide ions is displayed over the data (black line). The inset shows an expanded region (overlayed dashed black square) of this relation of cross section for a given molecular mass.
Complete lists of cross sections of primary features for 72 unmodified Cys- and 61 Pal-modified peptide ions and are located in Supplemental Tables 1 and 2, respectively. The supplemental tables contain information on the peptide sequence, mass, charge, peptide length, sites of modified residues, number of modifications, and cross sections. Changes in cross section for peptide sequences following palmitoylation are listed in Table 1. These peptides were selected as a subset of the data to reflect the range of peptide length with the number and location of palmitoylation site(s). The addition of the palmitoyl group to this selected peptide dataset contributes an additional average cross section of ~45.5 ± 4.1 Å2 (comparable to the values obtained for the entire dataset). This significant change to the cross section accounts only for the addition of the Pal group, irrespective of the amino acid residue (Cys or Thr) that is modified or the number of palmitoyl groups added.
Table 2.
Intrinsic size parameters (ISP) for individual components for doubly-protonated peptide ions.
| individual component | ISPa | individual component | ISPa |
|---|---|---|---|
| Gly | 0.93 (0.02) | Asp | 0.93 (0.02) |
| Pro | 1.00 (0.02) | Glu | 0.93 (0.02) |
| Ala | 0.96 (0.01) | Asn | 0.91 (0.02) |
| Val | 1.02 (0.02) | Gln | 0.94 (0.03) |
| Ile | 1.07 (0.02) | Ser | 0.95 (0.02) |
| Leu | 1.13 (0.01) | Thr | 0.93 (0.02) |
| Met | 1.08 (0.03) | Cys | 0.96 (0.03) |
| His | 1.11 (0.03) | Lys | 0.96 (0.02) |
| Phe | 1.04 (0.02) | Arg | 1.02 (0.03) |
| Tyr | 0.99 (0.03) | Amb | 0.92 (0.04) |
| Trp | 0.95 (0.04) | Palc | 1.26 (0.04) |
Intrinsic size parameters (ISP) are calculated from 406 [Pep+2H]2+ ions, combining the measurements provided here with a database by Dilger, et al.15 The [Pep+2H]2+ subset was limited to pentapeptides or larger with sequences that terminate in Lys or Arg. Reduced cross sections were generated by division of the experimental cross section with a second-order polynomial of Ω = −1.53E-5x2 + 0.1834x + 73.7590, where x is the molecular mass. The uncertainty is listed in parenthesis and represents one standard deviation about the mean. Please see text for details and references on the derivation of the ISP values and the errors.
“Am” represents the carboxyamidomethyl group.
“Pal” represents the palmitoyl group.
Derivation of intrinsic size parameters
The method to determine ISP values for individual amino acid residues has been described in detail previously.12,13–14, 15 In this work, we expand upon this derivation to include the Am and Pal modifications as additional components in the analysis. To begin, the reduced cross section is calculated for each peptide ion as defined in equation 2:
| (2) |
Here, Ωi and yi represent the experimental and reduced cross section, respectively, for each peptide ion sequence i. Ωexpected is the cross section derived from a second-order polynomial fit of cross sections and peptide molecular masses that is obtained for a dataset inclusive of these new measurements reported here combined with the reported major features from our [Pep+2H]2+ database.15
The reduced cross sections can be related to a set of equations of the sum product of the intrinsic size parameters and the frequency of occurrence for each component for each specific peptide sequence, as defined by equation 3:
| (3) |
Here, j corresponds to each unknown parameter and ranges from 1 through n, where n is equal to the total number of individual components (22 in this analysis to include each of the 20 natural amino acids plus the Am and Pal groups). The variable Xij represents the frequency of occurrence of each component (j) in each sequence (i). The variable pj represents the intrinsic size parameter of each component j. This system of linear equations was set to solve for each best-fit pj using a linear least-squares regression. The uncertainty in the parameters is calculated as the square root of the variance and represents the standard deviation. These calculations were performed with the Matlab Software Suite (MathWorks Inc., Natick, MA).
Previous ISP derivations have defined CysAm as an individual variable to describe the size contribution for this specific residue. The number of Cys-containing peptides in these databases was limited, prohibiting the ability to derive a separate Cys ISP without a large associated error. With the number of cross sections provided here for Cys-containing peptides, it becomes possible to separate the Am and Pal modification groups as separate ISP components from Cys. For example, our previous treatment of the peptide sequence Ile-Asn-His-CysAm-Arg would define an equal frequency of occurrence (equal to 0.2) for each of the five residues to be parameterized. In this work, we would assign this peptide with six individual components: each of the five amino acid residues (Ile, Asn, His, Cys, and Arg) plus the Am modification group.
Table 2 gives the derived ISP values with the amino acid residues and Am and Pal modifications derived as individual components. Subsets of cross sections for these derivations are limited to those sequences that are pentapeptides or larger and terminate with either Lys or Arg. These intrinsic size parameters for individual amino acid residues are largely consistent with previous ISP derivations for protonated peptide ions.12,13,14–15
Contribution to cross section for modification groups
Figure 5 shows the values for the intrinsic size parameters derived for each component described above. The individual components that are parameterized are classified with the modification groups (Am and Pal) separated from the amino acid residues, which are classified into subgroupings of similar residue R-groups based on similarities in polarity and structure. Generally, the nonpolar aliphatic residues have larger ISP values, indicating an increased contribution to the cross section. The polar aliphatic residues have ISP values <1.00, indicating a contraction to the cross section. The aromatic residues have intermediate ISP values. Within each residue subgroup, the ISP values generally increase with the length of the side chain.
Figure 5.
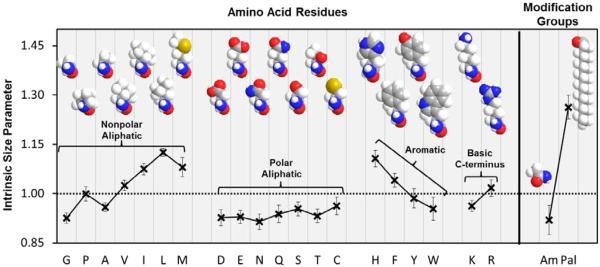
Intrinsic size parameters derived from [Pep+2H]2+ ions (pentapeptides or longer). The intrinsic size parameters have been organized into regions for amino acid residues and residue modifications. The amino acid residues are further grouped into subclassifications of amino acids on the basis of similarities in the side chain. Error bars represent one standard deviation from the mean. Space-filling models of the atomic structures for amino acid residues and the Pal/Am modifications are supplied to give a sense of scale with differences in size and polarity. Gray, blue, red, yellow, and white balls represent carbon, nitrogen, oxygen, sulfur, and hydrogen atoms, respectively.
The ISP value for the Pal group (1.26 ± 0.04) is significantly larger than any other component that was parameterized. This large contribution to the cross section is explained by the long, nonpolar hydrocarbon chain of the palmitoyl group. This group is much more hydrophobic than any other amino acid residue or modification presented here, therefore explaining its much larger intrinsic size parameter. This large Pal group ISP is also consistent with the general trend of larger ISP values for nonpolar aliphatic residues for increasing lengths of the side chain.9,10,11,12,13–14 Conversely, the Am group has a much smaller ISP of 0.92 ± 0.04 that is similar to the ISP values of the polar aliphatic residues. These values are explained by the polar carboxamide within the Am group. This modification would augment the peptide to become increasingly polar, enabling stronger interactions of the polar groups with the charge site. The ISP value for the Am group is comparable to the ISP values for the carboxamine-containing residues of Asn and Gln (0.91 ± 0.02 and 0.94 ± 0.03, respectively).
This new component ISP derivation also gives the ability to readdress the contribution to the cross section for the Cys residue. Previously, ISP values were derived excluding the Cys residue due to a limited number of measurements for Cys-containing peptide cross sections. Rather, the CysAm residue was treated as its own variable (reported to be 0.86 ± 0.04).12 The number of cross sections added here for Cys-containing peptides enables the parameterization of this unmodified residue. The ISP of Cys is reported here to be 0.96 ± 0.03, which is significantly larger than the CysAm ISP. We interpret this result as the Am modification increasing the relative polarity of the Cys residue. It is also interesting to note that the Cys ISP is comparable to the ISP of Ser (0.95 ± 0.02), which differs only with a sulfur atom in the Cys thiol rather than an oxygen atom in the Ser hydroxyl group.
Finally, we note that these added cross sections to the [Pep+2H]2+ database has further decreased the ISP standard deviations reported previously for the individual amino acid residues.10,13 This observation supports our treatment of the modification groups as individual components in the ISP derivation. Interestingly, it has also yielded a significant difference in the ISP values for the isomeric residues of isoleucine (Ile) and leucine (Leu) (1.07 ± 0.02 and 1.13 ± 0.01, respectively). As such, these ISP values may be able to significantly improve upon the false discovery rate for proteomic scoring12 between sequences containing these isomeric residues as it is often difficult to differentiate between Ile and Leu with the low energy MS-MS conditions typically used in proteomics studies.45,46
Application of ISP values for the prediction of cross sections for modified peptides
The mobility-derived ISP values can be used to competently predict cross sections as a means to independently substantiate the sequence identification obtained via MS-MS techniques.9,10,11,12,13–14 One way to assess this predictive power is through retrodictive comparisons of the ISP-derived cross sections to those derived using a molecular weight fit. Figure 6 shows the potential to improve the predictive accuracy using the ISP values in comparison to the [Pep+2H]2+ molecular weight fit for Pal- and Am-modified peptides. Ratios between the retrodicted and experimental cross sections for [Pep+2H]2+ ions are used to illustrate the ability of the ISP values to more accurately predict the cross section. Retrodictions for Pal-modified peptides using the ISP values yield ~83% (44 out of 53 peptide ions) to be within ± 2% of the measured cross sections. This is in stark contrast to the ~13% (7 out of 53 peptide ions) that are predicted within ± 2% predicted from the molecular weight fit. It is noteworthy that for the majority of the Pal-modified peptides, the molecular weight fit cross section to experimental cross section ratios are lower than 1.00, with an average of 0.96±0.02. This offset is caused by the general hydrophobic nature of the Pal-modified ions. Even if the averaged ratio is used as the criteria, only ~66% (35 out of 53 peptide ions) are within the ± 2% of the averaged range. The ISP retrodictions still offer a significant improvement over molecular weight fit for cross section prediction. ISP retrodictions for Am-modified peptides yielded ~63% (37 out of 59 peptide ions) to be within ± 2% of the measured values; a modest improvement to the ~39% (23 out of 59) using the molecular weight fit. As such, a ~6.3 fold increase in prediction power is noted for the palmitoylated peptide ions with the ISP retroctions with a ~1.6 fold increase for Am-modified peptide ions.
Figure 6.

Prediction accuracy scatter plot for [Pep+2H]2+ ions modified with a Pal (empty squares) or an Am group (filled circles). Retrodictions are produced by a molecular weight fit for (a) Pal- and (b) Am-modified peptide ions (pentapeptides or longer). ISP retrodictions are displayed for these respective peptides in (c) and (d). Dotted lines indicate where the retrodicted values are within 2% of experimental values.
With such a large increase in prediction power for palmitoylated peptides, it is interesting to consider the use of cross sections as a filtering device to improve peptide sequence assignment. Similar mobility-derived analyses have been reported for phosphopeptides.17,18 If one were to define the filtering criterion for palmitoylated peptides in our dataset to have a reduced cross section ≥ 1.00, then ~50% of all potential candidates are eliminated while retaining >95% of true palmitoylated peptides.
Bona fide prediction of palmitoylated [Pep+2H]2+ ion cross sections
The prediction power of these new ISP values (derived by treating modification groups as individual components) was assessed with the synthesis and measurement of cross sections for a new set of Pal-modified peptide sequences. These experimental and predicted cross sections for these Pal-modified peptide ions are reported in Table 3. The individual palmitoylation of Cys, Ser, Thr, and Tyr are all represented within this dataset. For each [Pep+2H]2+ ion, the predicted cross sections is within ± 2% of the experimental cross section (with an average absolute difference of 0.9%). This improved predictive power is evident, regardless of the residue that is palmitoylated.
Table 3.
Bona fide prediction of experimental cross sections for palmitoylated peptides
| Peptide sequencea | # of residues | Pal-peptide mass (Da)b | Ωexperimental (Å2) | Ωpredicted (Å2)c | Difference (%)d |
|---|---|---|---|---|---|
| LFVALQGCDK | 10 | 1330.79 | 296.2 | 295.1 | 0.4 |
| GHLNLMVCIK | 10 | 1364.83 | 304.6 | 298.8 | 1.9 |
| LHVLINMCGK | 10 | 1364.83 | 308.4 | 306.3 | 0.7 |
| AYPHFCAFAR | 10 | 1657.99 | 352.1 | 353.2 | −0.3 |
| LLFGPCILNR | 10 | 1382.86 | 315.7 | 317.9 | −0.7 |
| GHLLMVCIK | 9 | 1250.79 | 291.5 | 285.9 | 1.9 |
| IGALLVCR | 8 | 1081.73 | 270.8 | 274.1 | −1.2 |
| IGAPLVCR | 8 | 1065.69 | 259.5 | 257.5 | 0.8 |
| MAWPCISR | 8 | 1438.89 | 324.9 | 328.0 | −1.0 |
| MGCFFSK | 7 | 1294.80 | 301.1 | 301.3 | −0.1 |
| MGGCTK | 6 | 1071.70 | 265.2 | 262.5 | 1.0 |
Bold letters indicate the number and location of the palmitoylation sites in the peptide sequence.
Palmitoylated peptide masses are calculated from corresponding molecular compositions.
Cross sections here are predicted from ISP values provided in Table 2.
Difference percentage is defined by:
Finally, it is important to note that the treatment described for this new component-based ISP derivation for modification groups would also lessen the burden of data acquisition for other commonly encountered modification groups for specific residues. For example, in quantitative proteomics studies, various isotopically labeled modification groups are artificially added to the N-terminus and the ω-amino group on lysine.5,6–7 It would be computationally expensive to apply ISPs that describe each differing residue as its own variable (to include each residue with and without modifications). Application of the modification groups as individual components in the ISP derivation only adds a single additional variable for each new modification group to the parameterization set, thus also reducing the computational workload required to score the sequence identification using the ISP-applied size influence for the residues comprising the sequence.
Summary and conclusions
This work presents an initial database of cross sections of 61 palmitoylated peptides and 73 cysteine-unmodified peptides. Cross sections were measured from IMS-MS experiments of the synthesized peptides. This expansion in the database allows for us to readdress the Cys residue, with calculations of ISP values for the Cys residue (0.96 ± 0.03) in addition to the modification groups of Pal (1.26 ± 0.04) and Am (0.92 ± 0.04).
Modification groups, instead of the combination of modified groups and the corresponding amino acid residues, are treated as individual contribution factors. Such treatment has shown satisfactory prediction for more than their original derivation sites. Cross sections for SerPal- and TyrPal-containing peptides can be predicted with ± 2% accuracy from ISPs derived from mostly CysPal peptides. This could potentially remove substantial data acquisition burden if IMS behaviors are to be probed for some other modification groups. For example, for any given isobaric labeling reagent for quantitative proteomics, there are 20 different amino acids that could be at the N-terminus, plus the amino group on ω-lysine, therefore 21 combinations in total.5,6–7 And for phosphorylation studies, the phosphate group can be on Ser, Thr, Tyr, His, Arg and Lys.47 To probe all of the combinations would be tedious and demanding, yet to obtain enough data for a mixture of the combinations would be much more reasonable.
Finally, the ability of the ISPs to predict cross sections for modified peptides is demonstrated with [Pep+2H]2+ Pal- and Am-modified peptides. Using a criterion that calculated values are within ± 2% of experimental values, we find that 83% of palmitoylated peptide ions fall into the ISP derived prediction range, as compared to 13% from molecular weight predictions; similarly, 63% of values for calculated carboxyamidomethylated peptide ions are within ± 2% of experimental values, while only 39% of values fall within this range when cross sections are based only on molecular weight fits. Overall, these new intrinsic size parameters significantly extend the range of putative sequence assignments that can be subjected to enhanced scoring schemes that include additional size parameter variables.
Acknowledgement
The authors are grateful for funding from NIH R01 LM009722-06A1, and NIH R01 GM103725-04.
References
- 1.Hunt DF, Yates JR, 3rd, Shabanowitz J, Winston S, Hauer CR. Protein sequencing by tandem mass spectrometry. Proc. Natl. Acad. Sci. U S A. 1986;83(17):6233–7. doi: 10.1073/pnas.83.17.6233. [DOI] [PMC free article] [PubMed] [Google Scholar]
- 2.Cutillas PRT, John F. LC-MS/MS in Proteomics: Methods and Applications. Vol. 658. Springer; London, UK: 2010. [Google Scholar]
- 3.Henschen A. Analysis of Cyst(e)ine Residues, Disulfide Bridges, and Sulfhydryl Groups in Proteins. In: Wittmann-Liebold B, Salnikow J, Erdmann V, editors. Advanced Methods in Protein Microsequence Analysis. Springer Berlin Heidelberg; 1986. pp. 244–255. [Google Scholar]
- 4.Ross PL, Huang YN, Marchese JN, Williamson B, Parker K, Hattan S, Khainovski N, Pillai S, Dey S, Daniels S, Purkayastha S, Juhasz P, Martin S, Bartlet-Jones M, He F, Jacobson A, Pappin DJ. Multiplexed protein quantitation in Saccharomyces cerevisiae using amine-reactive isobaric tagging reagents. Mol. Cel. Proteomics. 2004;3(12):1154–1169. doi: 10.1074/mcp.M400129-MCP200. [DOI] [PubMed] [Google Scholar]
- 5.Kleifeld O, Doucet A, Prudova A, Keller UAD, Gioia M, Kizhakkedathu JN, Overall CM. Identifying and quantifying proteolytic events and the natural N terminome by terminal amine isotopic labeling of substrates. Nat. Prot. 2011;6(10):1578–1611. doi: 10.1038/nprot.2011.382. [DOI] [PubMed] [Google Scholar]
- 6.Guryca V, Lamerz J, Ducret A, Cutler P. Qualitative improvement and quantitative assessment of N-terminomics. Proteomics. 2012;12(8):1207–1216. doi: 10.1002/pmic.201100430. [DOI] [PubMed] [Google Scholar]
- 7.Steen H, Jebanathirajah JA, Rush J, Morrice N, Kirschner MW. Phosphorylation Analysis by Mass Spectrometry: Myths, Facts, and the Consequences for Qualitative and Quantitative Measurements. Mol. Cell. Proteomics. 2006;5(1):172–181. doi: 10.1074/mcp.M500135-MCP200. [DOI] [PubMed] [Google Scholar]
- 8.Hoffman MD, Kast J. Mass spectrometric characterization of lipid-modified peptides for the analysis of acylated proteins. J. Mass Spectrom. 2006;41(2):229–241. doi: 10.1002/jms.981. [DOI] [PubMed] [Google Scholar]
- 9.Henderson SC, Li J, Counterman AE, Clemmer DE. Intrinsic Size Parameters for Val, Ile, Leu, Gln, Thr, Phe, and Trp Residues from Ion Mobility Measurements of Polyamino Acid Ions. J.Phys. Chem. B. 1999;103(41):8780–8785. [Google Scholar]
- 10.Valentine SJ, Counterman AE, Hoaglund-Hyzer CS, Clemmer DE. Intrinsic Amino Acid Size Parameters from a Series of 113 Lysine-Terminated Tryptic Digest Peptide Ions. J. Phys. Chem. B. 1999;103(8):1203–1207. [Google Scholar]
- 11.Hilderbrand AE, Clemmer DE. Determination of sequence-specific intrinsic size parameters from cross sections for 162 tripeptides. J. Phys. Chem. B. 2005;109(23):11802–11809. doi: 10.1021/jp050761u. [DOI] [PubMed] [Google Scholar]
- 12.Valentine SJ, Ewing MA, Dilger JM, Glover MS, Geromanos S, Hughes C, Clemmer DE. Using ion mobility data to improve peptide identification: intrinsic amino acid size parameters. J. Proteome Res. 2011;10(5):2318–29. doi: 10.1021/pr1011312. [DOI] [PMC free article] [PubMed] [Google Scholar]
- 13.Dilger JM, Valentine SJ, Glover MS, Ewing MA, Clemmer DE. A database of alkali metal-containing peptide cross sections: Influence of metals on size parameters for specific amino acids. Int. J. Mass Spectrom. 2012;330–332(0):35–45. [Google Scholar]
- 14.Dilger JM, Valentine SJ, Glover MS, Clemmer DE. A database of alkaline-earth-coordinated peptide cross sections: insight into general aspects of structure. J. Am. Soc. Mass Spectrom. 2013;24(5):768–79. doi: 10.1007/s13361-013-0579-z. [DOI] [PubMed] [Google Scholar]
- 15.Dilger JM, Glover MS, Clemmer DE. Manuscript in preparation. A database of transition-metal-coordinated peptide cross sections: influence of metal-residue selectivity on structure. [Google Scholar]
- 16.Wang B, Valentine S, Plasencia M, Raghuraman S, Zhang X. Artificial neural networks for the prediction of peptide drift time in ion mobility mass spectrometry. BMC bioinformatics. 2010;11(1):182. doi: 10.1186/1471-2105-11-182. [DOI] [PMC free article] [PubMed] [Google Scholar]
- 17.Ruotolo BT, Gillig KJ, Woods AS, Egan TF, Ugarov MV, Schultz JA, Russell DH. Analysis of phosphorylated peptides by ion mobility-mass spectrometry. Anal. Chem. 2004;76(22):6727–6733. doi: 10.1021/ac0498009. [DOI] [PubMed] [Google Scholar]
- 18.Thalassinos K, Grabenauer M, Slade SE, Hilton GR, Bowers MT, Scrivens JH. Characterization of phosphorylated peptides using traveling wave-based and drift cell ion mobility mass spectrometry. Anal. Chem. 2008;81(1):248–254. doi: 10.1021/ac801916h. [DOI] [PubMed] [Google Scholar]
- 19.Santos LA, Iglesias A, Pilau E, Gomes A, Gozzo F. Traveling-wave ion mobility mass spectrometry analysis of isomeric modified peptides arising from chemical cross-linking. J. Am. Soc. Mass Spectrom. 2010;21(12):2062–2069. doi: 10.1016/j.jasms.2010.08.017. [DOI] [PubMed] [Google Scholar]
- 20.Ibrahim YM, Shvartsburg AA, Smith RD, Belov ME. Ultrasensitive identification of localization variants of modified peptides using ion mobility spectrometry. Anal. Chem. 2011;83(14):5617–5623. doi: 10.1021/ac200719n. [DOI] [PMC free article] [PubMed] [Google Scholar]
- 21.Shvartsburg AA, Creese AJ, Smith RD, Cooper HJ. Separation of peptide isomers with variant modified sites by high-resolution differential ion mobility spectrometry. Anal. Chem. 2010;82(19):8327–8334. doi: 10.1021/ac101878a. [DOI] [PMC free article] [PubMed] [Google Scholar]
- 22.Creese AJ, Cooper HJ. Separation and identification of isomeric glycopeptides by high field asymmetric waveform ion mobility spectrometry. Anal. Chem. 2012;84(5):2597–2601. doi: 10.1021/ac203321y. [DOI] [PMC free article] [PubMed] [Google Scholar]
- 23.Shvartsburg AA, Zheng Y, Smith RD, Kelleher NL. Separation of variant methylated histone tails by differential ion mobility. Anal. Chem. 2012;84(15):6317–6320. doi: 10.1021/ac301541r. [DOI] [PMC free article] [PubMed] [Google Scholar]
- 24.Sechi S, Chait BT. Modification of cysteine residues by alkylation. A tool in peptide mapping and protein identification. Anal. Chem. 1998;70(24):5150–5158. doi: 10.1021/ac9806005. [DOI] [PubMed] [Google Scholar]
- 25.Rombouts I, Lagrain B, Brunnbauer M, Delcour JA, Koehler P. Improved identification of wheat gluten proteins through alkylation of cysteine residues and peptide-based mass spectrometry. Sci. Rep. 2013;3 doi: 10.1038/srep02279. [DOI] [PMC free article] [PubMed] [Google Scholar]
- 26.Linder ME, Deschenes RJ. Palmitoylation: policing protein stability and traffic. Nat. Rev. Mol. Cell Biol. 2007;8(1):74–84. doi: 10.1038/nrm2084. [DOI] [PubMed] [Google Scholar]
- 27.Jiang X, Shamshurin D, Spicer V, Krokhin OV. The effect of various S-alkylating agents on the chromatographic behavior of cysteine-containing peptides in reversed-phase chromatography. J. Chromat. B. 2013;915–916(0):57–63. doi: 10.1016/j.jchromb.2012.12.010. [DOI] [PubMed] [Google Scholar]
- 28.Baekkeskov S, Kanaani J. Palmitoylation cycles and regulation of protein function (Review) Mol. Membr. Biol. 2009;26(1):42–54. doi: 10.1080/09687680802680108. [DOI] [PubMed] [Google Scholar]
- 29.Iwanaga T, Tsutsumi R, Noritake J, Fukata Y, Fukata M. Dynamic protein palmitoylation in cellular signaling. Prog. Lipid Res. 2009;48(3–4):117–27. doi: 10.1016/j.plipres.2009.02.001. [DOI] [PubMed] [Google Scholar]
- 30.Salaun C, Greaves J, Chamberlain LH. The intracellular dynamic of protein palmitoylation. J. Cell Biol. 2010;191(7):1229–38. doi: 10.1083/jcb.201008160. [DOI] [PMC free article] [PubMed] [Google Scholar]
- 31.Cohen P. The origins of protein phosphorylation. Nat. Cell Biol. 2002;4(5):E127. doi: 10.1038/ncb0502-e127. [DOI] [PubMed] [Google Scholar]
- 32.Young FB, Butland SL, Sanders SS, Sutton LM, Hayden MR. Putting proteins in their place: palmitoylation in Huntington disease and other neuropsychiatric diseases. Prog. Neurobiol. 2012;97(2):220–38. doi: 10.1016/j.pneurobio.2011.11.002. [DOI] [PubMed] [Google Scholar]
- 33.The UniProt Consortium Reorganizing the protein space at the Universal Protein Resource (UniProt) Nucleic Acids Res. 2012;40:D71–D5. doi: 10.1093/nar/gkr981. [DOI] [PMC free article] [PubMed] [Google Scholar]
- 34.Berman HB, Henrick K, Nakamura H. Announcing the worldwide Protein Data Bank. Nat. Struct. Biol. 2003;10(12):98. doi: 10.1038/nsb1203-980. [DOI] [PubMed] [Google Scholar]
- 35.Prasad TK, Goel R, Kandasamy K, Keerthikumar S, Kumar S, Mathivanan S, Telikicherla D, Raju R, Shafreen B, Venugopal A. Human protein reference database—2009 update. Nucleic Acids Res. 2009;37:D767–D72. doi: 10.1093/nar/gkn892. [DOI] [PMC free article] [PubMed] [Google Scholar]
- 36.Amblard M, Fehrentz JA, Martinez J, Subra G. Methods and protocols of modern solid phase Peptide synthesis. Mol. Biotechnol. 2006;33(3):239–54. doi: 10.1385/MB:33:3:239. [DOI] [PubMed] [Google Scholar]
- 37.Yousefi-Salakdeh E, Johansson J, Stromberg R. A method for S- and O- palmitoylation of peptides: synthesis of pulmonary surfactant protein-C models. Biochem. J. 1999;343(Pt 3):557–62. [PMC free article] [PubMed] [Google Scholar]
- 38.Koeniger SL, Merenbloom SI, Valentine SJ, Jarrold MF, Udseth HR, Smith RD, Clemmer DE. An IMS-IMS analogue of MS-MS. Anal. Chem. 2006;78(12):4161–4174. doi: 10.1021/ac051060w. [DOI] [PubMed] [Google Scholar]
- 39.Merenbloom SI, Koeniger SL, Valentine SJ, Plasencia MD, Clemmer DE. IMS-IMS and IMS-IMS-IMS/MS for separating peptide and protein fragment ions. Anal. Chem. 2006;78(8):2802–2809. doi: 10.1021/ac052208e. [DOI] [PubMed] [Google Scholar]
- 40.Shaffer SA, Tang K, Anderson GA, Prior DC, Udseth HR, Smith RD. A novel ion funnel for focusing ions at elevated pressure using electrospray ionization mass spectrometry. Rapid Comm. Mass Spectrom. 1997;11(16):1813–1817. [Google Scholar]
- 41.Shaffer SA, Prior DC, Anderson GA, Udseth HR, Smith RD. An ion funnel interface for improved ion focusing and sensitivity using electrospray ionization mass spectrometry. Anal. Chem. 1998;70(19):4111–9. doi: 10.1021/ac9802170. [DOI] [PubMed] [Google Scholar]
- 42.Revercomb HE, Mason EA. Theory of plasma chromatography/gaseous electrophoresis. Review. Anal. Chem. 1975;47(7):970–983. [Google Scholar]
- 43.Mason EA, McDaniel EW. Transport Properties of Ions in Gases. Wiley; New York: 1988. [Google Scholar]
- 44.With cross section database developed by our group [accessed 12/18/2013]; http://www.indiana.edu/~clemmer/Research/Cross%20Section%20Database/cs_database.php.
- 45.Johnson RS, Martin SA, Biemann K, Stults JT, Watson JT. Novel fragmentation process of peptides by collision-induced decomposition in a tandem mass spectrometer: differentiation of leucine and isoleucine. Anal. Chem. 1987;59(21):2621–2625. doi: 10.1021/ac00148a019. [DOI] [PubMed] [Google Scholar]
- 46.Gupta K, Kumar M, Chandrashekara K, Krishnan KS, Balaram P. Combined electron transfer dissociation–collision-induced dissociation fragmentation in the mass spectrometric distinction of leucine, isoleucine, and hydroxyproline residues in peptide natural products. J. Prot. Res. 2011;11(2):515–522. doi: 10.1021/pr200091v. [DOI] [PubMed] [Google Scholar]
- 47.Ciesla J, Fraczyk T, Rode W. Phosphorylation of basic amino acid residues in proteins: important but easily missed. Acta Biochim. Pol. 2011;58(2):137–48. [PubMed] [Google Scholar]