

Abstract
Impairment in semantic processing occurs early in Alzheimer’s disease (AD) and differential impact on subtypes of semantic relations have been reported, yet there is little data on the neuroanatomic basis of these deficits. Patients with mild AD and healthy controls underwent 3 functional MRI auditory stimulation tasks requiring semantic or phonological decisions (match–mismatch) about word pairs (category–exemplar, category–function, pseudoword). Patients showed a significant performance deficit only on the exemplar task. On voxel-based fMRI activation analyses, controls showed a clear activation focus in the left superior temporal gyrus for the phonological task; patients showed additional foci in the left dorsolateral prefrontal and bilateral cingulate areas. On the semantic tasks, predominant activation foci were seen in the inferior and middle frontal gyrus (left greater than right) in both groups but patients showed additional activation suggesting compensatory recruitment of locally expanded foci and remote regions, for example, right frontal activation during the exemplar task. Covariance analyses indicated that exemplar task performance was strongly related to signal increase in bilateral medial prefrontal cortex. The authors conclude that fMRI can reveal similarities and differences in functional neuroanatomical processing of semantic and phonological information in mild AD compared to healthy elderly, and can help to bridge cognitive and neural investigations of the integrity of semantic networks in AD.
Keywords: Alzheimer disease, Functional MRI, Semantic memory, Phonological
INTRODUCTION
The memory impairment exhibited in Alzheimer’s disease (AD) has been the focus of substantial research as it is the most prominent feature of the disease. Specific components of memory are differentially affected by AD (Albert, 1996). Episodic and semantic memory (originally distinguished by Tulving & Donaldson, 1972) both are impaired early in AD whereas other types of memory such as procedural learning may remain relatively unaffected until quite late in the disease process (Carlesimo & Oscar-Berman, 1992; Kaszniak, 1986; Shimamura, 1989). The semantic memory deficit in AD is characterized by impaired long-term memory for culturally shared general knowledge about words, concepts and symbols, their associations, and rules for their manipulation (Butters et al., 1987; Tulving & Donaldson, 1972). Early loss of semantic memory has been reported in up to half of clinically referred patients, and it has been postulated that this may account for some of the cognitive heterogeneity seen in this disease (Grossman et al., 1996, 1998b). Although there has been considerable disagreement as to whether this loss represents a breakdown of semantic networks or impaired access to intact knowledge stores, recent findings favor the model positing loss of stored representations (Greene & Hodges, 1996; Norton et al., 1997).
A major question underlying studies of semantic processing in AD is the issue of how neural representations of semantic knowledge deteriorate during stages of the disease. Several models have proposed that semantic information is represented in highly distributed neural networks (Damasio et al., 1996; Mesulam, 1990; Rumelhart & McClelland, 1986) that are gradually degraded by the neuropathological changes in AD (Terry & Katzman, 1983). It has additionally been proposed that these neural networks are organized to provide representation of broad conceptual and more discrete aspects of knowledge. The concept of spreading activation has been proposed as a mechanism by which items are retrieved from semantic stores (Collins & Loftus, 1975).
Recent studies suggest that there are differential deficits in component abilities of semantic processing in AD patients. These differences have both theoretical and clinical implications. Chan et al. in a series of studies (Chan et al., 1993, 1994, 1995, 1997) used multidimensional scaling to examine the pattern of deterioration of semantic networks in patients with AD and reported increased reliance on superficial features and qualitatively abnormal representation of categories of objects. Johnson and Hermann (1995) reported that moderate AD patients demonstrated diffuse impairment in semantic knowledge (superordinate category, part, property, and function), whereas mild AD patients showed impairment only in semantic processing for functional relationships.
Functional neuroimaging studies (PET, fMRI) of semantic memory in normal adults have consistently yielded a pattern of predominant left hemisphere involvement (for a review see Cabeza & Nyberg, 1997) in inferior frontal and temporoparietal areas (Binder et al., 1996, 1997; Demb et al., 1995; Demonet et al., 1992; Fiez, 1997; Fiez et al., 1996a, 1996b; Martin et al., 1995; Petersen et al., 1988; Spitzer et al., 1995; Warburton et al., 1996; Wise et al., 1991). To date, no semantic PET or fMRI activation studies of AD exist, although several studies have correlated resting metabolism using PET with semantic performance (Grady et al., 1990; Grossman et al., 1997, 1998a). PET activation studies with AD patients have been performed using visual and auditory verbal recognition (Kessler et al., 1991, 1996) and verbal short term memory (Becker et al., 1996c; Herbster et al., 1996). Becker et al. (1996c) found significantly increased regional cerebral blood flow (rCBF) in dorsolateral prefrontal cortex relative to matched controls. This phenomenon was speculated to be related to reallocation or further recruitment of neural resources.
The present study was designed to systematically explore neuroanatomical correlates of semantic processing in AD by contrasting patterns of neural activation in AD patients with those of controls during a series of semantic decision tasks. These tasks were selected to differentially probe semantic knowledge of categorical, functional, and phonological congruence between word pairs. We hypothesized that in healthy controls we would observe primarily left inferior frontal and superior temporal neocortical activation for the semantic tasks. Additional parietal activation seemed possible in view of past imaging studies. The phonological control task was expected to show more restricted activation in primary and secondary auditory processing areas, particularly the left superior temporal gyrus. A lesser degree of frontal and cingulate activation was expected because of the attentional, anticipatory, and decision making components common to all of the activation tasks (Murtha et al., 1996). In patients with AD, we expected to find a generally similar pattern of activation but a less focal, more widespread distribution reflecting loss of efficiency of semantic networks, similar to observations that have been reported for other types of memory tasks using PET (Becker et al., 1996b, 1996c). Finally, on impaired semantic tasks, AD patients were expected to show a positive correlation between performance and degree of activation in regions implicated in normals for these functions.
METHODS
Research Participants
Patients met NINCDS–ADRDA criteria for research clinical diagnosis of probable AD (McKhann et al., 1984), DSM–IV and ICD–10 criteria for dementia, and had mild severity (Level 1 on the Clinical Dementia Rating, GDS-FAST Stage 4; Reisberg, 1996). Patients were recruited from the Geropsychiatry Clinic at Dartmouth Hitchcock Medical Center. Healthy elderly controls were recruited from the regional community via newspaper advertisements and from community groups and retirement communities. General eligibility criteria for participants included age from 50 to 85, native speaker of English, at least 10 years of formal education or GED, and capacity to provide informed consent. Written consent was obtained for all participants. Potential participants were excluded if they had past or present history of medical disease processes (cardiac, renal, metabolic, infectious, systemic, other neurological—including head injury with loss of consciousness longer than 5 min—or Axis-I psychiatric disorder) that might confound characterization of AD or influence cerebrovascular function. All patients were recruited prior to beginning any pharmacological treatment including neuroprotective agents; patients already receiving neuroleptics, benzodiazepines, or anticholinergic agents were excluded. All patients underwent a geropsychiatric evaluation by a board certified geriatric psychiatrist (RBS) that included medical history and physical examination, and semistructured neurological and psychiatric evaluations. Additional information was obtained as needed from family members, medical records and treating physicians, and routine laboratory studies were available. Structural MRI scans were completed as part of this study and were read by a board certified neuroradiologist (ACM) blind to clinical diagnosis and behavioral data.
Comprehensive neuropsychological assessment was completed, consistent with the NINCDS–ADRDA Task Force recommendations for behavioral diagnostic work-up of dementia (McKhann et al., 1984) and the recent recommendations of the Agency for Health Care Policy and Research (1996). The neuropsychological battery included the Dementia Rating Scale (DRS; Mattis, 1988); North American Adult Reading Test (NAART; Blair & Spreen, 1989), California Verbal Learning Test (CVLT; Delis et al., 1987), Logical Memory I/II, Visual Reproduction I/II (Wechsler Memory Scale–Revised; Wechsler, 1986), Wisconsin Card Sorting Test (Heaton et al., 1993),Vocabulary (Wechsler Adult Intelligence Scale–Revised, WAIS–R; Wechsler, 1981), Information (WAIS–R), Block Design (WAIS–R), Picture Completion (WAIS–R), Digit Symbol (WAIS–R), Controlled Oral Word Association (COWA, letters ‘C’, ‘F’, ‘L’; Benton et al., 1983), Category Fluency, Boston Naming Test, Clock Drawing (Goodglass & Kaplan, 1987), and Trail Making Test (Reitan & Wolfson, 1993).
The AD group (N = 9) had a mean age of 79 years (SD = 5), education of 17 years (SD = 2), and included 3 women. Healthy controls (N = 6) had a mean age of 71 years (SD = 4), education of 16 years (SD = 2), and included 4 women. All were right handed except 2 patients. The only significant demographic difference was that the patient group had a higher mean age than controls.
MRI Procedures
All structural and functional MRI scans were obtained on a single General Electric Signa scanner (1.5 Tesla magnet) during the same session. This was usually completed within 48 hr of neuropsychological testing. A 3D coronal series was acquired using a spoiled gradient echo sequence (TR = 24, TE = 8, flip angle = 40, NEX = 1, slice thickness = 1.5 mm, no skip, in-plane resolution = .9375 mm2, FOV = 24 cm). T2-weighted axial survey images were also acquired to screen for focal lesions.
Functional MRI procedure
All functional and reference scans were acquired using a multi-axial local gradient head coil system (Medical Advances, Inc., Milwaukee, WI). A single shot, gradient echo, echo planar functional scan sequence was implemented to measure the whole brain with optimal temporal and spatial resolution (TR = 3500 ms, TE = 40 ms, interleaved, FOV = 24 cm, slice thickness = 6 mm, NEX = 1, flip angle = 90), yielding 20–23 contiguous sagittal slices in a 64 × 64 matrix with an in-plane resolution of 3.75 mm2 (total slice acquisitions per run = 1920 scans). Anatomical reference images were acquired in the same slice locations using a T1-weighted spin-echo pulse sequence (TR = 450 ms; TE = 17 ms; interleaved; matrix = 256 × 192; NEX = 1; same FOV, slice thickness and locations as the functional scans).
fMRI activation tasks
Each participant underwent two semantic processing decision tasks, and one phonological decision control task in counterbalanced order. Word frequency and concreteness were controlled (Battig & Montague, 1969; Francis & Kucera, 1982). All auditory stimuli were recorded by the same female experimenter, who timed the delivery of instructions and stimulus pairs via timing prompts generated by a computer program. Tapes were played on a Magnacoustics Model 14 MRI Music System located outside the MRI suite, with binaural sound delivered through 2–3-mm polyethylene tubing to Earlink model 3B (Cabot Safety Corporation) earplugs positioned in participants’ ear canals.
Category-Exemplar Decision Task
During this task, participants were presented with word pairs consisting of a superordinate category (e.g., beverage) and a subordinate category exemplar (e.g., milk). During each block of four trials, one of the word pairs consisted of a correct pairing of category and exemplar (e.g., beverage–milk) and three word pairs consisted of incorrect pairings (e.g., vehicle–carrot). Thirty-two categories from Battig and Montague (1969) were paired with exemplars of moderate associative value (i.e., responses by 30–51 of 442 respondents).
Category-Function Decision Task
During this task, participants were presented with word pairs consisting of the same 32 superordinate categories and a function word appropriate to each category. During each block of four trials, one of the word pairs consisted of a correct pairing of category and function (e.g., beverage–sip) and three word pairs consisted of incorrect pairings (e.g., beverage–debate). For each superordinate category, function words were selected to have word frequencies (Francis & Kucera, 1982) similar to those of subordinate exemplars and to have a restricted relationship to only one of the superordinate category words.
Prior to category–exemplar and category–function lexical decision tasks, the following taped instructions were played for each participant:
In a few moments you will hear several pairs of words such as (vehicle–car; vehicle–ride). The first word in each pair will be a category, the second word will be a(n) (example of the category; verb or function) which may or may not be associated with the category. If the second word in the pair is a(n) (example; verb–function) belonging to the category, squeeze the bulb as quickly as you can. For example, if I said (fruit–apple; fruit–ripen), you would squeeze the bulb because (an apple is a fruit; ripen is something that fruits do). If I said (fruit–hammer; fruit–frown) you would not squeeze the bulb because (hammer; frown) is not usually associated with fruit. Let’s practice with a short list. Squeeze the bulb when you hear a match.
Phonological Decision Control Task
The 32 superordinate category and exemplar words were translated into pronounceable pseudowords by reordering the individual phonemes within each word. The number of syllables was maintained. During each block of four trials, one of the word pairs consisted of a pairing of the same scrambled category pseudowords (e.g., temla–temla) and three word pairs consisted of incorrect pairings of scrambled category and exemplar pseudowords (e.g., yodb–rea). The following taped instructions were presented:
In a few moments you will hear several pairs of pseudowords, that is, words that don’t mean anything such as eert and imet. Sometimes the words in the pairs will be different, and other times the words will be the same. When you hear two pseudowords in a pair that are the same, squeeze the bulb as quickly as you can. If the words in the pair are different, do nothing. For example, if I said “eert–eert” you would squeeze the bulb. But if I said “eert–imet” you would not squeeze the bulb because both words were not the same. Let’s practice with a short list. Squeeze the bulb when you hear a match.
For all tasks, four practice trials with two correct matches were administered and participants were given the following additional instructions:
Between sets of pairs of words we will ask you to relax. When we ask you to relax, try to clear your mind of all thoughts. It may be helpful to think of a blank black-board. During the entire task, keep your eyes closed.
Sound volume was adjusted to a level which was reported as clearly audible to each participant. Each decision task was presented in a cyclical design consisting of 8 cycles of 10.5 s of rest alternated with 28 s of decision-making. At the beginning of each decision-making cycle, participants were provided with a 3.5-s reminder: “Squeeze the bulb if the [category and example; category and action; pseudowords] match,” followed by presentation of four word pairs, with an inter-pair interval of 7.0 s. To indicate an affirmative decision, participants were requested to squeeze a pneumatic bulb with both hands, which registered a response at the operator console. Across the eight blocks of trials, word pairs were arranged so that correct pairings were represented twice at each of the four ordinal positions within a trial block. Dependent performance variables for each task included the percent correct decisions adjusted for response bias [(true positives − .33 × false alarms) × 100].
Functional MRI analyses
Overall statistical approach
Functional MRI analyses included statistical parametric mapping, on a voxel-by-voxel basis, using a general linear model approach (Friston et al., 1995; Worsley & Friston, 1995; Worsley et al., 1996) as implemented in SPM96. All task conditions for all participants were initially analyzed as individual time series before inclusion in multi-participant, between-group, and covariance analyses. Theoretical and practical implementation of multi-participant and between-group analyses of fMRI data have been the subject of much recent work and debate. The main analyses reported here used the Random Effects procedure recently developed by Holmes and Friston (1998) as described below. The principal advantage of this method is the elimination of highly discrepant variances between and within participants in constructing an appropriate error term for hypothesis testing.
Preprocessing steps
All scans were cropped to eliminate most nonbrain voxels. Spatial realignment using the SPM96 six-parameter model was performed on all raw scan data prior to further analysis to remove any minor (subvoxel) motion-related signal change.
Spatial normalization and smoothing
Prior to multi-participant analyses, scans were spatially normalized to approximate the atlas space of Talairach and Tournoux (1988) using a 12-parameter affine approach and a T2*-weighted template image. The optional use of nonlinear warping by spatial basis functions was limited to 2 × 2 × 2 and 8 iterations. During normalization all scans were resampled to 2 mm3 isotropic voxels. Spatial smoothing to a full-width half-maximum of 15 mm3 was then performed.
Random Effects procedure
For the multi-participant–between-group analyses, the Holmes and Friston (1998) procedure assumes input of one scan per participant for each condition and then performs a mixed model analysis to account for both random effects (scan) and fixed effects (rest–activation, Task A–Task B, etc.). The mean input images for each participant were obtained by calculating the mean image for the rest and activation conditions of each task after taking into account the hemodynamic response function. Transitional scans were excluded and the timing took into account the optimal lag of 1 TR (3.5 s) for the hemodynamic response function. We also examined but rejected use of a 2-TR lag because we were concerned that we would be more likely to see downstream venous effects at 7 s post-stimulation instead of the desired local parenchymal effects, and we obtained robust activation with a 1-TR offset.
Covariance analysis of task performance
Task performance scores, expressed as percent correct after adjustment for response bias, were entered as covariates in an activation (rest vs. task) by performance interaction general linear model analysis. Because only the activation by performance interaction term is of interest in this context, the main effects of performance and activation are removed. Voxels reaching significance in this model have a linear relationship between degree of task activation and accuracy of performance.
Probability thresholds
For a priori hypothesis testing, critical probability thresholds were uncorrected in assessing predefined search regions such as the superior temporal gyrus and inferior prefrontal cortex. The SPM maps shown are thresholded to a stringent alpha value of .005 for the main effects and interactions, and .001 for the Performance × Activation analysis. The threshold method, as implemented in SPM96, simultaneously accounts for peak amplitude and spatial extent of clusters to reduce Type I error. Spatial extent is reflected by cluster size, which in this context refers to the number of adjacent activated voxels that exceed the specified threshold. We chose the probability value thresholds as a conservative balance between Type I and Type II error. In view of our neuroanatomically constrained hypotheses regarding expected regions of activation, based on prior functional imaging and lesion studies, we thought a multiple comparison correction strategy designed for exploratory searches of the entire brain volume would have been overly conservative.
RESULTS
Behavioral Data
Baseline neuropsychological test scores are presented in Table 1. AD patients performed significantly below controls on DRS Total Score, NAART, COWA, Animal Naming, Boston Naming Test and CVLT (total Trials 1–5), but not on WAIS–R Vocabulary or Block Design. The AD sample, as expected, was clearly impaired on standard clinical tests of both semantic and episodic memory.
Table 1.
Neuropsychological test scores
| Test | AD patients (N = 9) M (SD) |
Healthy controls (N = 6) M (SD) |
t | p |
|---|---|---|---|---|
| DRS Total Score | 114.8 (14.4) | 141.2 (2.3) | 5.37 | .0005 |
| NAART | 113.6 (7.0) | 122.4 (5.1) | 2.41 | .04 |
| Vocabulary (WAIS–R) | 11.1 (3.7) | 13.2 (1.2) | 1.45 | n.s. |
| Block Design (WAIS–R) | 6.0 (4.2) | 9.7 (2.2) | 1.92 | n.s. |
| Boston Naming Test | 38.8 (17.4) | 58.5 (1.8) | 3.37 | .009 |
| Animal Naming | 8.8 (4.3) | 24.2 (6.1) | 5.7 | .0001 |
| COWA (CFL) | 28.4 (12.5) | 47.3 (10.8) | 3.0 | .01 |
| CVLT, Total 1–5 | 18.4 (8.3) | 56.0 (8.7) | 7.93 | .0001 |
Note. DRS = Dementia Rating Scale; NAART = North American Adult Reading Test; COWA = Controlled Oral Word Association Test; CVLT = California Verbal Learning Test; WAIS–R = Wechsler Adult Intelligence Scale–Revised.
Performance on the fMRI semantic and phonological activation tasks is presented in Figure 1. The eight sets of four word pairs presented during each task had one correct and three incorrect pairings in a pseudo-random sequence. A 2 × 3 mixed-model MANOVA with group (AD vs. control) as the between factor and task (Exemplar, Function, Phoneme tasks) as the within-participants factor demonstrated a significant Task × Group interaction [F(2, 12) = 3.9, p = .05], as well as main effects of group, [F(1, 13) = 4.8, p = .05], and task [F(2, 12) = 8.4, p = .005]. The obtained interaction and planned comparisons indicated that AD patients were selectively impaired on the category-exemplar condition relative to controls (p > .02, two-tailed). Contrary to our expectation, patients did not exhibit significantly worse performance on the category function task. As expected, the phonological control task was performed equally well by both groups.
Fig. 1.

Semantic and phonologic task performance by group.
Task activation results
Figures 2 to 4 show the results of group analyses for the phonological, category-function and category-exemplar tasks, respectively. Each figure provides the “glass brain” maximum intensity projection of foci of activation for each group (simple effects) and statistical comparisons between groups (Group × Rest-vs.-Activation interactions). Simple activation effects for controls (Row A) and patients (Row B) are shown followed by interactions, that is, regions where patients showed significantly greater activation than controls (Row C) and regions where controls showed significantly greater activation than patients (Row D). This display method provides a comprehensive presentation of the statistical results for all voxels significant at Z=2.57, p=.005. This threshold was selected as a reasonable balance between overly conservative and liberal thresholds and is similar to that used in other functional imaging studies. Table 2 presents coordinates, cluster size, Z and p values for local maxima and anatomic region labels for all voxels exceeding the Z ≥ 2.57 threshold. Anatomical labels were based on the probabilistic atlas system using the Talairach daemon as well as review of the activation sites with reference to the canonical T1-weighted reference brain (Evans et al., 1996) included in the SPM96 software.
Fig. 2.

Activation patterns for the phonological control task. Maximum intensity projections in the three orthogonal views (sagittal, coronal, axial) of the brain depicting areas of activation foci, extent, and magnitude (higher amplitude of activation is darker) in group analyses. L = left, R = right, A = anterior, P = posterior. Rows A and B represent the simple effects (task vs. rest) for the control group and AD group respectively. Rows C and D depict the interaction between groups where amplitude of activation is greater in AD than controls (Row C), and where amplitude of activation in controls is greater than AD (Row D).
Fig. 4.

Activation patterns for the category-exemplar task. Maximum intensity projections in the three orthogonal views (sagittal, coronal, axial) of the brain depicting areas of activation foci, extent, and magnitude (higher amplitude of activation is darker) in group analyses. L = left, R = right, A = anterior, P = posterior. Rows A and B represent the simple effects (task vs. rest) for the control group and AD group respectively. Rows C and D depict the interaction between groups where amplitude of activation is greater in AD than controls (Row C), and where amplitude of activation in controls is greater than AD (Row D).
Table 2.
Summary of prominent activation cluster extent, magnitude, and Talairach location by task and group contrast
| Cluster size | Z score | p | X, Y, Z (mm) | Region |
|---|---|---|---|---|
| Phonological–CT | ||||
| 300 | 4.15 | .000 | −54, −10, 0 | Left STG |
| 70 | 3.15 | .001 | 20, −20, −12 | Right PHG, BA 35 |
| 39 | 2.89 | .002 | −8, 30, 42 | Left SFG, BA 8 |
| 18 | 2.78 | .003 | 42, 18, 24 | Right IFS, IFG |
| 12 | 3.01 | .001 | 18, −40, −30 | Right cerebellum |
| Phonological–AD | ||||
| 965 | 3.57 | .000 | −10, 34, 38 | Bilateral medial SFG–cingulate, left more than right |
| 263 | 3.73 | .000 | 12, −8, −12 | Right PHG |
| 233 | 3.23 | .001 | −50, 8, 40 | Left MFG |
| 171 | 3.02 | .001 | −48, −44, 44 | Left intraparietal sulcus, SMG, BA 40 |
| 53 | 2.97 | .001 | −50, −18, 54 | Left postcentral gyrus, BA 3 |
| 6 | 2.65 | .004 | −54, −20, −4 | Left STG, MTG |
| Phonological AD > CT | ||||
| 251 | 3.31 | .000 | −50, −48, 38 | Left inferior parietal lobule |
| 7 | 2.76 | .003 | −22, −42, 42 | Left parietal white matter |
| 4 | 2.64 | .004 | −44, 2, 28 | Left precentral gyrus, BA 6 |
| Phonological CT > AD | ||||
| 22 | 2.89 | .002 | 18, −38, −30 | Right cerebellum |
| 2 | 2.59 | .005 | −54, −10, 2 | Left STG |
| Category function–CT | ||||
| 1468 | 4.34 | .000 | −46, 14, 48 | Left MFG, BA 6 |
| 374 | 3.74 | .000 | −16, −6, −14 | Left PHG, BA 37 |
| 290 | 3.03 | .001 | −6, 42, 42 | Left medial SFG, BA 8 |
| 51 | 2.89 | .002 | 22, 0, −16 | Right PHG, amygdala |
| 41 | 2.77 | .003 | −10, 12, 56 | Left SFG |
| 27 | 2.78 | .003 | −14, −84, 6 | Left cuneus, BA 17 |
| Category function–AD | ||||
| 3547 | 3.99 | .000 | −44, 24, −22 | Cluster extending across left lateral orbital, IFG, and MFG |
| 336 | 3.86 | .000 | 24, −6, −12 | Right PHG |
| 58 | 3.23 | .001 | 42, −2, 60 | Right MFG |
| 22 | 2.73 | .003 | −14, 14, 44 | Left medial SFG |
| 13 | 2.76 | .003 | −42, −40, −10 | Left temporal–occipital white matter |
| Category function AD > CT | ||||
| 53 | 3.16 | .001 | 0, −42, 30 | Interhemispheric, posterior cingulate gyrus |
| 8 | 2.76 | .003 | −50, 2, 20 | Left IFG, BA 44 |
| Category function CT > AD | ||||
| 523 | 2.98 | .001 | 44, −22, 12 | Right TTG–STG, BA 41 |
| 16 | 2.74 | .003 | −12, −50, 0 | Left lingual gyrus, BA 19 |
| 13 | 2.88 | .002 | −16, −4, −16 | Left PHG, BA 34 |
| 11 | 2.84 | .002 | −44, 18, 50 | Left SFG |
| Category exemplar–CT | ||||
| 170 | 3.38 | .000 | −6, −36, 0 | Ambient cistern |
| 49 | 3.37 | .000 | −54, −16,4 | Left STG |
| 39 | 3.09 | .001 | −52, 14, 42 | Left MFG |
| 18 | 2.7 | .003 | 14, 38, 34 | Bilateral SFG–right cingulate |
| Category exemplar–AD | ||||
| 453 | 3.74 | .000 | −54, −4, 46 | Left MFG |
| 362 | 3.93 | .000 | 58, 12, 28 | Right IFG and MFG |
| 89 | 3.32 | .000 | −22, 4, 0 | Left putamen |
| 34 | 2.82 | .002 | 14, 34, 40 | Right cingulate gyrus |
| 10 | 2.84 | .002 | −12, 4, 42 | Left medial SFG |
| Category exemplar AD > CT | ||||
| 541 | 4.03 | .000 | −42, −10, 40 | Left precentral gyrus, extending to postcentral gyrus |
| 265 | 3.89 | .000 | −20, 6, 0 | Left putamen |
| 48 | 3.32 | .000 | −18, −40, 40 | Left subgyral white matter |
| 38 | 3.03 | .001 | 54, −6, 32 | Right precentral gyrus |
| 26 | 2.91 | .002 | −44, −48, 30 | Left supramarginal gyrus |
| Category exemplar CT > AD | ||||
| 72 | 3.15 | .001 | −2, −64, 6 | Left cuneus |
| 72 | 3.07 | .001 | −24, 22, 48 | Left MFG |
| 29 | 2.85 | .002 | −6, −34, 0 | Left superior parietal lobule |
| 18 | 3.03 | .001 | −54, −16, 6 | Left STG |
| 10 | 2.8 | .003 | 38, 52, −6 | Right orbital gyrus |
Phonological task
On the phonological task, designed to control for basic auditory discrimination and decision making, controls showed a clear activation focus in the left superior temporal gyrus (STG; Z = 4.15, Figure 2a). Other areas showing activation for the control group included the left medial superior frontal gyrus and right frontal, limbic and cerebellar regions. AD patients showed a large bilateral anterior superior frontal gyrus (SFG)–cingulate area of activation and several left-lateralized foci including the SFG and middle frontal gyrus (MFG), STG (see Figure 2b), and parietal (supramarginal gyrus and intraparietal sulcus) sites. Right parahippocampal gyrus (PHG) activation was also noted. Between-group interactions indicated that AD patients had greater activation than controls in a large left inferior parietal region (BA = 39; Figure 2c). Controls showed small clusters of greater activation than patients in the left STG (Figure 2d) and right cerebellum.
Category function task
Activation on the function task is shown in Figure 3. The control group showed predominantly left sided activation in the left MFG (Figure 3a), medial SFG, and PHG. Right sided foci included the insula and a small inferior frontal gyrus (IFG) area. Patients showed a large area of activation spanning the left lateral orbital gyrus, IFG, and MFG (Figure 3b). Other left sided activation foci included medial SFG and a temporal–occipital region. Right sided foci included the PHG and MFG. Between-Group × Task interactions indicated that patients showed more activation in the left precentral gyrus (Figure 3c) whereas controls showed greater activation in a large region of the right transverse temporal gyrus (TTG) and insula (Figure 3d) and small areas in the left MFG, PHG, and lingual gyrus.
Fig. 3.

Activation patterns for the category-function task. Maximum intensity projections in the three orthogonal views (sagittal, coronal, axial) of the brain depicting areas of activation foci, extent, and magnitude (higher amplitude of activation is darker) in group analyses. L = left, R = right, A = anterior, P = posterior. Rows A and B represent the simple effects (task vs. rest) for the control group and AD group respectively. Rows C and D depict the interaction between groups where amplitude of activation is greater in AD than controls (Row C), and where amplitude of activation in controls is greater than AD (Row D).
Category exemplar task
Results of the exemplar task are shown in Figure 4. On the exemplar task, the control group showed activation in left STG (Figure 4a) and left MFG, as well as the right cingulate gyrus. AD patients showed activation in bilateral dorsolateral frontal regions including left MFG, as well as right MFG and IFG (Figure 4b). Other areas included left putamen and right cingulate. Between-Group × Task interactions indicated that the AD group showed higher activation in a large left precentral area that extended to the postcentral gyrus (Figure 4c). Activation of the left putamen and right precentral gyrus was also seen. Controls showed greater activation in the left MFG (Figure 4d), left transverse temporal gyrus (TTG), as well as several other small foci.
Relation between task performance and activation
Patients were significantly impaired in terms of performance on the exemplar but not phonological or function task performance relative to controls (Figure 1). Therefore, analysis of the relationship between performance and regional activation was restricted to the exemplar task. We employed a general linear model covariance approach to test the association between degree of activation and task performance on a voxel basis. Specifically, the relationship of interest was modeled as the interaction between task performance and activation (rest-vs.-task activation signal change) after removing the main effects of performance and activation. Thus, only voxels in which exemplar performance was associated with degree of activation were retained. Because of the exploratory nature of this covariance analysis, the threshold was set at a more stringent alpha level (p < .001) than the earlier analyses. Figure 5 shows the regions where category-exemplar task performance was positively associated with degree of activation as indicated by the SPM of the performance–activation interaction (Z = 3.09, p < .001). All of the regions were in the left or right frontal lobes and all but one maxima (in the left cingulate gyrus) were very anterior within the frontal region. Figure 6 shows the relationship between changes in normalized MR signal intensity (rest-vs.-exemplar processing) and performance for regions in the left and right frontal lobes identified in Figure 5. Activation related signal change was moderately correlated among these anterior brain regions (r range: .51–.74). As expected, most variance was accounted for by the AD patient group (filled circles) because control group (open circles) performance was restricted in range (83–100% correct) compared to the patients (0–79% correct). Additional analyses were performed excluding the control participants and the patient with zero percent correct. Although this attenuated the relationships, the same general pattern of relationship between frontal regions and exemplar performance was observed, with the left prefrontal region appearing most robust. It is interesting to note that the only participant not showing activation in these frontal regions was the patient who performed at chance.
Fig. 5.
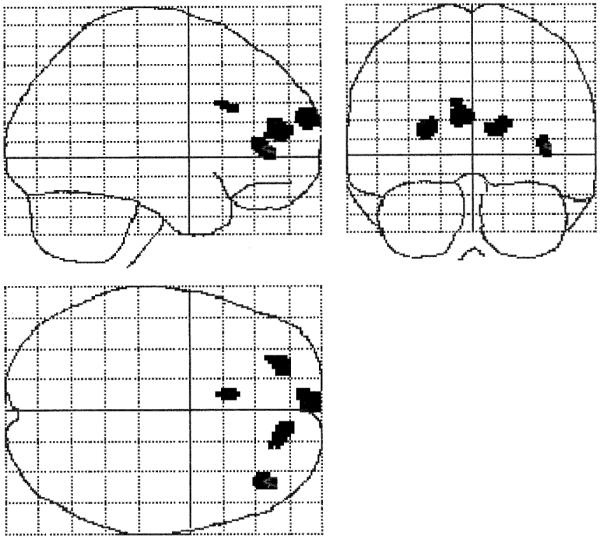
Brain regions where category-exemplar task performance was correlated with amplitude of activation (Z ≥ 3.31, p < .001). Regions and Talairach coordinates (x, y, z) are left prefrontal (−4, 68, 22), left MFG (−24, 50, 14), cingulate gyrus (−8, 22, 28), and right IFG (40, 42, 4).
Fig. 6.

Relationship of category-exemplar task performance to frontal activation in the regions shown in Figure 5. The filled circles represent AD patients, the open circles represent controls.
DISCUSSION
AD patients demonstrated clear evidence of cerebral activation in response to semantic processing tasks, despite impaired performance, indicating that the cognitive pathology of AD can be meaningfully assessed with fMRI. This study represents to our knowledge the first examination of semantic memory processing in AD using BOLD contrast fMRI.
The activation profile on the semantic tasks seen in the healthy controls and in AD patients was generally consistent with prior functional imaging studies of semantic and phonological processing in normal adults. Major activation foci for both groups on the semantic tasks included inferior frontal regions, particularly of the left hemisphere (Binder et al., 1996, 1997; Cabeza & Nyberg, 1997; Demb et al., 1995; Demonet et al., 1992; Fiez et al., 1996a, 1996b, 1997; Martin et al., 1995; Petersen et al., 1988; Spitzer et al., 1995; Warburton et al., 1996; Wise et al., 1991). The activation noted in the patient group in the left dorsolateral prefrontal cortex and STG regions is also consistent with those studies that correlated resting metabolism or CBF using PET–SPECT with semantic performance (Grady et al., 1990; Grossman et al., 1997, 1998a).
It is important to place the current results in the context of the existing imaging studies of AD. Prior radioisotope methods measuring resting state have generally showed decreased metabolic rate or flow in AD, particularly for the temporal and parietal regions. PET–SPECT CBF activation studies have been less consistent but have demonstrated several patterns of abnormality in AD, with increased extent of activation the most recent and intriguing finding. Using fMRI, we found that the areas of activation in AD patients were similar to those observed in healthy elderly individuals in terms of location and peak amplitude of foci; however, the areas of activation were more spatially extended, consistent with the findings of Becker and colleagues in AD patients (Becker et al., 1996b, 1996c; Herbster et al., 1996).
Our data are generally consistent with this pattern but indicate that simple activation models in AD such as failure–reduced activation or compensatory overactivation are alone insufficient to account for the range of patterns. A more comprehensive but likely still incomplete description of possible profiles includes an absence of normal regional activation, present but anomalous activation in the form of spatially shifted peak foci, compensatory hyperactivation as indicated by increased peak amplitude or expanded region of activation, and recruitment of remote regions. All of these patterns were observed in the present study. For example, in addition to locally expanded recruitment, we also found evidence of more remote, contralateral frontal activation, perhaps suggesting a separate mechanism of reallocation. It may be important to distinguish between local and remote supplemental allocation of processing resources. The functional significance of remote versus local reorganization warrants future study.
Cognitive abilities in AD patients, to the extent that they are preserved, presumably reflect the integrity of remaining excitatory and inhibitory synaptic connections. With fewer intact synapses in AD the brain may have to recruit a spatially extended region to engage a similar number of intact synapses. The more diffuse activation in AD may reflect loss of cognitive efficiency due to the diminished density of synaptic connections (Haier et al., 1988). Similar observations have been reported for patients with mental retardation and Down syndrome (Haier et al., 1995).
Becker et al. (1996a) emphasize the role of neuropathologically altered cortical connections in explaining expanded representational fields indicated by PET studies of AD patients. These authors, positing essentially a deafferentation model, suggest that expanded extent of activation may reflect diminished input to cortical regions (Merzenich & Sameshima, 1993). Further, from a computational point of view, expanded extent may reflect a breakdown of constraints for processing by semantic networks and lead to instability (Tippet & Farah, 1994; Tippett et al., 1995). These mechanistic hypotheses, although not mutually exclusive, nonetheless may help to characterize the neural basis for changes in semantic processing in AD. If hypotheses regarding neuropathological changes adversely affecting input, structure, efficiency and computational stability of semantic networks are correct, then degree of atrophy in these regions in AD should predict degradation of the semantic networks reflected in abnormal activation, and should also correlate with degree of impairment of performance on semantic tasks. It will be useful for future neuroimaging investigations of AD to integrate morphometric analyses of atrophy with activation and performance profiles across stages of disease.
Our finding that performance on the category-exemplar task was strongly correlated with medial prefrontal activation, particularly for AD patients, suggests that the integrity of frontal brain systems, or at least the ability to allocate resources to these systems, is essential for successful semantic processing. Most prior imaging studies of semantic processing in normal subjects observed left prefrontal activation and authors have interpreted this as reflecting effortful, strategic, and executive aspects of semantic generation and decision-making (e.g., Petersen et al., 1988; Price et al., 1997; Shaywitz et al., 1995a). In fact, when we reanalyzed performance–activation covariation without the two most impaired patients (0% and 42% accuracy) on the exemplar task, the left prefrontal ROI was most robust in retaining this relationship. The specific attention and executive response mechanisms required by activation tasks are clearly important to consider with regard to activation patterns. Our strategy was to hold the structural requirements of the tasks constant so that task differences would reflect specific processing requirements rather than generic attentional and response demands. Specifically, in the phonologic task, the participant had to attend–decide–respond as in the other tasks, but the linguistic demand was at a very low level. In this task there was no left prefrontal activation in the controls and only a relatively small cluster in the patients in comparison to the other tasks. These results suggest that the observed left frontal activation on the semantic tasks is most likely due to higher level semantic processing and reasoning. Reaction time data for the phonological and semantic decisions might have aided interpretation but our initial studies used a pneumatic bulb that did not permit quantitative analysis of response latencies. However, the 7-s trial length used in the study was designed so that even patients with AD had ample time to respond; examination of the obtained latencies using the pneumatic bulb indicated that all responded well within 5 s.
It is noteworthy that our task performance results in AD patients included high correlations for both left and right prefrontal activation in a large medial region. This may reflect a compensatory role for the right hemisphere in semantic processing or decision making. Furthermore, the fact that task activation related signal change was moderately correlated among these anterior brain regions suggests that frontal functional interconnectivity is still present in patients with mild AD. This raises the interesting question for future studies as to whether this interconnectivity is lost in later stages of the disease, and if so, at what stage.
Given the extent of frontal contributions to semantic processing observed in the present study and by other investigations, it is interesting that lesion-based studies of semantic processing usually do not find impairment in comprehension of semantic relationships after damage to the IFG or MFG regions or after lesions of the medial prefrontal cortex, where we found the strong relationship between task performance and activation. Most available evidence suggests that critical areas for semantic networks involve temporal lobe neocortical sites, and that damage to these regions is most likely to affect semantic comprehension. We did observe left STG activation for both groups on the phonological and semantic tasks with the AD patients showing areas of present but reduced activation (lowered peak amplitude) in that region compared to controls. Because the strategic or decision making processes are common to the phonological as well as the semantic tasks, and should be cancelled out in this comparison, this consistent difference likely reflects dysfunction of sites involved in more basic elements of auditory phonological and semantic processing. Electrophysiological investigations of semantic processing during intracranial recording have also implicated this region (Nobre & McCarthy, 1995) as does the finding that naming is often a selective deficit shortly after dominant anterior temporal lobectomy (Saykin et al., 1995). Future studies of AD should examine temporal lobe regions comparing degree of atrophic changes to abnormalities of activation during semantic tasks.
Task difficulty in relation to stage of disease appears likely to be an important factor in accounting for activation patterns. On the exemplar task where patients showed more impaired performance; that is, greater task difficulty, additional regions in the right hemisphere were recruited. Our findings of increased spatial extent of frontal activation in the dorsolateral frontal regions (MFG and IFG) are consistent with the findings of Demb et al. (1995) who reported a correspondence between task difficulty and prefrontal activation using fMRI in healthy young adults.
Based on recent cognitive findings showing differences in sensitivity of subtypes of semantic processing to early AD, it seemed likely to us that different components of semantic memory might activate overlapping but also partially distinct brain systems. Therefore both performance data and activation pattern differences were of interest. In comparing cognitive performance between the category-exemplar and category-function tasks we failed to confirm Johnson and Hermann’s (1995) finding of greater sensitivity of function compared to categorical semantic relations in early AD. Instead, our data appear to suggest that early semantic processing deficits are greatest for categorical relations in AD. It is possible that differences in samples, stimuli, or task design modifications for the imaging experiment could account for some of these differences. However, the fact that our normal elderly group performed slightly (although not significantly) better on the exemplar than function task suggests that it was not intrinsically more difficult. Therefore, task difficulty would not easily explain the relatively worse performance on the exemplar than function tasks by AD patients. At a minimum, our results suggest that further research on types of semantic processing at various stages of disease is warranted. It is likely that the relative impairment on the category function task in patients with AD would reach statistical significance in a larger sample. Further, our finding of different patterns of activation in response to the function versus exemplar tasks in the healthy controls and AD patients is encouraging with regard to the potential for further dissection of the neural substrates involved in semantic processing. In view of the reports of category-specific semantic deficits; for example, for animate versus inanimate nouns (Montanes et al., 1995; Silveri et al., 1991; but see Tippett et al., 1996), suggesting differential neural representation for categories of knowledge (Damasio et al., 1996; Warrington & Shallice, 1984), functional imaging should hold potential to map differences in activation associated with these features. In addition to examining semantic content, it will be important to address modality (auditory or visual) of access (Caramazza et al., 1990; McCarthy & Warrington, 1990), processing demands, including structural task requirements such as decision making, and those that engage perceptual analysis, categorization, analysis of instrumental use of objects, and part–whole relationships.
A potential concern in studies using multiple task conditions with patients whose brain disorders have a relatively diffuse effect on cognition, such as in AD, is whether much of the result could be accounted for by task difficulty effects or global problems in processing information. Perhaps the most important factor supporting the validity of our results is the in-scanner performance data. The AD group’s highly accurate performance on the phonological task indicated their capacity to adapt to the situational demands imposed during an fMRI experiment. Our healthy elderly control group had comparable performance across tasks and there was little to suggest differential task difficulty. In contrast, the AD group was accurate on the phonological task but impaired on semantic processing. Given the markedly different spatial distribution of activation obtained on the semantic compared to the phonological task in the present study, we do not believe that a global processing deficit or task difficulty effect can account for the obtained findings. Instead, we believe these data provide evidence of a selective pattern of abnormalities in brain activation associated with semantic processing. This has been studied in detail with cognitive experiments but only to a limited extent with functional imaging in AD.
Our initial image analysis plan included between-task contrasts, modeled as Task × Condition (rest–active) × Group interactions, to examine areas involved in semantic processing beyond those required for lower level phonological processing. However, given the obtained task by region dissociation reflected by overtly different patterns of activation on the semantic compared to phonologic tasks (see Figures 2–4), we decided not to include additional voxel-by-voxel analyses that would unnecessarily inflate experiment-wise Type I error.
Although our sample size is typical of recent fMRI investigations, replication in a larger scale study will be important to confirm these findings. Larger samples will also permit systematic examination of participant factors that may moderate the types of results we observed. For example, sex and handedness are factors that have been associated with cerebral representation of language (Shaywitz et al., 1995b; Witelson, 1989). Future studies hopefully will be able to determine the extent that these factors interact with patterns of activation during semantic processing and influence semantic deficits in AD.
Subsequent investigations using higher temporal and spatial resolution instrumentation may also be able to further resolve patterns of abnormal activation. Other considerations for future studies include stimulation task item properties and the rate of stimulus presentation. The recent movement towards event-related fMRI experimental designs holds great promise for further decomposition of relationships among cognitive performance on individual subclasses of items and local physiological responses to processing demands. The ability to examine profiles of activation during performance of failed compared to passed items is another exciting possibility.
There are a number of clinical implications of our results. With numerous emergent pharmacological agents in or about to enter clinical trials, there is considerable, justifiable interest in earlier diagnosis of AD. There may be a substantial benefit of using these types of semantic memory or other activation paradigms to facilitate early diagnosis during preclinical stages of illness. It remains to be determined whether fMRI will have particular sensitivity to detection of pharmacologically induced changes above and beyond cognitive testing alone. However, the ability to examine differential responses of particular brain regions and physiological mechanisms in near real time holds great promise. The incremental value of combining quantitative structural MRI such as hippocampal volumetry (Johnson et al., 1998) with fMRI needs to be determined. We predict that there will be a complex set of interactions among drug mechanism, cognitive change, regional brain structure, activation pattern, and stage of disease. Innovative experimental designs will be required to elucidate these complex and interacting mechanisms.
ACKNOWLEDGMENTS
An earlier version of this paper was presented at the Annual Meeting of the International Neuropsychological Society (February 6, 1998, Honolulu, Hawaii). This research was supported by the Alzheimer’s Association (IIRG-94-133) (AJS), with additional support from NIH-NINDS Grant F32m NS10563 (SCJ), The Ira DeCamp Foundation (AJS), and New Hampshire Hospital, Concord, NH. The authors wish to thank Eric Wong of UCSD for the pulse sequence programs and reconstruction software used in this study, Karl Friston and Andrew Holmes for statistical advise on random effects and covariate models, and David Coffey, Robert Ferranti, James C. Ford, Stephen Guerin, Lawrence Jenkyn, Thomas McAllister, Thomas Oxman, Robert Vidaver and Heather Wishart for their help with or comments on various aspects of this investigation.
REFERENCES
- Agency for Health Care Policy and Research . Recognition and initial assessment of Alzheimer’s disease and related dementias. United States Department of Health and Human Services, Public Health Services; Rockville, MD: 1996. Clinical Practice Guideline 19. [Google Scholar]
- Albert MS. Cognitive and neurobiologic markers of early Alzheimer disease. Proceedings of the National Academy of Sciences. 1996;93:13546–13551. doi: 10.1073/pnas.93.24.13547. [DOI] [PMC free article] [PubMed] [Google Scholar]
- Battig WF, Montague WE. Category norms for verbal items in 56 categories: A replication and extension of the Connecticut category norms. Journal of Experimental Psychology Monograph. 1969;80:1–46. [Google Scholar]
- Becker JT, Lopez OL, Butters MA. Episodic memory: Differential patterns of breakdown. In: Morris RG, editor. The cognitive neuropsychology of Alzheimer-type dementia. Oxford University Press; New York: 1996a. pp. 70–88. [Google Scholar]
- Becker JT, Mintun MA, Aleva K, Wiseman MB, Nichols T, DeKosky ST. Alterations in functional neuroanatomical connectivity in Alzheimer’s disease. Positron emission tomography of auditory verbal short-term memory. Annals of the New York Academy of Sciences. 1996b;777:239–242. doi: 10.1111/j.1749-6632.1996.tb34425.x. [DOI] [PubMed] [Google Scholar]
- Becker JT, Mintun MA, Aleva K, Wiseman MB, Nichols T, DeKosky ST. Compensatory reallocation of brain resources supporting verbal episodic memory in Alzheimer’s disease. Neurology. 1996c;46:692–700. doi: 10.1212/wnl.46.3.692. [DOI] [PubMed] [Google Scholar]
- Benton AL, Hamsher K, Sivan AB. Multilingual Aphasia Examination. 3rd AJA Associates; Iowa City, IA: 1983. [Google Scholar]
- Binder JR, Frost JA, Hammeke TA, Cox RW, Rao SM, Prieto T. Human brain language areas identified by functional magnetic resonance imaging. Journal of Neuroscience. 1997;17:353–362. doi: 10.1523/JNEUROSCI.17-01-00353.1997. [DOI] [PMC free article] [PubMed] [Google Scholar]
- Binder JR, Swanson SJ, Hammeke TA, Morris GL, Mueller WM, Fischer M, Benbadis S, Frost JA, Rao SM, Haughton VM. Determination of language dominance using functional MRI: A comparison with the Wada test. Neurology. 1996;46:978–984. doi: 10.1212/wnl.46.4.978. [DOI] [PubMed] [Google Scholar]
- Blair JR, Spreen O. Predicting pre-morbid IQ: A revision of the National Adult Reading Test. Clinical Neuropsychologist. 1989;3:129–136. [Google Scholar]
- Butters N, Granholm EL, Salmon DP, Grant I, Wolfe J. Episodic and semantic memory: A comparison of amnestic and demented patients. Journal of Clinical and Experimental Neuropsychology. 1987;9:479–497. doi: 10.1080/01688638708410764. [DOI] [PubMed] [Google Scholar]
- Cabeza R, Nyberg L. Imaging cognition: An empirical review of PET studies with normal subjects. Journal of Cognitive Neuroscience. 1997;9:1–26. doi: 10.1162/jocn.1997.9.1.1. [DOI] [PubMed] [Google Scholar]
- Caramazza A, Hillis AE, Rapp BC, Romani C. Multiple semantics hypothesis: Multiple confusions. Cognitive Neuropsychology. 1990;7:161–169. [Google Scholar]
- Carlesimo GA, Oscar-Berman M. Memory deficits in Alzheimer’s patients: A comprehensive review. Neuropsychology Review. 1992;3:119–169. doi: 10.1007/BF01108841. [DOI] [PubMed] [Google Scholar]
- Chan AS, Butters N, Salmon DP. The deterioration of semantic networks in patients with Alzheimer’s disease: A cross-sectional study. Neuropsychologia. 1997;35:241–248. doi: 10.1016/s0028-3932(96)00067-x. [DOI] [PubMed] [Google Scholar]
- Chan AS, Butters N, Salmon DP, McGuire KA. Dimensionality and clustering in the semantic network of patients with Alzheimer’s disease. Psychology and Aging. 1993;8:411–419. doi: 10.1037//0882-7974.8.3.411. [DOI] [PubMed] [Google Scholar]
- Chan AS, Salmon DP, Butters N, Johnson SA. Semantic network abnormality predicts rate of cognitive decline in patients with probable Alzheimer’s disease. Journal of the International Neuropsychological Society. 1995;1:297–303. doi: 10.1017/s1355617700000291. [DOI] [PubMed] [Google Scholar]
- Chan KH, Johnson KA, Becker JA, Satlin A, Mendelson J, Garada B, Holman BL. A neural network classifier for cerebral perfusion imaging. Journal of Nuclear Medicine. 1994;35:771–774. [PubMed] [Google Scholar]
- Collins AM, Loftus EF. A spreading-activation theory of semantic processing. Psychological Review. 1975;82:407–428. [Google Scholar]
- Damasio H, Grabowski TJ, Tranel D, Hichwa RD, Damasio AR. A neural basis for lexical retrieval. Nature. 1996;380:499–505. doi: 10.1038/380499a0. [DOI] [PubMed] [Google Scholar]
- Delis DC, Kramer JH, Kaplan E, Ober BA. California Verbal Learning Test: Adult Version manual. The Psychological Corporation; San Antonio, TX: 1987. [Google Scholar]
- Demb JB, Desmond JE, Wagner AD, Vaidya CJ, Glover GH, Gabrieli JD. Semantic encoding and retrieval in the left inferior prefrontal cortex: A functional MRI study of task difficulty and process specificity. Journal of Neuroscience. 1995;15:5870–5878. doi: 10.1523/JNEUROSCI.15-09-05870.1995. [DOI] [PMC free article] [PubMed] [Google Scholar]
- Demonet JF, Chollet F, Ramsay S, Cardebat D, Nespoulous JL, Wise R, Rascol A, Frackowiak R. The anatomy of phonological and semantic processing in normal subjects. Brain. 1992;115:1753–1768. doi: 10.1093/brain/115.6.1753. [DOI] [PubMed] [Google Scholar]
- Evans AC, Collins DL, Holmes CJ. Computational approaches to quantifying human neuroanatomical variability. In: Toga AW, Mazziotta JC, editors. Brain mapping: The methods. Academic Press; London: 1996. pp. 343–361. [Google Scholar]
- Fiez JA. Phonology, semantics, and the role of the left inferior prefrontal cortex. Human Brain Mapping. 1997;5:79–83. [PubMed] [Google Scholar]
- Fiez JA, Raichle ME, Balota DA, Tallal P, Petersen SE. PET activation of posterior temporal regions during auditory word presentation and verb generation. Cerebral Cortex. 1996a;6:1–10. doi: 10.1093/cercor/6.1.1. [DOI] [PubMed] [Google Scholar]
- Fiez JA, Raife EA, Balota DA, Schwarz JP, Raichle ME, Petersen SE. A positron emission tomography study of the short-term maintenance of verbal information. Journal of Neuroscience. 1996b;16:808–822. doi: 10.1523/JNEUROSCI.16-02-00808.1996. [DOI] [PMC free article] [PubMed] [Google Scholar]
- Francis WN, Kucera H. Frequency analysis of English usage: Lexicon and grammar. Houghton Mifflin Company; Boston: 1982. [Google Scholar]
- Friston KJ, Holmes AP, Worsley KJ, Poline JP, Frith CD, Frackowiak RSJ. Statistical parametric maps in functional imaging: A general linear approach. Human Brain Mapping. 1995;2:189–210. [Google Scholar]
- Goodglass H, Kaplan E. The assessment of aphasia and related disorders. 2nd Lea & Febiger; Philadelphia: 1987. [Google Scholar]
- Grady CL, Haxby JV, Schapiro MB, Gonzalez Aviles A, Kumar A, Ball MJ, Heston L, Rapoport SI. Sub-groups in dementia of the Alzheimer type identified using positron emission tomography. Journal of Neuropsychiatry and Clinical Neuroscience. 1990;2:373–384. doi: 10.1176/jnp.2.4.373. [DOI] [PubMed] [Google Scholar]
- Greene JDW, Hodges JR. Semantic processing. In: Morris RG, editor. The cognitive neuropsychology of Alzheimer-type dementia. Oxford University Press; Oxford, U.K.: 1996. pp. 128–148. [Google Scholar]
- Grossman M, D’Esposito M, Hughes E, Ornishi K, Biassou N, White-Devine T, Robinson KM. Language comprehension difficulty in Alzheimer’s disease, vascular dementia, and fronto-temporal degeneration. Neurology. 1996;47:183–189. doi: 10.1212/wnl.47.1.183. [DOI] [PubMed] [Google Scholar]
- Grossman M, Payer F, Onishi K, D’Esposito M, Morrison D, Sadek A, Alavi A. Language comprehension and regional cerebral defects in frontotemporal degeneration and Alzheimer’s disease. Neurology. 1998a;50:157–163. doi: 10.1212/wnl.50.1.157. [DOI] [PubMed] [Google Scholar]
- Grossman M, Payer F, Onishi K, White-Devine T, Morrison D, D’Esposito M, Robinson K, Alvali A. Constraints on the cerebral basis for semantic processing from neuroimaging studies of Alzheimer’s disease. Journal of Neurology, Neurosurgery, and Psychiatry. 1997;63:152–158. doi: 10.1136/jnnp.63.2.152. [DOI] [PMC free article] [PubMed] [Google Scholar]
- Grossman M, Robinson K, Biassou N, White-Devine T, D’Esposito M. Semantic memory in Alzheimer’s disease: Representativeness, ontologic category, and material. Neuropsychology. 1998b;12:34–42. doi: 10.1037//0894-4105.12.1.34. [DOI] [PubMed] [Google Scholar]
- Haier RJ, Chueh D, Touchette P, Lott I, Buchsbaum MS, MacMillan D, Sandman C, LaCasse L, Sosa E. Brain size and cerebral glucose metabolic rate in nonspecific mental retardation and Down syndrome. Intelligence. 1995;20:191–210. [Google Scholar]
- Haier RJ, Siegel BV, Nuechterlein KH, Hazlett E, Wu JC, Paek J, Browning HL, Buchsbaum MS. Cortical glucose metabolic rate correlates of abstract reasoning and attention studied with positron emission tomography. Intelligence. 1988;12:199–217. [Google Scholar]
- Heaton RK, Chelune GJ, Talley JL, Kay GG, Curtis G. Wisconsin Card Sorting Test manual revised and expanded. Psychological Assessment Resources; Odessa, FL: 1993. [Google Scholar]
- Herbster AN, Nichols T, Wiseman MB, Mintun MA, De-Kosky ST, Becker JT. Functional connectivity in auditory-verbal short-term memory in Alzheimer’s disease. Neuroimage. 1996;4:67–77. doi: 10.1006/nimg.1996.0030. [DOI] [PubMed] [Google Scholar]
- Holmes AP, Friston KJ. Generalisability, random effects, and population inference. Neuroimage. 1998;7:S754. [Google Scholar]
- Johnson MK, Hermann AM. Semantic relations and Alzheimer’s disease: An early and disproportionate deficit in functional knowledge. Journal of the International Neuropsychological Society. 1995;1:568–574. doi: 10.1017/s1355617700000709. [DOI] [PubMed] [Google Scholar]
- Johnson SC, Saykin AJ, Flashman LA, Riordan HJ. Reduction of hippocampal formation in Alzheimer’s disease and correlation with memory: A meta-analysis. Journal of the International Neuropsychological Society. 1998;4:22. Abstract. [Google Scholar]
- Kaszniak AW. The neuropsychology of dementia. In: Grant I, Adams K, editors. Neuropsychological assessment of neuropsychiatric disorders. Oxford University Press; New York: 1986. pp. 172–220. [Google Scholar]
- Kessler J, Ghaemi M, Mielke R, Herholz K, Heiss WD. Visual versus auditory memory stimulation in patients with probable Alzheimer’s disease: A PET study with 18 FDG. Annals of the New York Academy of Science. 1996;777:233–238. doi: 10.1111/j.1749-6632.1996.tb34424.x. [DOI] [PubMed] [Google Scholar]
- Kessler J, Herholz K, Grond M, Heiss WD. Impaired metabolic activation in Alzheimer’s disease: A PET study during continuous visual recognition. Neuropsychologia. 1991;29:229–243. doi: 10.1016/0028-3932(91)90084-l. [DOI] [PubMed] [Google Scholar]
- Martin A, Haxby JV, Lalonde FM, Wiggs CL, Ungerleider LG. Discrete cortical regions associated with knowledge of color and knowledge of action. Science. 1995;270:102–105. doi: 10.1126/science.270.5233.102. [DOI] [PubMed] [Google Scholar]
- Mattis S. Dementia Rating Scale (DRS) professional manual. Psychological Assessment Resources; Odessa, FL: 1988. [Google Scholar]
- McCarthy RA, Warrington EK. Evidence for modality specific meaning systems in the brain. Nature. 1990;334:428–430. doi: 10.1038/334428a0. [DOI] [PubMed] [Google Scholar]
- McKhann G, Drachman D, Folstein M, Katzman R, Price D, Stadlan EM. Clinical diagnosis of Alzheimer’s disease: Report of the NINCDS–ADRDA workgroup under the auspices of the Department of Health and Human Services Task Force on Alzheimer’s disease. Neurology. 1984;34:939–944. doi: 10.1212/wnl.34.7.939. [DOI] [PubMed] [Google Scholar]
- Merzenich MM, Sameshima K. Cortical plasticity and memory. Current Opinion in Neurobiology. 1993;3:187–196. doi: 10.1016/0959-4388(93)90209-h. [DOI] [PubMed] [Google Scholar]
- Mesulam MM. Large-scale neurocognitive networks and distributed processing for attention, language, and memory. Annals of Neurology. 1990;28:597–613. doi: 10.1002/ana.410280502. [DOI] [PubMed] [Google Scholar]
- Montanes P, Goldblum MC, Boller F. The naming impairment of living and nonliving items in Alzheimer’s disease. Journal of the International Neuropsychological Society. 1995;1:39–48. doi: 10.1017/s1355617700000084. [DOI] [PubMed] [Google Scholar]
- Murtha S, Chertkow H, Beauregard M, Dixon R, Evans A. Anticipation causes increased blood flow to the anterior cingulate cortex. Human Brain Mapping. 1996;4:103–112. doi: 10.1002/(SICI)1097-0193(1996)4:2<103::AID-HBM2>3.0.CO;2-7. [DOI] [PubMed] [Google Scholar]
- Nobre AC, McCarthy G. Language-related field potentials in the anterior-medial temporal lobe: II. Effects of word type and semantic priming. Journal of Cognitive Neuroscience. 1995;15:1090–1098. doi: 10.1523/JNEUROSCI.15-02-01090.1995. [DOI] [PMC free article] [PubMed] [Google Scholar]
- Norton LE, Bondi MW, Salmon DP, Goodglass H. Deterioration of generic knowledge in patients with Alzheimer’s disease: Evidence from the Number Information Test. Journal of Clinical and Experimental Neuropsychology. 1997;19:857–866. doi: 10.1080/01688639708403766. [DOI] [PubMed] [Google Scholar]
- Petersen SE, Fox PT, Posner MI, Mintun M, Raichle ME. Positron emission tomographic studies of the cortical anatomy of single word processing. Nature. 1988;331:585–589. doi: 10.1038/331585a0. [DOI] [PubMed] [Google Scholar]
- Price CJ, Moore CJ, Humphreys GW, Wise RJS. Segregating semantic from phonological processes during reading. Journal of Cognitive Neuroscience. 1997;9:727–733. doi: 10.1162/jocn.1997.9.6.727. [DOI] [PubMed] [Google Scholar]
- Reisberg B. Alzheimer’s Disease. In: Sadavoy J, editor. Comprehensive review of geriatric psychiatry. 2nd II. American Psychiatric Press; Washington DC: 1996. pp. 401–458. [Google Scholar]
- Reitan RM, Wolfson D. The Halstead-Reitan Neuropsychological Test Battery: Theory and clinical interpretation. 2nd Neuropsychology Press; Tucson, AZ: 1993. [Google Scholar]
- Rumelhart D, McClelland J. Parallel distributed processing: Explorations in the microstructure of cognition. Vol. 1. MIT Press; Cambridge, MA: 1986. [DOI] [PubMed] [Google Scholar]
- Saykin AJ, Stafiniak P, Robinson LJ, Sperling MR, Gur RC, O’Connor MJ. Language before and after temporal lobectomy: Specificity of acute changes and relation to early risk factors. Epilepsia. 1995;36:1071–1077. doi: 10.1111/j.1528-1157.1995.tb00464.x. [DOI] [PubMed] [Google Scholar]
- Shaywitz BA, Pugh KR, Constable RT, Shaywitz SE, Bronen RA, Fulbright RK, Katz L, Fletcher JM, Skudlarski P, Gore JC. Localization of semantic processing using functional magnetic resonance imaging. Human Brain Mapping. 1995a;2:149–158. [Google Scholar]
- Shaywitz BA, Shaywitz SE, Pugh KR, Constable RT, Skudlarski P, Fulbright RK, Bronen RA, Fletcher JM, Shankweller DP, Katz L, Gore JC. Sex differences in the functional organization of the brain for language. Nature. 1995b;373:607–609. doi: 10.1038/373607a0. [DOI] [PubMed] [Google Scholar]
- Shimamura AP. Disorders of memory: The cognitive science perspective. In: Boller F, Grafman J, editors. Handbook of neuropsychology. Elsevier Science Publishers; Amsterdam: 1989. pp. 35–39. [Google Scholar]
- Silveri MC, Daniele A, Giustolisi L, Gainotti G. Dissociation between knowledge of living and nonliving things in dementia of the Alzheimer type. Neurology. 1991;41:545–546. doi: 10.1212/wnl.41.4.545. [DOI] [PubMed] [Google Scholar]
- Spitzer M, Kwong KK, Kennedy W, Rosen BR, Belliveau JW. Category-specific brain activation in fMRI during picture naming. Neuroreport. 1995;6:2109–2112. doi: 10.1097/00001756-199511000-00003. [DOI] [PubMed] [Google Scholar]
- Talairach J, Tournoux P. Co-planar stereotaxic atlas of the human brain. Thieme; Stuttgart, Germany: 1988. [Google Scholar]
- Terry RD, Katzman R. Senile dementia of the Alzheimer type. Annals of Neurology. 1983;14:497–506. doi: 10.1002/ana.410140502. [DOI] [PubMed] [Google Scholar]
- Tippet LJ, Farah MJ. A computational model of naming in Alzheimer’s disease: Unitary or multiple impairments? Neuropsychology. 1994;8:3–13. [Google Scholar]
- Tippett LJ, Grossman M, Farah MJ. The semantic memory impairment of Alzheimer’s disease: Category-specific? Cortex. 1996;32:143–153. doi: 10.1016/s0010-9452(96)80023-2. [DOI] [PubMed] [Google Scholar]
- Tippett LJ, McAuliffe S, Farah MJ. Preservation of categorical knowledge in Alzheimer’s disease: A computational account. Memory. 1995;3:519–533. doi: 10.1080/09658219508253163. [DOI] [PubMed] [Google Scholar]
- Tulving E, Donaldson W. The organization of memory. Academic Press; New York: 1972. [Google Scholar]
- Warburton E, Wise RJ, Price CJ, Weiller C, Hadar U, Ramsay S, Frackowiak RS. Noun and verb retrieval by normal subjects: Studies with PET. Brain. 1996;119:159–179. doi: 10.1093/brain/119.1.159. [DOI] [PubMed] [Google Scholar]
- Warrington EK, Shallice T. Category specific semantic impairments. Brain. 1984;107:829–854. doi: 10.1093/brain/107.3.829. [DOI] [PubMed] [Google Scholar]
- Wechsler D. Wechsler Adult Intelligence Scale–Revised. The Psychological Corporation; New York: 1981. [Google Scholar]
- Wechsler D. Wechsler Memory Scale–Revised. The Psychological Corporation; New York: 1986. [Google Scholar]
- Wise R, Chollet F, Hadar U, Friston K, Hoffner E, Frackowiak R. Distribution of cortical neural networks involved in word comprehension and word retrieval. Brain. 1991;114:1803–1817. doi: 10.1093/brain/114.4.1803. [DOI] [PubMed] [Google Scholar]
- Witelson SF. Hand and sex differences in the isthmus and genu of the human corpus callosum: A postmortem morphological study. Brain. 1989;112:799–835. doi: 10.1093/brain/112.3.799. [DOI] [PubMed] [Google Scholar]
- Worsley KJ, Friston KJ. Analysis of fMRI time-series revisited—again. Neuroimage. 1995;2:173–181. doi: 10.1006/nimg.1995.1023. [DOI] [PubMed] [Google Scholar]
- Worsley KJ, Marrett S, Neelin P, Vandal AC, Friston KJ, Evans AC. A unified statistical approach for determining significant signals in images of cerebral activation. Human Brain Mapping. 1996;4:58–73. doi: 10.1002/(SICI)1097-0193(1996)4:1<58::AID-HBM4>3.0.CO;2-O. [DOI] [PubMed] [Google Scholar]