Abstract
Microcystic macular edema (MME) is a term used to describe pseudocystic spaces in the inner nuclear layer (INL) of the human retina. It has been noted in multiple sclerosis (MS) as well as a variety of other diseases. The processes that lead to MME formation and their change over time have yet to be explained sufficiently. The low rate at which MME occurs within such diverse patient groups makes the identification and consistent quantification of this pathology important for developing patient-specific prognoses. MME is observed in optical coherence tomography (OCT) scans of the retina as changes in light reflectivity in a pattern suggestive of fluid accumulations called pseudocysts. Pseudocysts can be readily identified in higher signal-to-noise ratio (SNR) images, however pseudocysts can be indistinguishable from noise in lower SNR scans. In this work, we expand upon our earlier MME identification methods on Spectralis OCT scans to handle lower quality Cirrus OCT scans. Our approach uses a random forest classifier, trained on manual segmentation of ten subjects, to automatically detect MME. The algorithm has a true positive rate for MME identification of 0.95 and a Dice score of 0.79. We include a preliminary longitudinal study of three patients over four to five years to explore the longitudinal changes of MME. The patients with relapsing-remitting MS and neuromyelitis optica appear to have dynamic pseudocyst volumes, while the MME volume appears stable in the one patient with primary progressive MS.
Keywords: OCT, retina, segmentation, microcystic macular edema
1. INTRODUCTION
Microcystic macular edema (MME) is a pathology of the retina whereby pseudocysts, or small hyporeflective cystic spaces, appear predominately within the inner nuclear layer (INL). MME has been observed in approximately 5% of patients with multiple sclerosis (MS)1, 2 and has been discovered in a variety of other patient groups3 such as age-related macular degeneration, neuromyelitis optica (NMO), and diabetic retinopathy;4, 5 some reports suggest a relationship with Müller cell dysfunction.3 Although we cannot currently predict the occurrence of MME over the progression of disease, it has been found to occur more often in patients with greater disease severity. In MS patients, MME was shown to be associated with greater patient disability and a higher rate of disease progression.2 Obtaining a deeper understanding of both the underlying mechanisms and the implications of MME are crucial since it presents itself to such a broad range of patient groups at an unknown stage of disease. A lack of understanding of the formation and course of MME over time also necessitates further analysis on longitudinal data of patients with MME.
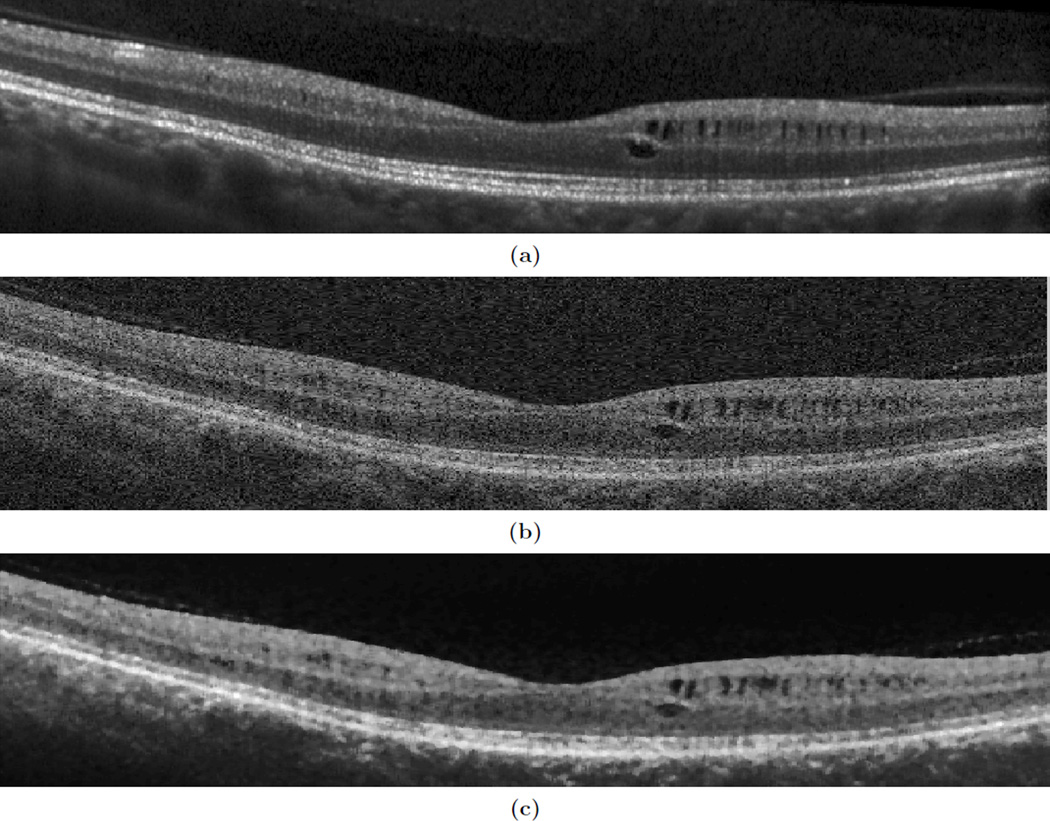
Optical coherence tomography (OCT) provides a powerful diagnostic tool for exploring various retinal pathologies including MME. Near-infrared light from the OCT scanner penetrates retinal layers at the back of the eye, and detects backscattered light to create an image of the various retinal layers. An example of the appearance of MME in a B-scan (slice of an OCT image) can be seen in Fig. 1(a).
Figure 1.
Shown are B-scans of the same subject in approximately the same location for (a) a Spectralis and (b) a Cirrus scanner, and (c) the corresponding denoised image of the Cirrus.
In our previous work,6, 7 we used a pixel classification approach to segment MME from images acquired from a Heidelberg Spectralis scanner. In this work, we use a similar approach on a Zeiss Cirrus scanner. The Spectralis has far superior image quality as each B-scan is generated by averaging multiple images of the same location, with the resulting scans having signal-to-noise ratios (SNR) in the range of 20 dB to 38 dB and typical means of 30 dB. In contrast, a B-scan from a Cirrus scanner is the product of a single sweep of the OCT scanner and has an SNR range of 20 dB to 26 dB,8 with a mean of 23 dB. Examples of both can be seen in Figs. 1(a) and 1(b). Most of the current literature on MME analyzes only the Spectralis data because it is more difficult to distinguish MME on Cirrus data. Developing a method to quantify MME on Cirrus images would be a very important step forward for the usefulness and application of our detection method, enabling a large step forward in our understanding of MME.
We have enhanced our MME identification algorithm with an added denoising approach for the lower SNR data, as well as modifying the features used in the classifier. These additions have lead to a true-positive pseudocyst identification rate of 0.95 and a Dice score of 0.79. Despite the decrease in SNR, this work shows great improvement from our previous work, which had a true-positive pseudocyst identification rate of 0.85 on better quality data. Additionally, the algorithm can differentiate between MME and non-MME subjects on the Cirrus data, thus providing an important classification tool.
Finally, we include a preliminary pilot longitudinal study of three patients to explore the stability of MME in different groups over time. Analyzing MME longitudinally could lead to improved understanding of the nature of MME in relation to disease severity providing insight about causes of pseudocyst formation. Comparing MME across these patients with different diagnoses could lead to insight about how MME formation can be characterized between different conditions.
2. METHODS
2.1 Intensity Normalization and Denoising
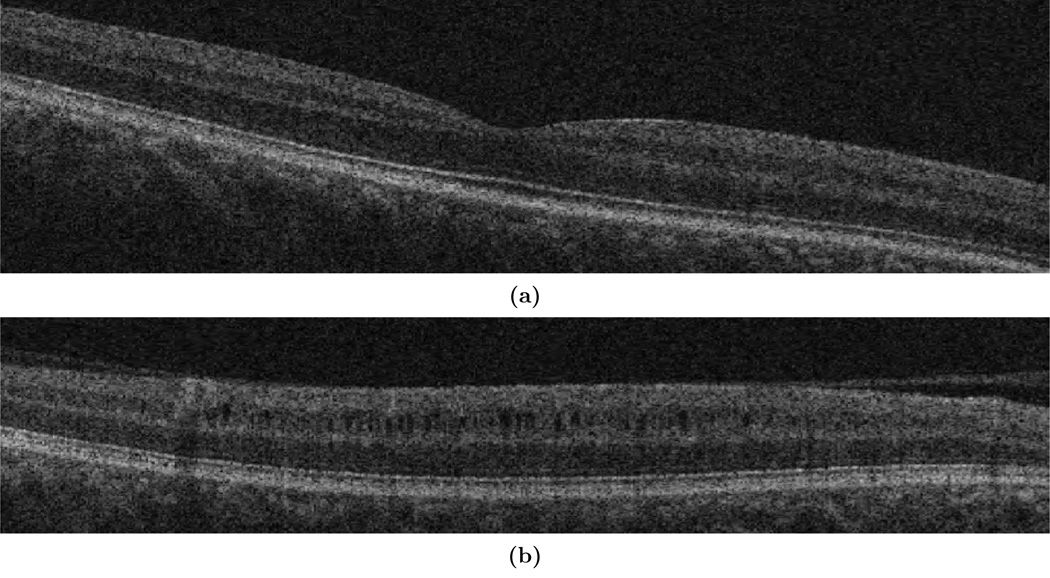
Before running the MME data through the classifier, the intensities were normalized to make both the pseudocyst and background intensities more uniform between subjects. The Cirrus scanner outputs a measure of the signal strength (SS) of the data which directly correlates to the intensity of the tissues (lower signal strength means lower intensity). Generally, scans are labeled as “high-quality scans” if they fall within a SS of 7–10 (out of 10).9 Despite this, there is a large difference in image quality between a SS of 7 and SS of 10. Figures 2(a) and 2(b) show this quality difference. The amount of noise and the intensity difference between a SS of 7 and SS of 10 vastly affects what both a manual rater and the algorithm classify as a cyst. Since there was much uncertainty in manual segmentation for scans with SS < 9 due to the amount of noise present, only SS of 9 and 10 were included in our study. Fortunately, out of a selection of 277 scans from 48 subjects, only 49 scans (18%) had SS below 9.
Figure 2.
B-scans of MME subjects with signal strengths of (a) 7 and (b) 10
To further compensate for signal strength, a scalar correction factor was applied across the entire volume to bring the SS-dependent intensities closer together. This correction factor was computed based on the average INL intensity across multiple subjects for the two SS levels in our data (SS = 9 or 10) where the INL was delineated using an automated layer segmentation algorithm.10 As a final step towards intensity normalization, a previously described robust contrast stretching method was used to normalize each B-scan independently.10
Next, we filtered the data to enhance the MME appearance by using a median filter (17×17 µm kernel size) followed by a bilateral filter (σd = 125 µm, σr = 0.1). Together, these filters act to reduce the noise while enhancing the edges of the pseudocysts. An example OCT image before and after applying these filters can be seen in Fig. 1(b) and Fig. 1(c).
These intensity normalization and denoising techniques, which are more comprehensive and robust than our previous method applied to Spectralis images,6, 7 are needed due to the lower SNR of the Cirrus images. Enforcing similar intensities for images across different patients, particularly in the INL, and reducing the level of noise are not only important for the algorithm to detect pseudocysts in the noisier Cirrus images, but also for consistent manual segmentation.
2.2 MME Classification
For the detection of pseudocysts in Cirrus images, we chose to use a random forest classifier (RFC), which shows accurate performance when compared to other algorithms despite its simplicity, and has successfully been used for segmentation in our previous OCT-related work.6, 7, 10 In total, the RFC uses 50 trained decision trees based on the response of 14 features, described in Sec. 2.2.1, from manual segmentation data. Utilizing the trained RFC, each decision tree independently uses the set of features computed at each pixel of a new image to classify the pixel as either pseudocyst or background. The collection of tree outputs is then combined using a majority vote to ultimately decide the pixel classification.
2.2.1 Features
The RFC utilized 14 features to classify MME pixels. The first feature is the proportional distance along each A-scan between the outer boundaries of the retina, the inner limiting membrane (ILM) and Bruch’s membrane (BrM), found as described in Lang et al.10 As mentioned previously, we found that all of the MME pixels lie between 45% and 90% of the distance from the BrM to ILM and later use this fact to restrict the search space of the algorithm. The next 12 features are composed of the intensity, gradient magnitude, and Laplacian of Gaussian filtered at four different scales (0, 5, 10, 15 µm). Finally, we use the SS as a feature to help account for any intensity differences not corrected for by the normalization.
Although many of these features are similar to the features selected for our previous work with Spectralis images, we focus more on intensity for the Cirrus data. Morphological operators are not used due to the vast amount of noise present in B-scans. The intensity, gradient magnitude, and Laplacian of Gaussian are each utilized at four different scales to maximize analysis of intensity difference between the cyst and the background, as opposed to random intensity differences present due to noise. In our previous work, a measure similar to SS was not used with the Spectralis data because the provided measure of signal quality does not correlate well with changes in the appearance of pseudocysts.
2.2.2 Classifier Training
The classifier was trained on ten MME subjects in addition to two volumes from healthy control (HC) subjects, one with SS = 9 and the other SS = 10. The accuracy of the algorithm increased as more MME subjects were added to the training, but when > 10 MME subjects were included the algorithm took much longer and did not show a noticeable increase in accuracy. The two HC volumes were included to aid in prevention of false positives (FP) in other images.
All pseudocyst pixels were included for training, and 20% of non-pseudocyst pixels within 45% and 90% of the retina distance from the BrM to the ILM were sampled. This range of 45% to 90% was used because all of the manual segmentation fell within 51% to 87% of the distance from the BrM to the ILM.
3. RESULTS
3.1 Pseudocyst Detection
OCT scans were obtained on a Zeiss Cirrus scanner (Carl Zeiss Meditec Inc., Dublin, CA), which imaged a 6×6 mm area of the macula. Scans of ten subjects with MME were acquired with 128 B-scans and 512 A-scans per B-scan. Half of the subject’s scans had a SS of 9 and half had a SS of 10. Manual segmentation of the pseudocysts was performed for each subject; ten B-scans were manually delineated for each subject. From the manual segmentation it was determined that the pseudocysts lie within a radius of 0.49 and 2.86 mm from the center of the fovea. This shows that the pseudocysts form an annulus around the fovea that does not cover the entire 6×6 mm area of the macula.
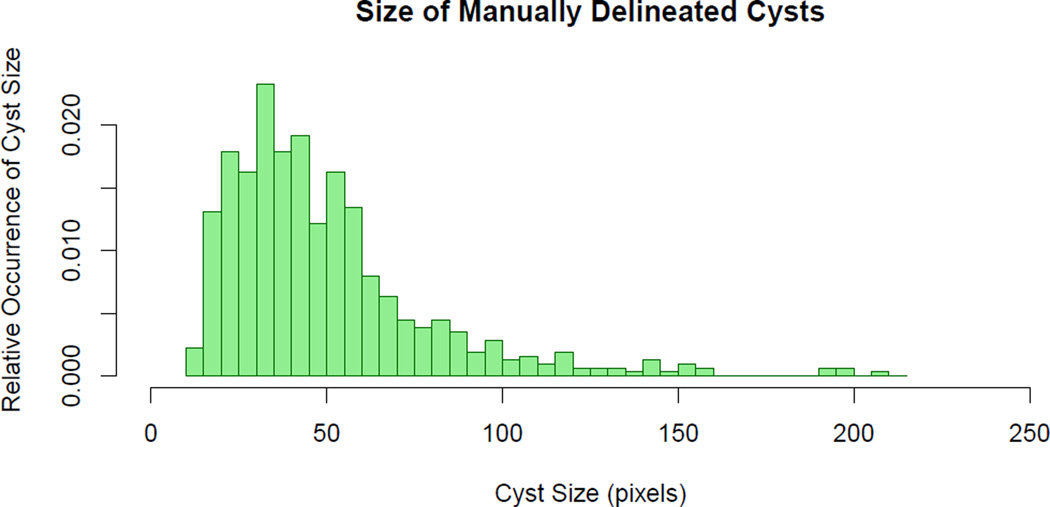
A histogram of the size of pseudocysts based on the manual segmentation is shown in Fig. 3. This graph illustrates that the manual rater was not able to reliably segment pseudocysts < 14 pixels, due to image noise. We therefore removed all pseudocysts found by the algorithm smaller than this threshold. From this manual segmentation data it was also determined that the average pseudocyst size was 50.6 pixels, which corresponds to an area of 1,184 µm2.
Figure 3.
Histogram showing the relative occurrence of manually delineated pseudocyst sizes in 100 B-scans.
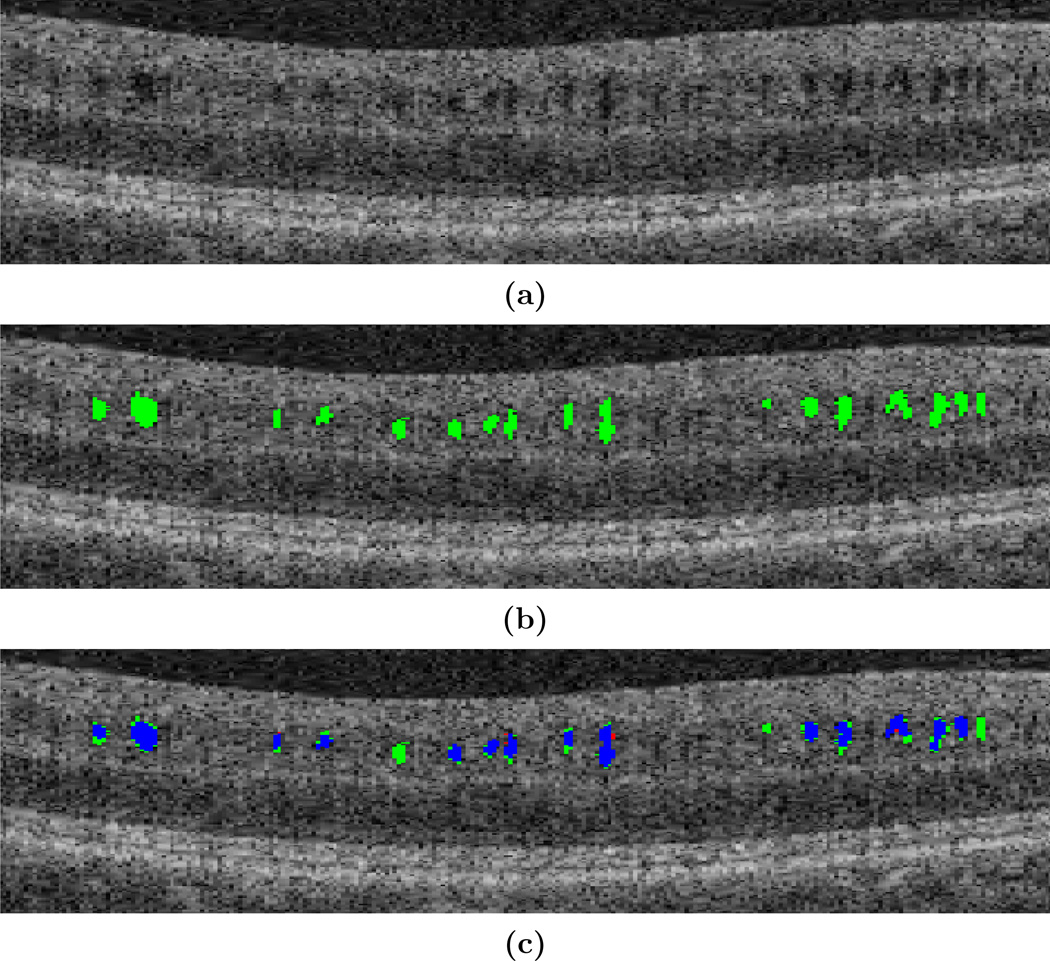
A leave-one-out approach was used to validate the performance of the algorithm. This involved creating ten classifiers, each containing nine MME subjects and two HC subjects for testing on the remaining MME subject. Training the classifier took an average of 23 minutes, and the algorithm took an average of 6 minutes to classify a new volume. With true positive (TP) results for this experiment shown in Table 1, we see that the algorithm had a TP rate of 95.2% against the manual rater. The results of the algorithm on one B-scan are shown in Fig. 4. Overall, the algorithm has excellent agreement with the manual segmentation, as shown in blue, and has few false positives (FPs), shown in green. The mean number of FPs for each volume containing ten manually segmented B-scans is 16.4 pseudocysts, which equates to 1.6 FPs per B-scan. However, due to the noise of the image it is difficult to discern with certainty what is and is not a pseudocyst. The mean Dice coefficient was found to be 0.79, which is affected by slight disagreements in the pseudocyst border and due to the small size of the pseudocysts.
Table 1.
Leave-one-out validation using ten MME subjects and two HCs. A pseudocyst from the algorithm is a connected component of 14 or more pseudocyst-classified pixels.
| Pseudocyst Pixels | Pseudocysts Detected | |
|---|---|---|
| Correctly Segmented | 28,267 | 597 |
| Manually Segmented | 31,732 | 627 |
| % Correctly Detected | 89.1 | 95.2 |
Figure 4.
Results of the MME detection algorithm overlaid onto a cropped and zoomed portion of a B-scan. Shown are (a) the original image, (b) the algorithm overlaid in green, (c) the algorithm and manual segmentation overlaid together, where green = false positive, red = false negative, blue = true positive.
The algorithm was next evaluated on ten new MME (five SS = 9; five SS = 10) and ten new HC (five SS = 9; five SS = 10) subjects using the classifier trained on all ten MME and two HC volumes as previously mentioned. A significant difference was found in the number of pseudocysts between the two cohorts (p-value < 0.005); see Table 2 for more results. As the SS decreases, more pseudocysts are found in the HCs, perhaps due to the increase in intensity inhomogeneity within the volumes.
Table 2.
A comparison of the algorithm performance on HC and MME subjects, each group containing ten subjects. The mean number of pseudocysts detected and the mean size of pseudocysts found are shown, with standard deviations in parenthesis. Each cohort is then further stratified into SS = 9 and SS = 10.
| # Pseudocysts Detected | Pseudocyst Size | ||
|---|---|---|---|
| SS = 9 or 10 | HC | 34.7(55.8) | 20.5(7.4) |
| MME | 326.5(365.8) | 40.9(12.8) | |
| SS = 9 | HC | 60.3(70.0) | 23.6(6.4) |
| MME | 285.7(261.5) | 41.7(14.9) | |
| SS = 10 | HC | 9.0(14.6) | 16.6(6.9) |
| MME | 367.2(458.7) | 40.2(11.1) | |
3.2 Longitudinal study
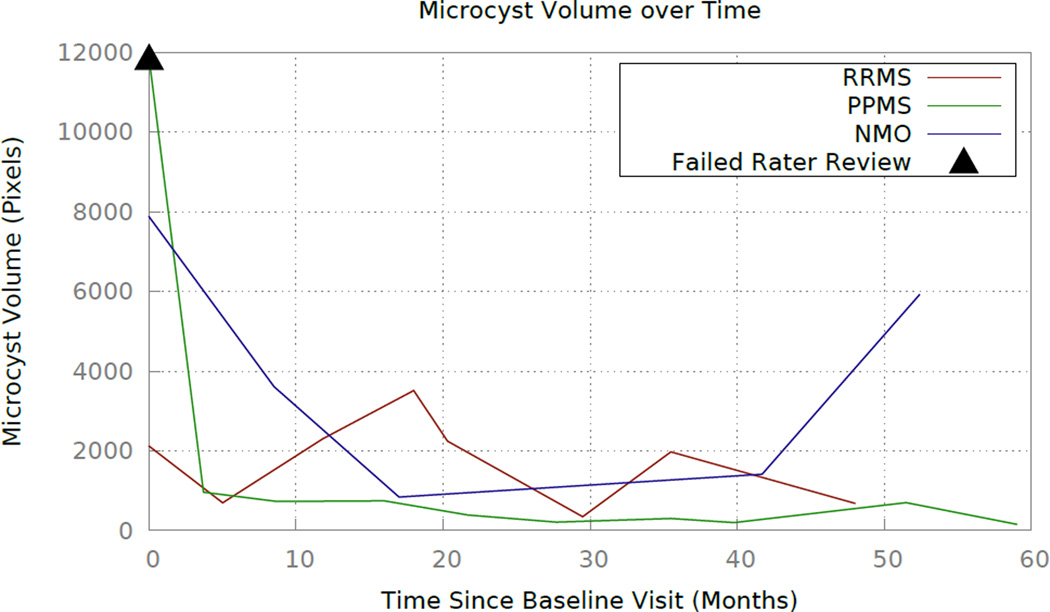
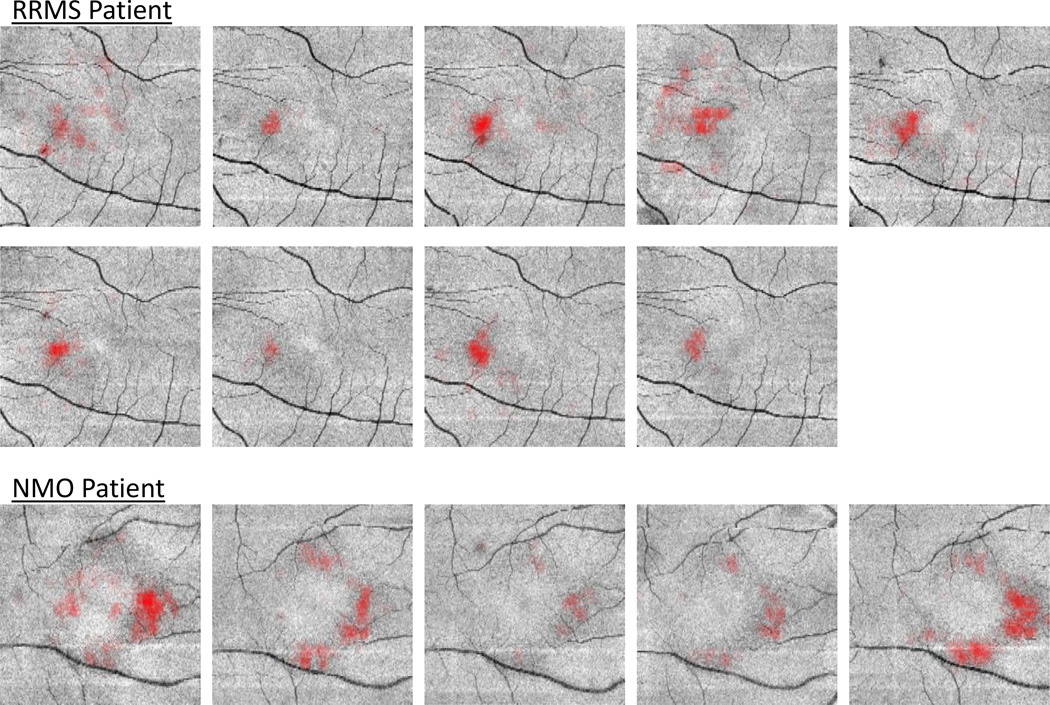
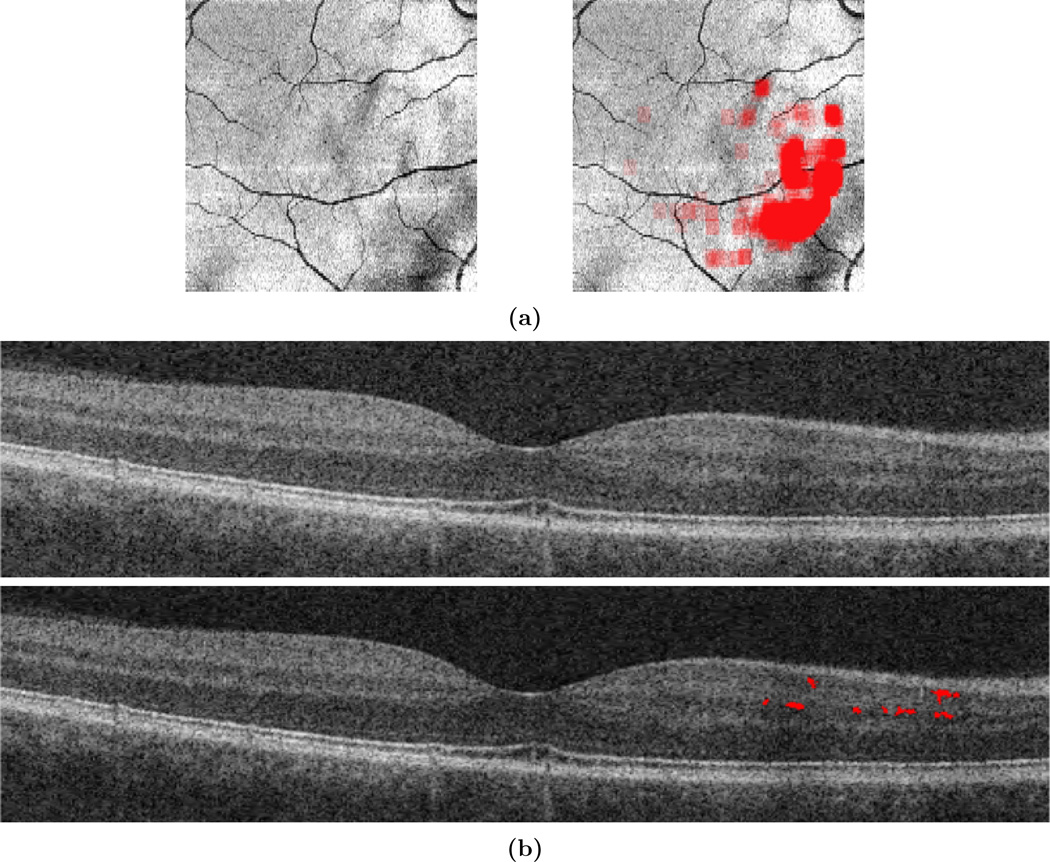
Finally, the algorithm was evaluated on longitudinal data for three subjects: one subject with relapsing-remitting MS (RRMS); one subject with primary-progressive MS (PPMS); and the remaining subject diagnosed with NMO. The subjects have eight, ten, and five visits respectively, and the average time between visits is 8 months. These subjects were selected as an exploratory longitudinal study because they have three different diagnoses that are known to be associated with MME, and each has at least four years of longitudinal data. Due to the lack of knowledge about MME dynamics over time, it is crucial to evaluate subject data over the longest period possible to obtain the most information. Fig. 5 shows the volume of pseudocysts found by the algorithm over time. In Fig. 6, we show the progression of the spatial density of the pseudocysts overlaid on the fundus image at each visit for the RRMS and NMO subjects. The PPMS subject was excluded from this figure due to the overall low density of pseudocysts. Our manual rater reviewed the results of the algorithm and the baseline visit for the PPMS subject (marked with a black triangle in Fig. 5) was the only result deemed to be of poor quality. The fundus image and algorithm output from this visit are shown in Fig. 7(a) along with a sample B-scan with false positive pseudocysts overlaid in Fig. 7(b); it is apparent that the algorithm fails due to poor image quality.
Figure 5.
Plot displaying pseudocyst volume found for three subjects. The triangle denotes a result deemed to be poor quality after being reviewed by our rater.
Figure 6.
Longitudinal progression of spatial density of the pseudocysts overlaid on the fundus images of each visit for the RRMS and NMO patients. The images are increasing in time from left to right and top to bottom.
Figure 7.
(a) The fundus image and corresponding algorithm output for the first visit of the PPMS patient which was deemed to have poor quality, as evaluated by our manual rater. (b) A B-scan image and the overlaid false positive pseudocysts from this subject.
4. CONCLUSIONS
In this work, an algorithm was created to detect MME within the retina from images acquired with the Zeiss Cirrus OCT machine. The algorithm was validated with a leave-one-out method on ten subjects, and performs well with a TP rate of 95%. The impressive accuracy of the TP rate is partially due to the removal of all pseudocysts less than 14 pixels in size. We evaluated the performance on an additional set of ten MME and ten HC subjects. The results illustrate a significant difference in the number of pseudocysts in the two cohorts, which suggests that the algorithm can distinguish between MME and non-MME subjects. We also analyzed three subjects longitudinally, see Fig. 5. The RRMS and NMO subjects exhibit increasing and decreasing trends at different frequencies, while ignoring the baseline of the PPMS subject would suggest a stable MME appearance throughout the time frame of that subject.
This work enables improved quantitative analyses of MME. The longitudinal nature and correlation with the disease process underlying the formation of MME can now be further explored on larger scale data sets. A future improvement could include incorporation of spatial distribution of pseudocysts between B-scans, as pseudocysts are present on adjacent scans.3 Planned future studies include analysis of longitudinal data to more closely understand MME patterns.
REFERENCES
- 1.Saidha S, Sotirchos ES, Ibrahim MA, Crainiceanu CM, Gelfand JM, Sepah YJ, Ratchford JN, Oh J, Seigo MA, Newsome SD, Balcer LJ, Frohman EM, Green AJ, Nguyen QD, Calabresi PA. Microcystic macular oedema, thickness of the inner nuclear layer of the retina, and disease characteristics in multiple sclerosis: a retrospective study. The Lancet Neurology. 2012;11(11):963–972. doi: 10.1016/S1474-4422(12)70213-2. [DOI] [PMC free article] [PubMed] [Google Scholar]
- 2.Gelfand JM, Nolan R, Schwartz DM, Graves J, Green AJ. Microcystic macular oedema in multiple sclerosis is associated with disease severity. Brain. 2012;135(6):1786–1793. doi: 10.1093/brain/aws098. [DOI] [PMC free article] [PubMed] [Google Scholar]
- 3.Burggraaff MC, Trieu J, A.de Vries-Knoppert W, Balk L, Petzold A. The clinical spectrum of microcystic macular edema. Invest. Ophthalmol. Vis. Sci. 2014;55(2):952–961. doi: 10.1167/iovs.13-12912. [DOI] [PubMed] [Google Scholar]
- 4.Gelfand JM, Cree BA, Nolan R, Arnow S, Green AJ. Microcystic inner nuclear layer abnormalities and neuromyelitis optica. JAMA Neurology. 2013;70(5):1629–1633. doi: 10.1001/jamaneurol.2013.1832. [DOI] [PubMed] [Google Scholar]
- 5.Sotirchos ES, Saidha S, Byraiah G, Mealy MA, Ibrahim MA, Sepah YJ, Newsome SD, Ratchford JN, Frohman EM, Balcer LJ, Crainiceanu CM, Nguyen QD, Levy M, Calabresi PA. In vivo identification of morphologic retinal abnormalities in neuromyelitis optica. Neurology. 2013;80(15):1406–1414. doi: 10.1212/WNL.0b013e31828c2f7a. [DOI] [PMC free article] [PubMed] [Google Scholar]
- 6.Swingle EK, Lang A, Carass A, Ying HS, Calabresi PA, Prince JL. Microcystic macular edema detection in retina OCT images. Proc. SPIE. 2014;9038:90380G. [Google Scholar]
- 7.Lang A, Carass A, Swingle EK, Al-Louzi O, Bhargava P, Saidha S, Ying HS, Calabresi PA, Prince JL. Automatic segmentation of microcystic macular edema in OCT. Biomed. Opt. Express. 2015;6(1):155–169. doi: 10.1364/BOE.6.000155. [DOI] [PMC free article] [PubMed] [Google Scholar]
- 8.Ishikawa H, Chen C-L, Wollstein G, Grimm JnL, Ling Y, Bilonick RA, Sigal IA, Kagemann L, Schuman JS. High dynamic range imaging concept-based signal enhancement method reduced the optical coherence tomography measurement variability. Invest. Ophthalmol. Vis. Sci. 2013;54(1):836–841. doi: 10.1167/iovs.12-10990. [DOI] [PMC free article] [PubMed] [Google Scholar]
- 9.Pulicken M, Gordon-Lipkin E, Balcer LJ, Frohman E, Cutter G, Calabresi PA. Optical coherence tomography and disease subtype in multiple sclerosis. Neurology. 2007;69(22):2085–2092. doi: 10.1212/01.wnl.0000294876.49861.dc. [DOI] [PubMed] [Google Scholar]
- 10.Lang A, Carass A, Hauser M, Sotirchos ES, Calabresi PA, Ying HS, Prince JL. Retinal layer segmentation of macular OCT images using boundary classification. Biomed. Opt. Express. 2013;4(7):1133–1152. doi: 10.1364/BOE.4.001133. [DOI] [PMC free article] [PubMed] [Google Scholar]


