Abstract
In this study, we examine race, sex, and self-reported arrest histories (excluding arrests for minor traffic violations) from the 1997 National Longitudinal Survey of Youth (NLSY; N = 7,335) for the period 1997 through 2008 covering cumulative arrest histories through ages 18 and 23. The analysis produces three key findings: (1) males have higher cumulative prevalence of arrest than females; and (2) there are important race differences in the probability of arrest for males but not for females. Assuming the missing cases are missing at random, about 30% of black males have experienced at least one arrest by age 18 (vs. about 22% for white males); by age 23 about 49% of black males have been arrested (vs. about 38% for white males). Earlier research using the NLSY showed that the risk of arrest by age 23 was 30%, with nonresponse bounds [25.3%, 41.4%]. This study indicates that the risk of arrest is not evenly distributed across the population. Future research should focus on the identification and management of collateral risks that often accompany arrest experiences.
Keywords: crime, arrest, criminal behavior, developmental outcomes
Surprisingly, not much is known about an important social indicator in America: the cumulative probability that someone will have an arrest record by a given age. Brame, Turner, Paternoster, and Bushway (2012) recently investigated the arrest experience of a national sample of American youth and found that 25–41% of those youth reported having been arrested or taken into custody for a nontraffic offense by age 23. This study was the first in a generation (Christensen, 1967; see also Blumstein, 2010) to examine progressive cumulative population arrest patterns and the first ever to do so using survey data based on a nationally representative youth sample.
There is substantial research showing that arrested youth are not only more likely to experience immediate negative consequences such as contact with the justice system, school failure and dropout and family difficulties, but these problems are likely to reverberate long down the life course in terms of additional arrests, job instability, lower wages, longer bouts with unemployment, more relationship troubles, and long-term health problems including premature death (Bernburg and Krohn, 2003; Caspi et al., 1998; Kirk and Sampson, 2013; Lattimore, Linster, and MacDonald, 1997; Laub and Valliant, 2000; Sampson and Laub, 1993; Teplin, McClelland, Abram, and Mileusnic, 2005). In spite of its importance, while we have estimates of the cumulative probability of incarceration (Bonczar, 2003; Pettit and Western, 2004), prior to Brame et al. (2012) we lack a similar estimate for a criminal justice sanction that is far more pervasive – arrest. Further, understanding the prevalence of arrest cannot be diminished by the claim that many arrests do not result in a criminal conviction since previous research has suggested that the negative consequences of arrest (at least with respect to employment) occur even when arrest does not lead to conviction (Pager, 2003; Schwartz and Skolnick, 1962).
While the Brame et al. (2012) estimate is informative, it is well documented that at any fixed age or within any age range, there are large differences in aggregate arrest rates by race and sex in the United States. For example, in 2010, the FBI reported that the arrest rate for men was 3 times higher than that of women, and the arrest rate for blacks was 2.2 times higher than that of whites (Federal Bureau of Investigation, 2011). Aggregate arrest statistics from the FBI like these, however, are not broken down by race and sex groups (i.e., black males, black females, etc.) (Snyder, 2011). Furthermore, aggregate arrest rates conflate two statistics – the prevalence of an arrest and the frequency of arrests for those who have at least one arrest (Blumstein, Cohen, Visher, and Roth, 1986; Blumstein and Cohen, 1987). So, an arrest rate that is 2.2 times higher for blacks relative to whites does not mean that blacks have a cumulative prevalence of arrest that is 2.2 times that of whites. While social scientists and policy makers are already well aware of the race and sex differentials in the FBI statistics (Snyder, 2011), little is known about race and sex variation in the cumulative prevalence of arrest. This study attempts to fill this gapby describing what can be learned about race and sex differences in the cumulative risk of arrest by ages 18 and 23 using a contemporary nationally representative sample.
Method
The analysis reported in this article is based on the cross-sectional 1997 National Longitudinal Survey of Youth (NLSY). All of the data used in this study are publicly available from the United States Bureau of Labor Statistics. The initial effort in conducting the cross-sectional NLSY involved the identification of a self-weighting representative sample of U.S. households with youths between the ages of 12 and 16 years old at the end of 1996. A total of 7,335 survey-eligible youths screened into the NLSY and the interviewing staff were successful in conducting a first-round interview with 6,748 of these youths in 1997 and were unsuccessful at conducting first-round interviews with the remaining 587 youths. At the time of the first interview in 1997, all surveyed youths were between the ages of 12 and 17 (Moore, Pedlow, Krishnamurty, and Wolter, 2000).
According to the NLSY data set, the 6,748 first round respondents include 921 Hispanics, 1,081 Non-Hispanic Blacks, 81 Non-Hispanic Mixed-races, and 4,665 Non-Hispanic, Nonblacks (consistent with Moore et al. 2000), we consider the last two groups to be non-Hispanic, non-black, or -- more simply -- white). Table 1 presents a summary of the race and sex distribution of the 7,335 survey-eligible NLSY youth and the subsample of 6,748 youth who actually participated in the first round of the NLSY. Based on survey questions about arrest experiences, we compiled historical information about arrest experiences through ages 18 and 23 for each person. An age 23 (276 months old) cutoff was used because the youngest NLSY participants were at least 23 years old by the time of the 2008 interview.
Table 1.
Race and Sex Distribution of NLSY Eligible Youth (N = 7335)
| Sex | Hispanic | Non-Hispanic Black | Non-Hispanic, Non-Black | Total | ||||
|---|---|---|---|---|---|---|---|---|
| P | NP | P | NP | P | NP | P | NP | |
| Male | 469 | 59 | 537 | 58 | 2453 | 206 | 3459 | 323 |
| Female | 452 | 46 | 544 | 36 | 2293 | 182 | 3289 | 264 |
| Total | 921 | 105 | 1081 | 94 | 4746 | 388 | 6748 | 587 |
Note: P = first round NLSY participants; NP = first round NLSY nonparticipants
In addition to examining the arrest information for the NLSY participants, we pay considerable attention to: (1) the uncertainty created by the 587 youth who were targeted for NLSY participation but did not actually participate; and (2) the persons who participated in the first round of the NLSY but provided insufficient information for us to discern whether they had been arrested by age 23. Researchers commonly assume that the missing cases are missing at random (MAR) (Brame et al., 2012; Little and Rubin, 1987; Manski, 1995, 2003). For purposes of this article, the MAR assumption asserts that individuals with missing information in a particular race and sex cell have the same arrest rate as the individuals who provided information on their arrest experiences. While convenient for statistical analysis, this is a strong and untestable assumption (Manski, 2003).
An alternative to MAR is based on what we refer to as the minimal assumptions (MA) estimator. The minimal assumptions involved are those that would be invoked in any large scale survey: (1) that survey respondents accurately report their experiences; (2) that missing survey respondents would have accurately reported their experiences if they had been interviewed; and (3) that the entire sample (observed and unobserved cases) is a nationally representative sample. It produces two estimates: (1) a lower bound assuming that none of the missing persons had been arrested; and (2) an upper bound assuming that all of the missing persons had been arrested (Manski, 2003).
The MAR and MA analyses could be viewed as two extremes; one treats the missing data problem as trivial and the other considers the maximum uncertainty. It is also useful to consider a series of middle-ground (MG) analyses which take seriously the ambiguities created by the missing cases but also highlight some reasonable possibilities for inference with assumptions that are stronger than MA but weaker than MAR (Manski, 2003). We view our MG estimators as the most credible estimates of arrest prevalence patterns in the NLSY.
The key parameter in the MG estimators is the conditional prevalence of arrest for the missing cases divided by the conditional prevalence of arrest for the observed cases, or the relative risk (RR). The RR cannot be estimated since the numerator -- the conditional prevalence of arrest for the missing cases -- is unknown. We do know that the numerator lies between 0 and 1, so we can form bounds on the RR parameter for the sample as a whole and for any identifiable subsample of the NLSY. When RR is 1, the two conditional prevalence estimates match and the data are MAR (no correlation between a person being missing and arrested). When RR < 1, the missing cases have a lower likelihood of arrest than the observed cases (a negative correlation between a person being missing and arrested). Symmetrically, when RR > 1, the missing cases have a greater likelihood of arrest than the observed cases (a positive correlation between a person being missing and arrested). Viewed in this light, it becomes apparent that MAR is a special case of a wide range of possibilities. Within the statistical literature on missing data, both our MA and MG estimators fall within the set of models that allow for nonignorable nonresponse (Little and Rubin, 1987).
Although most of the uncertainty described in this article revolves around the missing cases, we also follow standard practice and account for sampling error with confidence intervals. The NLSY cross-sectional household sample is based on a self-weighting design which leads to valid point and interval estimates of cumulative arrest prevalence. Due to clustering, however, sampling error estimated under the assumption of simple random sampling will be too small. NLSY research staff have recommended adopting a standard error design effect multiplier (DEFT) of 1.22 to calibrate sampling uncertainty in the self-reported arrest measures due to clustering. The confidence intervals estimated in this article are based on DEFT-adjusted Bonferroni-asymptotic joint 95% confidence regions and implemented with the bootstrap (Manski, 2003). Statisical analyses were conducted with the R/S+ programming language (Chambers, 1998).
Results
The NLSY data allow us to measure the accumulation of arrest experiences as people age from 8 to 23 (Brame et al., 2012). Table 2 presents the frequency distribution upon which all of the analyses reported in this article are based. There are two numbers in most of the cells of this table; the first counts the persons in the group at age 18 and the second counts the persons in the group at age 23. Since our analysis focuses on cumulative arrest experience, the number of persons in the “never arrested” group declines over time while the number in the “ever arrested” and “missing” groups increase over time. The number of persons who did not participate at the first round is a constant throughout the 11 rounds of the NLSY.
Table 2.
Age 18 Distribution of Race, Sex, and Arrest Experience
| Race | Sex | Observed Cases | Missing Cases | |||
|---|---|---|---|---|---|---|
| Not Arrested | Arrested | NP II | % Missing | |||
| Hispanic | Males | 334 | 119 | 59 | 16 | 14.2 |
| NH-Black | 368 | 155 | 58 | 14 | 12.1 | |
| NH-Non-Black | 1858 | 510 | 206 | 85 | 10.9 | |
| Hispanic | Females | 387 | 52 | 46 | 13 | 11.8 |
| NH-Black | 472 | 63 | 36 | 9 | 7.8 | |
| NH-Non-Black | 1950 | 265 | 182 | 78 | 10.5 | |
| All | Both | 5369 | 1164 | 587 | 215 | 11.2 |
Note: NP = first-round NLSY nonparticipants; persons in the “NP” column (never participated) were missing throughout the study. II = people who participated but provided insufficient information to measure arrest experiences.
Basic Analysis
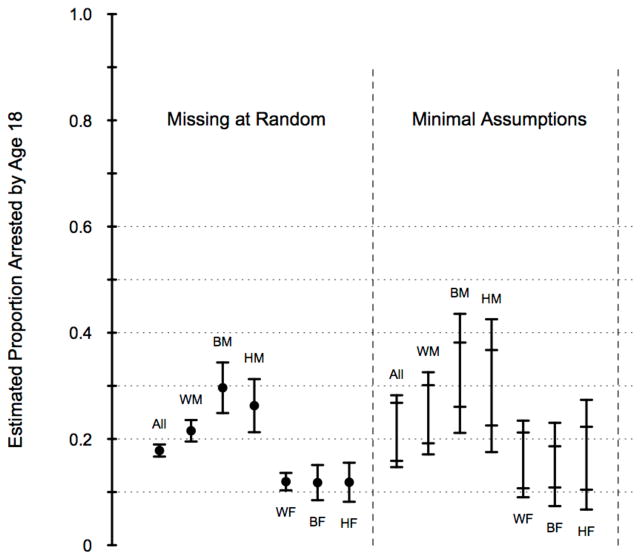
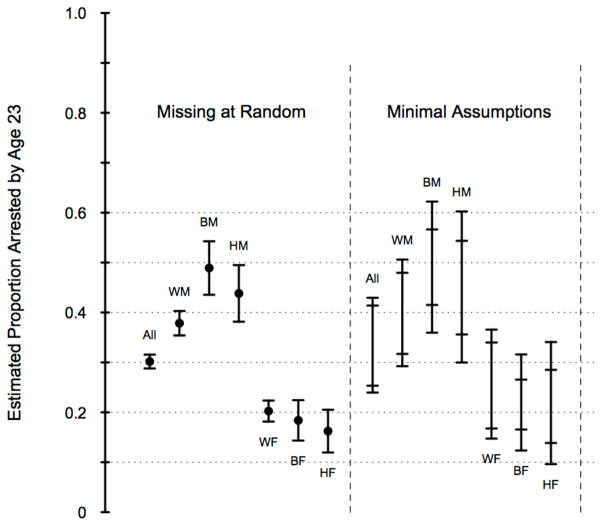
Figure 1 summarizes our findings for the age-18 analysis (panel A) and the age-23 analysis (panel B). The far-left-hand panels in Figure 1 display the cumulative arrest prevalence rates assuming the missing cases are MAR; the fences at the end of the intervals represent the 95% confidence limits. Based on the age-18 MAR analysis, it appears that non-Hispanic, black males have the highest risk of arrest by age 18 (29.6%) followed by Hispanic males (26.2%) and non-Hispanic, non-Black (white) males (21.5%). The MAR estimates for the females are much more tightly clustered (all three race groups between 11.8% and 12.0%). Although the MAR arrest rates are higher at age 23 (panel B), the between-group patterns are the same (for example, the black males have an arrest rate of 48.9%, Hispanic males, 43.8%, and white males, 37.9%). The MAR confidence intervals tell us that the males as a whole are significantly different from the females as a whole and that the black males have a significantly higher arrest rate than the white males. Neither the white nor the black males differ significantly from the Hispanic males.
Figure 1.
Ever Arrested Status by Demographic Group
Panel A: Age 18 Arrest Rates
Panel B: Age 23 Arrest Rates
The right-hand sides of Figure 1 describe the uncertainty created by the missing cases using the MA estimator. The inner fences represent the in-sample uncertainty and the outer fences reveal the 95% confidence limits of our interval estimates for the prevalence of arrest. The bounds of these interval estimates are wide and reflect the inferential consequences of the missing observations in the NLSY. Of course, all large-scale nationally representative longitudinal surveys confront this sort of uncertainty (Manski, 1995, 2003; Pepper, 2001). Our analysis has the virtue of formally transmitting this uncertainty to readers so the ambiguity created by the missing data is well understood. Since all of the intervals for all of the groups overlap with each other, it is not possible to draw definitive conclusions about group differences in arrest experiences without making some untestable assumptions.
Two clear conclusions can be drawn from Figure 1. First, there is no credible evidence that the Hispanic males differ significantly from either the white or the black males. Second, there are no discernible differences in female arrest rates among the different race groups. Even the MAR estimates for these two comparisons do not identify a clear difference. The analysis in Figure 1 is less clear on whether: (1) males are different from the females; and (2) white males are different from the black males.
Sex Comparisons
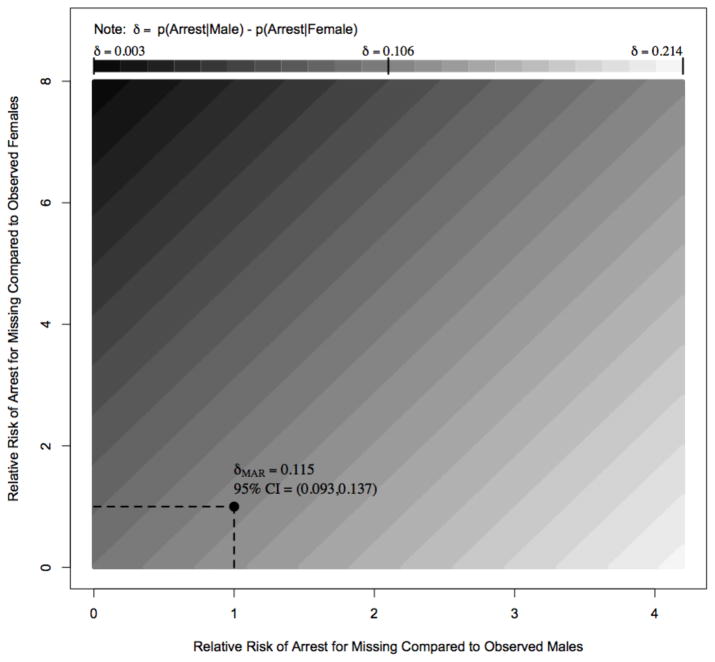
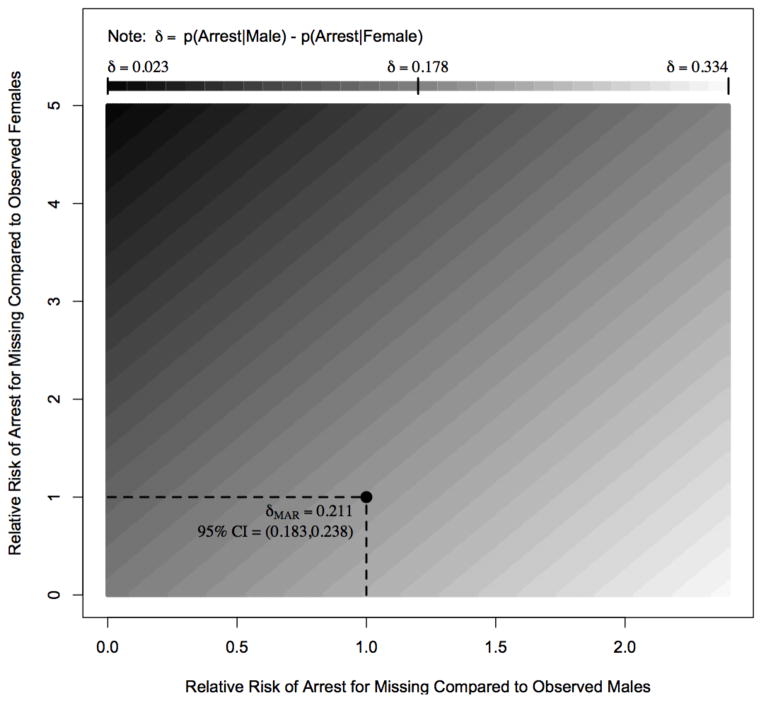
We turn first to the question of whether the males and females in the NLSY have different cumulative arrest prevalence rates. The MAR analysis suggests the answer is “yes” while the MA analysis is inconclusive. It turns out, however, that there is a strong basis in these data for concluding that males do have higher arrest rates than females at both ages 18 and 23. As a starting point, we define the parameter, δ, as the conditional prevalence of arrest for the males minus the conditional prevalence of arrest for the females. If δ > 0, males have a higher prevalence of arrest than the females; if δ < 0, the females have a higher arrest rate; and if δ = 0, the arrest rates for males and females are equal. Figure 2 reveals how δ varies depending on different missing data patterns that might exist in the NLSY data.
Figure 2.
Sensitivity Analysis for Difference Between Male and Female Arrest Rates
Panel A: Age-18 Arrest Rates
Panel B: Age-23 Arrest Rates
Panel A of Figure 2 displays the different values of δ that are possible in the age-18 male-female comparisons. The analysis reveals that males and females have approximately the same arrest rate (i.e., δ ≈ 0) only under a peculiar set of circumstances: (1) the arrest rate for the missing females is higher than for the observed females; and (2) the arrest rate for the missing males is lower than for the observed males. The horizontal and vertical axes show the approximate bounds on the RR parameter for the males and the females. Darker shades of grey in the plotspace are indicative of smaller δ estimates.
The MAR estimate of δ (0.115 with 95% confidence limits of [0.093,0.137]) is in the lower left hand corner of the plotspace indicating that the MAR arrest rate for the males exceeds the MAR arrest rate for the females. In other words, even if the MAR assumption is wrong, only an extreme difference in the missing data patterns for the two sexes could overcome the difference we see in the observed data. Based on this evidence, we conclude that that the males have higher arrest rates than the females at ages 18 and 23 in the NLSY sample. We also conclude that the relative difference between the MAR rates is essentially the same at both ages, with the male arrest rate ~2.0 times larger than the female arrest rate at age 18 and ~2.1 times larger at age 23. Apparently, the pattern of differential risk did not change over this time period and its origins almost certainly precede it.
Race Comparisons Among the Males
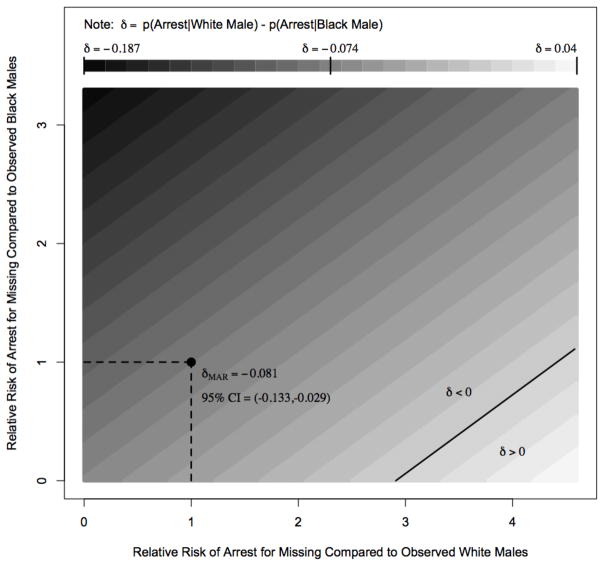
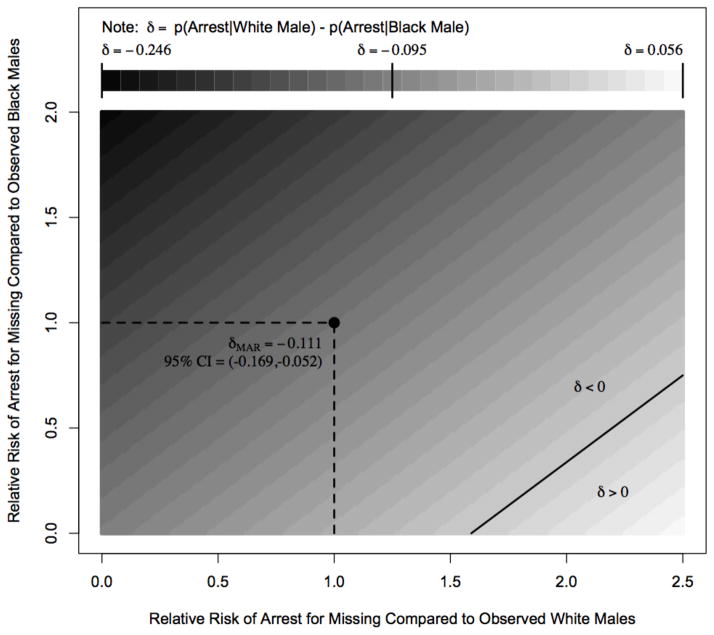
We now turn to the question of whether the black males and white males have different arrest rates. For this analysis, we define δ as the conditional prevalence of arrest for white males minus the conditional prevalence of arrest for black males. So, when δ > 0, the arrest rate for the white males exceeds the arrest rate for the black males; when δ < 0, the arrest rate for the black males exceeds the rate for the white males. The MAR estimates of δ are highlighted in the lower left hand quadrant of both panels of Figure 3. At age 18 (Panel A), the MAR estimate of δ is −0.081 (95% CI = [−0.133,−0.029]) while the age 23 (Panel B) MAR estimate is −0.111 (95% CI = [−0.169,−0.052]).
Figure 3.
Sensitivity Analysis for Difference Between White and Black Male Arrest Rates
Panel A: Age-18 Arrest Rates
Panel B: Age-23 Arrest Rates
Based on the MAR analysis, we would conclude that the arrest rate for the black males significantly exceeds the arrest rate for the white males. In fact, the white male rate can equal or exceed the black male rate only when the RR for both groups is in the area to the right of the dark diagonal line in the bottom right quadrants of Figure 3: a point where the correlation between a case being missing and arrested is strong and positive for the white males but negative for the black males. As with the aforementioned sex comparison, this would seem to be a highly unlikely scenario. We therefore are willing to make the relatively weak assumption that the RRs are either at or to the left of the diagonal line and conclude that the arrest rate for the black males exceeds the arrest rate for the white males. We also conclude that the ratio of MAR arrest rates for black males over white males is similar at both ages 18 (~1.4) and 23 (~1.3). Despite the escalation in cumulative prevalence over the period from ages 18 to 23, the ratio of the rates between groups is relatively constant. Whatever process accounts for this differential pattern probably originates in childhood or adolescence.
Discussion
Cumulative arrest prevalence rates are high (Brame et al., 2012) and there are good reasons for suspecting that these rates are not equally distributed throughout the population (Blumstein, 2010; Blumstein and Graddy, 1982; Christensen, 1967). There are also good reasons to be concerned about this given the fact that an arrest, even if it results in an acquittal, can have very damaging consequences for the subsequent life chances of youth. The measurement of cumulative arrest prevalence using official data, however, presents difficult challenges (Brame et al., 2012). The best option currently available is to rely on self-reported survey data. Using the NLSY, our analysis attempts to fill a gap in our understanding of contemporary American arrest patterns by ages 18 and 23.
A major earlier finding from Brame et al. (2012) was that contemporary cumulative ever-arrest experiences -- while not normative -- are certainly disturbingly prevalent among American youth. In this analysis, we find that males exhibit significantly higher cumulative arrest prevalence than females and that there seem to be important differences between black and white males. We are not able to discern clear differences between the Hispanic males and other race groups. Nor were we able to measure any clear race differences among the females.
Interestingly, the between-group differences in cumulative arrest prevalence observed in the NLSY are smaller than the measurable differences between groups in the aggregate FBI arrest rate statistics. For example, the 2010 FBI statistics suggest that blacks have an arrest rate that is on the order of 2.2 times higher than whites (Federal Bureau of Investigation, 2011). In terms of MAR estimates of cumulative arrest prevalence, however, we see that the black and white females are not different and that the ratio of black male prevalence to white male prevalence at age 23 is on the order of 48.9/37.9 ≈ 1.3 which is much smaller than the FBI difference. It follows that the distributions of cumulative prevalence estimates do not necessarily correspond to easily measured differences between race and sex groups in aggregate arrest rates. This is not surprising since many individuals who have been arrested at least once persist in criminal behavior at different rates (Blumstein et al., 1986; Blumstein and Cohen, 1987; Piquero, Farrington, and Blumstein, 2003). Taken as a whole, our findings inform social scientists and policy makers that many young people have had (and will have) the experience of being arrested and that there is real variation in that risk within the population.
A high priority for future research is to document the temporal sequencing of arrest and other adverse events during childhood, adolescence, and early adulthood. The NLSY data are particularly useful for this purpose since a good deal of relevant information is recorded on a near-annual basis in calendar format. It will be important to continue following the NLSY survey participants as they move further into adulthood to reach an improved understanding of the long-term health, legal, and social consequences that flow from formal contact with the criminal justice system. Our results also suggest that the relationship between demographic characteristics and arrest experiences are possibly quite complex and not yet well understood. For example, it would not be reasonable to speak about an overall “race correlation” because the correlation between race and arrest experiences is different for males than for females -- at least in the NLSY. Similarly, our study makes no claims about discrimination or racial profiling as there was no effort to control or adjust for the effects of other factors that might be correlated with both demographic characteristics and criminal involvement. Our focus is simply on documenting the basic demographic patterns of arrest as measured by the NLSY. We hope this work will serve as a point of departure for careful consideration of key measurement, theoretical, and policy issues surrounding arrest experiences for American youth.
Table 3.
Age 23 Distribution of Race, Sex, and Arrest Experience
| Race | Sex | Observed Cases | Missing Cases | |||
|---|---|---|---|---|---|---|
| Not Arrested | Arrested | NP | II | % Missing | ||
| Hispanic | Males | 241 | 188 | 59 | 40 | 18.8 |
| NH-Black | 258 | 247 | 58 | 32 | 15.1 | |
| NH-Non-Black | 1384 | 843 | 206 | 226 | 16.2 | |
| Hispanic | Females | 356 | 69 | 46 | 27 | 14.7 |
| NH-Black | 426 | 96 | 36 | 22 | 10.0 | |
| NH-Non-Black | 1634 | 415 | 182 | 244 | 17.2 | |
| All | Both | 4299 | 1858 | 587 | 591 | 16.1 |
Note: NP = first-round NLSY nonparticipants; persons in the “NP” column (never participated) were missing throughout the study. II = people who participated but provided insufficient information to measure arrest experiences.
Footnotes
Work on this project was completed when Dr. Brame was at the University of North Carolina at Charlotte.
Contributor Information
Robert Brame, University of South Carolina.
Shawn D. Bushway, University at Albany
Ray Paternoster, University of Maryland.
Michael G. Turner, University of North Carolina at Charlotte
References
- Bernburg JG, Krohn MD. Labeling, life chances, and adult crime: The direct and indirect effects of official intervention in adolescence on crime in early adulthood. Criminology. 2003;41:1287–1318. [Google Scholar]
- Blumstein A. Some perspectives on quantitative criminology pre-JQC and then some. Journal of Quantitative Criminology. 2010;26:549–561. [Google Scholar]
- Blumstein A, Cohen J, Roth J, Visher CA. Criminal Careers and “Career Criminals”. Washington, DC: National Academy Press; 1986. [Google Scholar]
- Blumstein A, Cohen J. Characterizing criminal careers. Science. 1987;237:985–991. doi: 10.1126/science.237.4818.985. [DOI] [PubMed] [Google Scholar]
- Blumstein A, Graddy E. Prevalence and recidivism in index arrests: A feedback model. Law and Society Review. 1982;16:265–290. [Google Scholar]
- Bonczar TP. Prevalence of Imprisonment in the U S Population, 1974–2001. Washington, D.C: U.S. Department of Justice; 2003. [Google Scholar]
- Brame R, Turner MG, Paternoster R, Bushway SD. Cumulative prevalence of arrest from ages 8 to 23 in a national sample. Pediatrics. 2012;129:21–27. doi: 10.1542/peds.2010-3710. [DOI] [PubMed] [Google Scholar]
- Caspi A, Wright BR, Moffitt TE, Silva PA. Early failure in the labor market: Childhood and adolescent predictors of unemployment in the transition to adulthood. American Sociological Review. 1998;63:424–451. [Google Scholar]
- Chambers JM. Programming with Data: A Guide to the S Language. New York: Springer-Verlag; 1998. [Google Scholar]
- Christensen R. Institute for Defense Analysis, editor. Task Force Report: Science and Technology. Washington, DC: U.S. Government Printing Office; 1967. Projected percentage of U.S. population with criminal arrest and conviction records; pp. 216–228. [Google Scholar]
- Federal Bureau of Investigation. Crime in the United States, 2010. Washington DC: United States Department of Justice; 2011. [Google Scholar]
- Kirk DS, Sampson RJ. Juvenile arrest and collateral educational damage in the transition to adulthood. Sociology of Education. 2013;86:36–62. doi: 10.1177/0038040712448862. [DOI] [PMC free article] [PubMed] [Google Scholar]
- Lattimore PK, Linster RL, MacDonald JM. Risk of death among serious young offenders. Journal of Research in Crime and Delinquency. 1997;34:187–209. [Google Scholar]
- Laub JH, Vaillant GE. Delinquency and mortality: A 50-year follow-up study of 1,000 delinquent and nondelinquent boys. American Journal of Psychiatry. 2000;157:96–102. doi: 10.1176/ajp.157.1.96. [DOI] [PubMed] [Google Scholar]
- Little RJA, Rubin DB. Statistical Analysis with Missing Data. New York: Wiley; 1987. [Google Scholar]
- Manski CF. Identification Problems in the Social Sciences. Cambridge MA: Harvard University Press; 1995. [Google Scholar]
- Manski CF. Partial Identification of Probability Distributions. New York: Springer-Verlag; 2003. [Google Scholar]
- Moore W, Pedlow S, Krishnamurty P, Wolter K. National Longitudinal Survey of Youth 1997 (NLSY97) Technical Sampling Report. Chicago IL: National Opinion Research Center; 2000. [Google Scholar]
- Pager D. The mark of a criminal record. American Journal of Sociology. 2003;108:937–975. [Google Scholar]
- Pepper JV. How do response problems affect survey measurement of trends in drug use? In: Manski CF, Pepper JV, Petrie CV, editors. Informing America’s Policy on Illegal Drugs: What We Don’t Know Keeps Hurting Us. Washington DC: National Academy Press; 2001. pp. 321–347. [Google Scholar]
- Pettit B, Western B. Mass imprisonment and the life course: Race and class inequality in U.S. incarceration. American Sociological Review. 2004;69:151–169. [Google Scholar]
- Piquero AR, Farrington DP, Blumstein A. The criminal career paradigm. Crime & Justice, A Review of Research. 2003;30:359–506. [Google Scholar]
- Sampson RJ, Laub JH. Crime in the Making: Pathways and Turning Points Through Life. Cambridge, MA: Harvard University Press; 1993. [Google Scholar]
- Schwartz R, Skolnick J. Two studies of legal stigma. Social Problems. 1962;10:133–142. [Google Scholar]
- Snyder HN. Arrest in the United States, 1980–2009. Washington DC: U.S. Department of Justice; 2011. (NCJ234319) [Google Scholar]
- Teplin LA, McClelland GM, Abram KM, Mileusnic D. Early violent death among delinquent youth: A prospective longitudinal study. Pediatrics. 2005;115:1586–1593. doi: 10.1542/peds.2004-1459. [DOI] [PMC free article] [PubMed] [Google Scholar]


