Abstract
Purpose:
The same projection data (or line integrals) are often measured multiple times, e.g., twice from opposite directions during one gantry rotation. The redundant data must be normalized by applying redundancy weighting such as the halfscan algorithm, which assumes that the noise of the data is uniform. This assumption, however, is not correct when a tube current modulation technique is employed. The variance of line integrals, which is inversely related to the tube current, could vary significantly. The purpose of this work is to improve how the projection data are used during analytical reconstruction when the tube current is modulated during the scan.
Methods:
The authors developed a new redundancy weighting scheme. It not only takes into account the data statistics but also can control how much to weigh the statistics from 100% (αs = 1.0) to 0% (αs = 0.0) by a parameter αs. The proposed weighting scheme reduces to the conventional redundancy weighting scheme when αs = 0.0. The authors evaluated the performance of the proposed scheme using computer simulations targeting at myocardial perfusion CT imaging. The image quality was evaluated in terms of the image noise and halfscan artifacts, and perfusion defect detection performance was evaluated by the positive predictive value (PPV) and the area-under-the-receiver operating characteristic-curve (AUC) value.
Results:
Results showed a tradeoff between the image noise and halfscan artifacts. The normalized noise standard deviation was 1.00 with halfscan, 0.89 with αs = 1.0, 0.97 with αs = 0.5, and 1.20 with αs = 0.0 when projections over one rotation (75% of projections are acquired with full dose, 25% with 1/10 of the full dose) are used. The halfscan artifacts were 13.4 Hounsfield unit (HU) with halfscan, 8.2 HU with αs = 1.0, 4.5 HU with αs = 0.5, and 3.1 HU with αs = 0.0. Both the PPVs and AUCs were improved from the halfscan method: PPV, 69.0%–70.6% vs 58.0%, P < 0.003; AUC, 0.935–0.938 vs 0.908, P < 0.003.
Conclusions:
The new redundancy weight allows for decreasing the image noise and controlling the tradeoff between the image noise and artifacts.
Keywords: computed tomography, image reconstruction, redundancy weighting, myocardial perfusion CT
1. INTRODUCTION
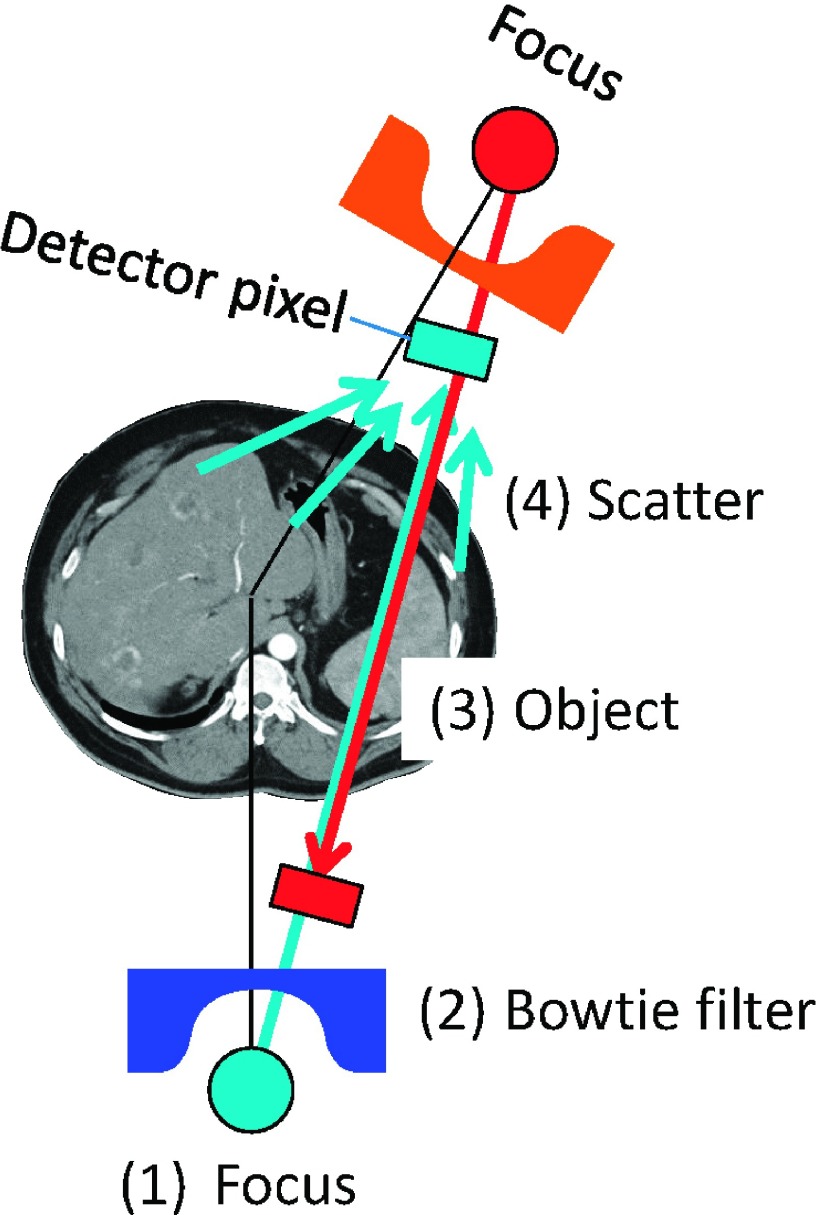
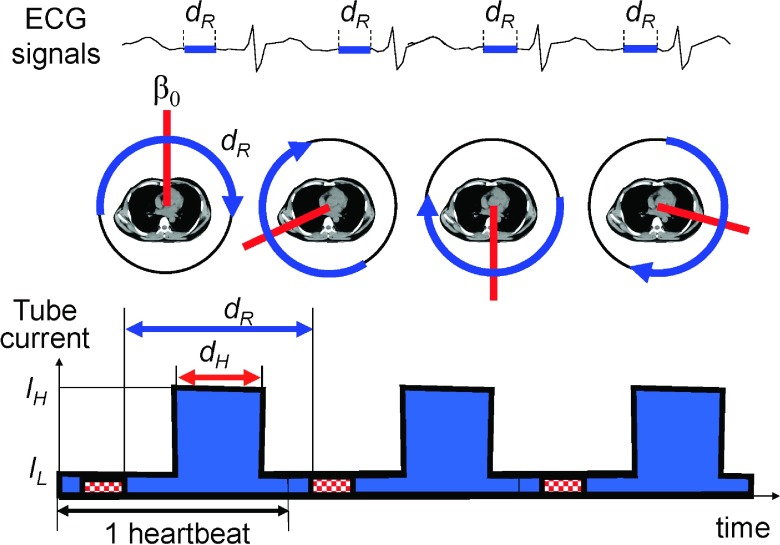
The same CT projection data (or line integrals) are often measured multiple times, e.g., twice from opposite directions during one gantry rotation (Fig. 1). The redundant projection data must be normalized by applying redundancy weighting when filtered backprojection (FBP) is performed to reconstruct an image,1 and all of the available redundancy weighting schemes assume that the noise of the data is uniform. This assumption, however, is not always correct. The variance of x-ray intensity data is proportional to the expected data, which is affected by the following factors: the intensity and energy of x-rays exiting the x-ray tube, the attenuation of x-rays with the bowtie filter and the object, and the scatter. With the current protocols, it is safe to make the following three assumptions: a constant tube voltage is used for the scan; the bowtie filter is symmetric with respect to fan- and cone-angles; and the scattered radiation is limited due to antiscatter grids. Therefore, the variance of the redundant x-ray data that go through the same ray-path (thus, which will be attenuated identically) is proportional to the tube current values used to acquire the projections. The tube current is often modulated for redundant projections to decrease radiation dose to the breasts (i.e., lower tube current values are used when the x-ray tube is on the breast side than the back side) or to decrease the dose outside of the middiastole phase for cardiac exams (Fig. 2).
FIG. 1.
Four factors that affect the noise variance of CT projections: (1) tube current and potential energy, (2) bowtie filters, (3) attenuation inside the object, and (4) scattered radiation.
FIG. 2.
The part of projection data, dR, that corresponds to the same cardiac phase will rotate from one heart beat to another if the time durations for one gantry rotation and one heart beat are different. Images are then reconstructed from the data acquired along the blue arcs at different central angles (β0, red lines). (Bottom) Tube current modulation for cardiac CT.
Many iterative image reconstruction methods take into account the noise of data, for example, by maximizing a likelihood function. However, only a few iterative methods consider the redundancy of projection data.2,3 Schmitt et al. found that taking redundancy weights into account with Landweber’s method changed the noise-bias (artifacts) tradeoff with fewer number of iterations. Zeng et al. showed that normalizing the data redundancy for cone-beam helical scanning prior to penalized maximum likelihood reconstruction provided a favorable tradeoff between artifacts and noise. In contrast, to our best knowledge, there is only one FBP-based method that takes into account the noise of data. Zeng and Zamyatin introduced a projection- and fan-angle-dependent ramp filtering kernel to weight data based on the noise variance.4,5 This method requires repeating the FBP process with different ramp filtering kernels. Thus, it is computationally very expensive, although Zeng recently proposed a method to use an image-domain filtering efficiently.6
In this paper, we propose a computationally efficient, new redundancy weighting scheme for FBP that takes into account the noise of data. It not only takes into account the data statistics but also can control how much to weigh from 100% (αs = 1.0) to 0% (αs = 0.0) by a single parameter, αs. The proposed weighting scheme reduces to the conventional redundancy weighting scheme when αs = 0.0.
We evaluated the new weighting scheme using myocardial CT perfusion (CTP) imaging. CTP imaging has shown promise in improving the positive predictive value (PPV) of cardiac CT examinations.7 We not only want to minimize the dose by modulating the tube current aggressively but also wish to decrease image noise and halfscan artifacts. The presence of halfscan artifacts is one of the major challenge with CTP, resulting in variations of the measured pixel values of the same pixel by as much as 30–50 Hounsfield unit (HU) from one heart beat to another and sometimes from lesion to lesion.8,9 This fluctuation of pixel values is called halfscan artifacts and when it is larger than the targeted ischemic contrast one wishes to detect (i.e., 10–30 HU), both the perfusion defect detection performance and the reproducibility of the CTP test are degraded. Thus, it is desirable to decrease the halfscan artifacts.
The halfscan artifacts are associated with the halfscan algorithm1,11 which is the generic cardiac CT image reconstruction method implemented in many clinical CT scanners. Let dR define the effective angular range of projection data used for image reconstruction (Fig. 2). The halfscan method uses a dR of 0.5 rotations and causes streaks in the images that rotate with the “central angle,” which is the projection angle that corresponds to the center of dR. A patient’s heart beat is an involuntary motion and it is impossible to mechanically control the gantry position for the central angle for each heartbeat and each scan. Thus, pixel values may vary from one image slice to another if several axial scans are performed to cover the entire heart, and also from one scan to another. Various factors make projections taken from opposite directions slightly different, including cone-angle, scattered radiation, beam-hardening effect, and cardiac motion. The cone-angle becomes a problem because the halfscan weight is designed to handle the redundancy of 2-D Radon data in fan-beam geometry but is applied to 3-D Radon data in cone-beam geometry prior to filtered backprojection.12 The beam-hardening correction scheme often ignores the cone-angle and uses a fan-beam geometry with in-plane ray-paths, while data are acquired in a cone-beam geometry with oblique (through-plane) ray-paths. Due to the mismatch, a part of the beam-hardening effect will remain uncorrected, which will produce a difference in projections from opposite directions. The inconsistency will increase and become noticeable when the cone-angle becomes large.
Cardiac CTP imaging can be improved using a larger dR, with either a motion compensated image reconstruction technique or a faster gantry rotation, and a tube current modulation technique. The motion compensated reconstruction or a faster gantry rotation will minimize the motion artifacts; the tube current modulation will allow for a larger dR while limiting the radiation dose to the patient. The tube current is set higher at IH for the cardiac phase-of-interest for a duration of dH and lower at IL for the other phases. This makes the statistical variation of projection data for the same ray-of-interest to vary strongly: the signal-to-noise ratio of data is larger during IH and smaller during IL. In this work, we evaluate the performance of the proposed scheme using computer simulations targeting at myocardial perfusion CT imaging.
While the proposed approach aims at decreasing the halfscan artifacts by using a larger dR, it would be desirable to address one or more causes of halfscan artifacts. Noo,13 Nett et al.,14 and Pack et al.15 proposed new filtered backprojection-type algorithms which take into account a redundancy of 3-D Radon data in cone-beam geometry. Hsieh et al. approximated a cone-beam geometry with a tilted parallel-beam geometry in his beam-hardening correction method in order to take into account the effect of cone-angles.16 Stenner et al. proposed to split an image into high and low spatial frequency components and reconstruct them separately with different dR.17 They aimed at decreasing the halfscan artifacts by reconstructing low frequency components with a larger dR, while reconstructing edges of anatomy with a smaller dR. The images, however, may present pseudo-hyperperfused lesions in the endocardium,18 which may make transmural perfusion analyses inaccurate. Further improvements with some of the approaches are desirable; nonetheless, adaption of these methods would decrease the halfscan artifacts.
This paper is organized as follows. In Sec. 2, we propose the new redundancy weighting. We evaluate the proposed method in Sec. 3, and discuss relevant issues and conclude the paper in Sec. 4.
2. THEORY
2.A. The current redundancy weight
Let g(β, γ, α) be cone-beam projections of an object f measured along a continuous circular orbit with a radius of R, where (β,γ,α) denote projection-, fan-, and cone-angle, respectively. The image can be reconstructed using a weighted filtered backprojection over the range where the redundancy weight w is nonzero
| (1) |
where hramp is a 1-D ramp filter kernel, “*” is the convolution operation, L is the distance from the focus to the reconstruction point projected onto an xy-plane, and w is a weighting function that normalizes the redundancy of the data g.
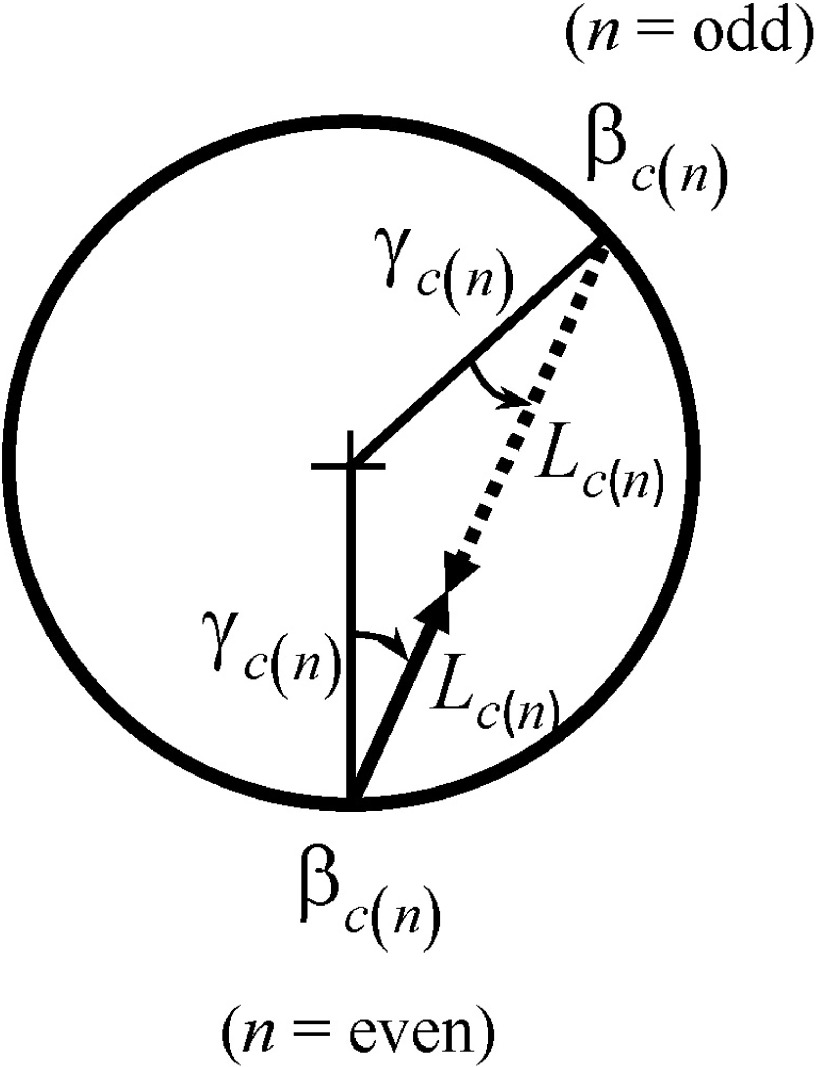
When the 2-D redundancy is considered (Fig. 3),
| (2) |
| (3) |
| (4) |
The function a below reflects the number of times projections were acquired along this ray-path. A 1-D function is used to define the effective range of nonzero values and enforce the smoothness along β and γ,
| (5) |
| (6) |
 |
(7) |
| (8) |
where βR is the full-width-at-half-maximum (measured in radians) of the projection angular range dR (measured in rotations) used for image reconstruction, β0 is the central projection angle of the range (see Fig. 2), hs is a 1-D smoothing kernel, and 2βf1 is the width of the kernel, which must be larger than the full fan-angle. A smooth redundancy weighting function can finally be obtained by
| (9) |
and is used in the place of w in Eq. (1) for the current method.
FIG. 3.
Parameters for redundant rays.
2.B. The proposed redundancy weight
We will first propose a new redundancy weighting scheme which takes into account the data statistics, then combine it with the current scheme to control how much to weigh the statistics.
When multiple line integrals are acquired at different tube current values at I(β1), I(β2), …, the ratios of variance of the acquired line integrals can be approximated by the inverse of the tube current values, , due to the logarithm process to convert x-ray intensities into line integrals. An image can be decomposed into multiple images, each of which is partially reconstructed only from a ray-of-interest. Let us consider the noise of such a partial image. When the image reconstruction is performed using Eq. (1), the image variance at the midpoint of a given ray-of-interest is minimized when each line integral value along the ray-of-interest is weighted by the inverse of the variance, . However, such weights may produce image artifacts because, if I(β) changes significantly between two projections, they would result in abrupt changes in w along γ, which would then be amplified by the ramp filtering process. Thus, a 1-D smooth function is used to enforce the smoothness and
| (10) |
| (11) |
where dH is the duration in gantry rotations that corresponds to higher tube current value IH (see Fig. 2) and 2βf2 is the width of the smoothing kernel.
Using two functions a and b, we get a redundancy weight w2 that takes into account statistics, guarantees the smoothness, and limits the effective range of nonzero values to βR,
| (12) |
Finally, the proposed weights are obtained by a weighted summation of two weights w1 and w2,
| (13) |
and used in the place of w in Eq. (1). The parameter αs controls how much to take into account the data statistics from 100% (αs = 1.0) to 0% (αs = 0.0).
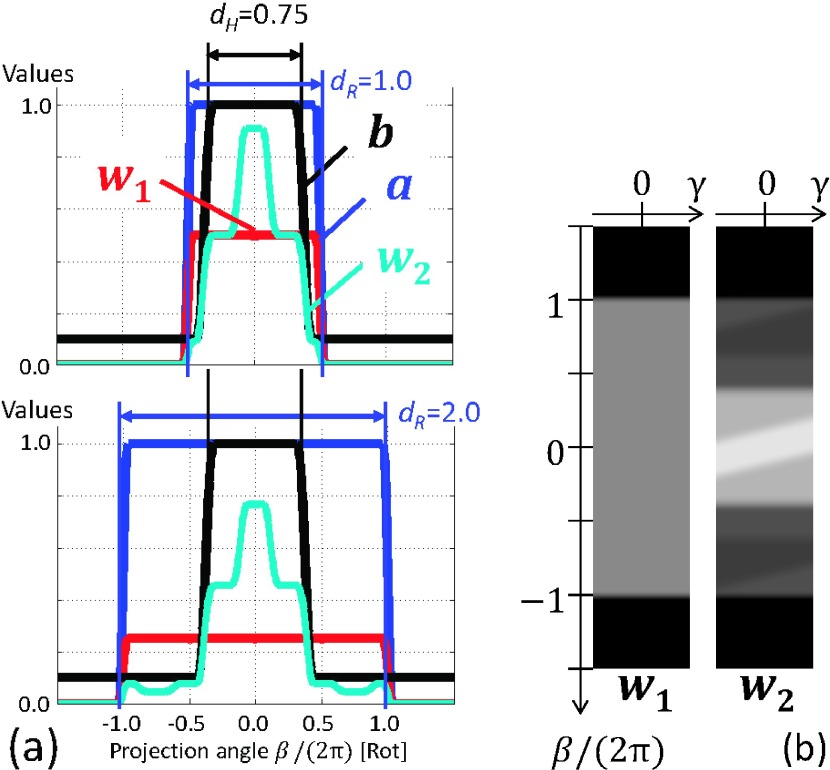
Figure 4(a) shows plots of a, b, and w1 and w2 for γ= 0 with dR = 1.00 rot and dR = 2.00 rot when IL/IH = 0.1, dH = 0.75 rot, βf1 = 28.6°, and βf2 = 50.0°. It can be seen in Fig. 4(a) that w1 (or wnew with αs = 0.0) was constant at 0.50 for dR = 1.00 rot, as most rays were measured twice over 1 rotation. In contrast, w2 (or wnew with αs = 1.0) was larger when b was larger when tube current IH was larger, providing a better data statistics. The difference between w1 and w2 becomes larger with dR = 2.00 rot [Fig. 4(b)], as the value of the constant area of w1 decreases to 0.25. Figures 4(a) and 4(b) show that w1 was similar to the overscan weight,11 while the middle part of w2 [−0.5 < β/(2π) < 0.5] looks similar to the halfscan weight.
FIG. 4.
(a) Profiles of the functions a and b and weights w1 and w2 for γ = 0 with two different dR (top, dR = 1.0 rot; bottom, dR = 2.0 rot) when IL/IH = 0.1 and dH = 0.75 rot. (b) Gray scale displays of w1 and w2 when IL/IH = 0.1, dH = 0.75 rot, and dR = 2.0 rot. Window width and level are 0.8 and 0.4, respectively.
3. EVALUATION
3.A. Evaluation methods
3.A.1. Noise and halfscan artifacts analyses
The noise at the origin was estimated assuming that a cylinder or sphere was placed with its center at the rotation axis and was scanned without changing the x-ray energy. The image noise standard deviation was calculated as , where C is a constant, for various scan and reconstruction parameters such as IL/IH, dH, dR, and αs. The σ was then normalized by that of the current halfscan method (dR = 0.5 rot and αs = 0.0).
As discussed in Sec. 1, the halfscan artifacts are caused by the inconsistency between projections acquired along one direction and projections taken from the opposite direction. The artifacts may be present when projections in the opposite directions are not weighted equally. Thus, we empirically estimated a risk factor for halfscan artifacts (HSA) by calculating the absolute difference of a sum of redundancy weights in one direction and a sum of redundancy weights in the opposite direction and integrating the absolute difference over half a rotation:
 |
The HSA was then normalized by that of the current halfscan method.
3.A.2. Synthesized patient data
3.A.2.a. Scan and reconstruction.
A synthesized patient image with a static heart with a perfusion defect of 24.4 ± 5.8 HU (range, 7.8–34.3 HU) [Fig. 5(a)] was scanned with a tube current modulation using the following parameters: IH = 875 mA, IL/IH = 0.1, dH = 0.75 rot, 0.3 s/rot, and 1000 projections/rot. The scanner had 626 detector channels over 28.7° and 335 × 0.48 mm detector rows, and monochromatic x-ray at 100 keV was used. The scan started from 12 different angles, each 30° apart, and five noise realizations were performed for each angle, resulting in 60 scans in total. The tube current values changed immediately from IL to IH and from IH to IL. This unrealistic setting was chosen to introduce a large mismatch between the actual noise variance and the function b which has to be smooth in order to avoid introducing discontinuities in w. Noisy projections were generated as follows. The x-ray focus emits 2.2 × 10⁶ photons mA−1 mm−2 at 1 m distance from the focal spot. Image pixel values of the object were converted to linear attenuation coefficients assuming they consisted of water. A detector pixel was divided into 2 × 2 subpixels, and the attenuated photon counts were calculated for each sub-pixel, to which Poisson noise was added. A 2-D Gaussian filter with a sigma of 0.9 subpixels and a kernel size of 15 × 15 subpixels was applied to the subpixel data in order to simulate the effect of data correction and cross-talks among pixels in CT scanners. The outputs of 2 × 2 subpixels were added to form one detector pixel, which was then converted to noisy line integrals of linear attenuation coefficients.
FIG. 5.

(a) The true image with perfusion defect of 24.4 ± 5.8 HU (range, 7.8–34.3 HU) (yellow arrow). Yellow circular ROIs on the myocardium and red circular ROIs on the left ventricular blood chamber were used for the measurements. [(b) and (c)] Images reconstructed by the halfscan method (dR = 0.5 rot) when the central angles are 0° (b) and 180° (c), respectively. Due to halfscan artifacts, the mean value of the myocardium was biased to 69.3 HU (b) and 100.8 HU (c), while the true value was 80.2 HU (a). The window width and level are 200 and 100 HU, respectively.
Note that among the four causes of halfscan artifacts discussed in Sec. 1—cone-angle, scattered radiation, beam-hardening effect, and cardiac motion—only cone-angle was involved in this study. The artifacts could be more severe if the other three causes were also present.
3.A.2.b. Halfscan artifacts and noise.
Images at z = 22.0 mm (which corresponds to a cone-angle of ∼2.1°) were reconstructed using the following parameter sets: dR of 0.50, 0.75, 1.00, 1.25, 1.50, 1.75, and 2.00 rot; and αs of 0.0, 0.5, and 1.0 for each of dR. Twenty-eight circular regions-of-interest (ROIs) with a diameter of 3.2 mm (8 pixels) were placed covering the entire myocardium in that slice (i.e., the lateral wall, the apex, and the interventricular septum) [Fig. 5(a)]. The standard deviation of the mean values of the same ROI over the starting angles was measured, and the average of the standard deviation values over 28 ROIs was used to quantify the strength of the halfscan artifacts. Image noise was quantified by the standard deviation of pixel values within ROIs averaged over all five noise realizations and 28 locations.
3.A.2.c. Perfusion defect detection.
Images at z = 22.0 mm were reconstructed using the following four parameter sets: (1) dR = 0.5 rot, αs = 0.0 (halfscan); (2) dR = 1.0 rot, αs = 0.0; (3) dR = 1.0 rot, αs = 0.5; and (4) dR = 1.0 rot, αs = 1.0. Perfusion ratios were quantified using the myocardial signal density ratio as follows.19,20 The same 28 ROIs placed covering the entire myocardium used above [see Fig. 5(a)] were used. A ROI was set to contain a perfusion defect (i.e., a condition positive) if the ROI was located inside the perfusion defect lesion, and a condition negative if outside. For each noise realization, the mean value of each ROI was divided by the mean value of four ROIs placed in the left ventricular blood pool [Fig. 5(a)]. This quantity is called the myocardial signal density ratio of the ROI. The myocardial signal density ratio showed an excellent agreement with microsphere-derived myocardial blood flow,12,13 which is considered the gold standard of quantitative myocardial perfusion.
Perfusion defect detection tests were performed by sweeping the threshold values as follows: When the myocardial signal density ratio of a ROI was lower than a given threshold, then the ROI was considered to contain a perfusion defect (i.e., a test outcome positive); on the other hand, when the signal density ratio was higher than the threshold value, the ROI was considered not to contain a perfusion defect (i.e., a test outcome negative). Comparing the test outcome with the true condition, the test result was categorized as a true positive (TP), a false positive (FP), a true negative (TN), or a false negative (FN) [Fig. 6(a)]. For a given threshold, the PPV is the number of true positives divided by the number of positive calls, and the negative predictive value (NPV) is the number of true negatives divided by the number of negative calls. The true positive rate is the number of true positives divided by the number of condition positives; the false positive rate is the number of false positives divided by the number of condition negatives. A receiver operating characteristic (ROC)-curve was obtained by sweeping the threshold values, repeating the test, and plotting true positive rates against false positive rates [Fig. 6(b)].
FIG. 6.
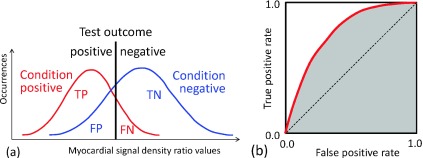
The concept of a binary classification test. (a) The test outcomes are positive when myocardial signal density ratios are lower than a given threshold (black line); the test outcomes are negative when higher. Comparing the test outcomes with actual conditions, there are four possible results from a binary classifier: a true positive (TP), a false positive (FP), a true negative (TN), and a false negative (FN). (b) The test is repeated by sweeping the threshold value from low to high and calculating the true positive rate and the false positive rate for each threshold value. The ROC-curve is obtained by plotting true positive rates against false positive rates. The AUC value was the shaded area.
The following two indices were calculated for each scan and reconstruction method: (1) the PPV at a NPV of 95%; and (2) the area-under-the-ROC-curve (AUC) value. A two-tail paired student’s t-test was performed and results were considered statistically significant if the P values were less than 0.05.
3.B. Evaluation results
3.B.1. Noise and halfscan artifacts analyses
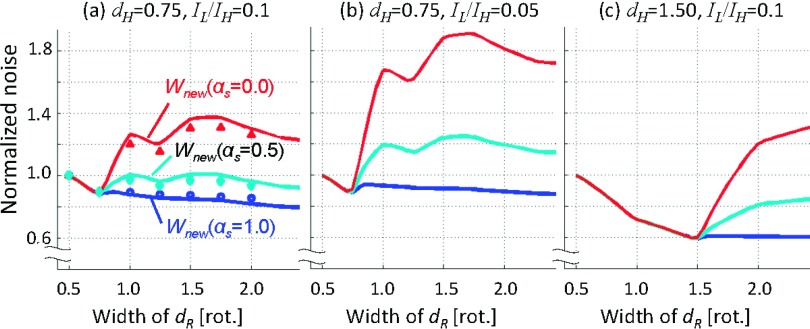
Figure 7 presents the plots of the normalized noise with αs = 0.0, 0.5, and 1.0 against dR at (a) IL/IH = 0.1 and dH = 0.75 rot; (b) IL/IH = 0.05 and dH = 0.75 rot; and (c) IL/IH = 0.1 and dH = 1.50 rot. It shows that while dR < dH, the image noise decreases with increasing the projection angular range, dR, as more photons are used in image reconstruction. However, when dR > dH and αs = 0.0, the image noise increases with increasing dR. In contrast, when statistics were 100% taken into account with αs = 1.0, the noise monotonically decreased with increasing dR in general and the least image noise was achieved. The image noise with αs = 0.5 was closer to the noise with αs = 1.0 than with αs = 0.0. We believe that the bumps at dR = 0.75 and 1.50 were due to the discrepancy between the actual variance of the data and the weights due to the smoothing enforced by hs in Eqs. (5) and (10). These trends remained the same with different dH and IL/IH.
FIG. 7.
The results of the image noise analyses with αs = 0.0, 0.5, and 1.0 at (a) IL/IH = 0.1 and dH = 0.75 rot, (b) IL/IH = 0.05 and dH = 0.75 rot, and (c) IL/IH = 0.1 and dH = 1.50 rot. The image noise was normalized by that of the halfscan image. The data points (markers) in (a) were the measured image noise in the synthesized patients: for dR = 1.0, they were 1.20 with αs = 0.0; 0.97 with αs = 0.5; and 0.89 with αs = 1.0.
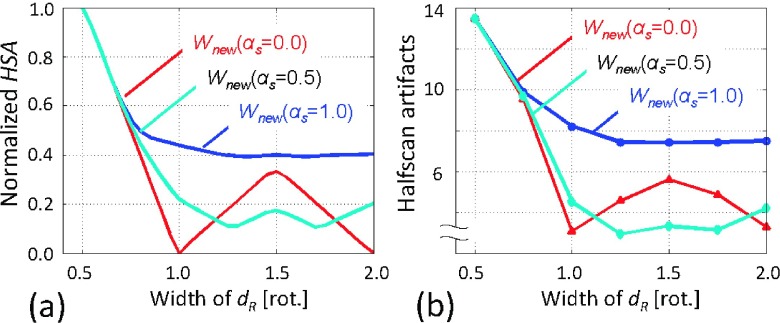
Figure 8(a) presents the plots of the normalized HSA values with αs = 0.0, 0.5, and 1.0 against dR at IL/IH = 0.1 and dH = 0.75 rot. It shows that while dR < 1.0, the HSA decreases with increasing the projection angular range, dR, as the relative contribution from the opposite projections to image reconstruction increases. However, when 1.0 < dR < 1.5 rot and αs = 0.0, the HSA increases with increasing dR, because by having odd (three) projections at dR = 1.5 rot (e.g., two with n = even and one with n = odd in Fig. 3), the redundancy weighting scheme will provide asymmetric weights in the ratio of 2:1. The αs = 1.0 provided the larger HSA values than αs = 0.0 and αs = 0.5, because as it can be seen in Fig. 4, the redundancy weights with αs = 1.0 remained similar to halfscan weights when IL/IH = 0.1 and dH = 0.75 rot. The αs = 0.5 provided the least HSA values near dR = 1.5, as a weighted sum of the two asymmetric weights with αs = 0.0 and αs = 1.0 resulted in the most balanced contributions from two opposite directions.
FIG. 8.
Analyses and measurements of halfscan artifacts. (a) Normalized HSA, the risk factor for halfscan artifacts, was the largest at dR = 0.5 rot. Regardless of the value of αs, the use of larger dR decreased the artifacts substantially. The conventional weighting scheme (αs = 0.0) had a local maxima at dR = 1.5 rot, while αs = 0.5 provided the least HSA values. (b) Halfscan artifacts measured in the synthesized patient study qualitatively agreed with the calculated normalized HSA values (a). Very large halfscan artifacts were observed with the halfscan algorithm (13.4 HU at dR = 0.5 rot), which had a significantly negative effect on detecting a moderate perfusion defect (24.4 ± 5.8 HU).
3.B.2. Synthesized patient data
Representative reconstructed images are presented in Fig. 9. It can be seen that the pixel values were different between the two images reconstructed by the halfscan method with two different central projection angles [Figs. 9(a) and 9(e)]; this is a typical halfscan artifact. The difference in pixel values was decreased significantly with dR = 1.0 regardless of the value of αs. The image noise with αs = 0.0 and dR = 1.0 [Figs. 9(b) and 9(f)] was larger than that of halfscan, while the noise was decreased with increasing αs.
FIG. 9.
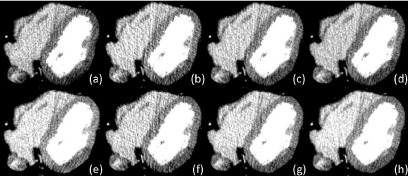
Images reconstructed from projections with the central angle at 0° [(a)–(d)] or 180° [(e)–(h)]. The other parameters were [(a) and (e)] dR = 0.5 rot, αs = 0.0 (halfscan), [(b) and (f)] dR = 1.0 rot, αs = 0.0, [(c) and (g)] dR = 1.0 rot, αs = 0.5, and [(d) and (h)] dR = 1.0 rot, αs = 1.0. Window width and level are 200 and 100 HU, respectively.
The measured halfscan artifacts, presented in Fig. 8(b), qualitatively agreed with HSA, the calculated normalized risk factor, presented in Fig. 8(a). The measured halfscan artifacts were as large as 13.4 HU with the halfscan algorithm (dR = 0.5 rot). Regardless of the value of αs, the use of a larger dR decreased the artifacts substantially. When dR = 1.0 rot, the conventional weighting scheme (αs = 0.0) provided halfscan artifacts of 3.1 HU or 23% of the halfscan method, and αs = 1.0 resulted in 8.2 HU. With αs = 0.5, the halfscan artifacts were close to or better than that of αs = 0.0 (4.5 HU or 33% of the halfscan method when dR = 1.0 rot; 2.9 HU or 22% when dR = 1.25 rot).
The measured image noise in the myocardium [shown as markers in Fig. 7(a)] agreed qualitatively with the expected value predicted by the model.
The results of the perfusion defect detection test are summarized in Table I. The perfusion detection performance was better with dR = 1.0 rot than with halfscan (dR = 0.5 rot) in terms of the AUC values (0.935–0.938 versus 0.908, P < 0.003) and the PPV at a NPV of 95% (69.0%–70.6% versus 58.0%, P < 0.003). Thus, it is critical to increase the projection angular range dR in order to improve the detection performance and PPV for cardiac perfusion defects. Among the three methods, αs = 0.5 provided the best performance index values, although the difference was not statistically significant (P = 0.06–0.07 with AUC values).
TABLE I.
Results of perfusion defect detection test. Note: (*) P < 0.003, (†) P = 0.07, and (‡) P = 0.06.

|
4. DISCUSSION AND CONCLUSIONS
We have developed a new redundancy weighting scheme which not only takes into account the data statistics but also can easily control how much to weigh by parameter αs. The results of the study showed that the proposed method allows for decreasing the image noise or halfscan artifacts or both, when applied to CT perfusion imaging with tube current modulation. The halfscan artifacts with αs = 0.5 can be better than those with αs = 0.0 and αs = 1.0. In future work, one may change the parameter αs adaptively as a function of the projection angle β in order to obtain more desirable improvements in the image noise and halfscan artifacts. For example, it may work better if αs is kept smaller (thus favoring equal weights) for projections up to one gantry rotation [|β|/(2π) < 0.5] and made larger (thus favoring statistics) for the others [|β|/(2π) > 0.5]. Balancing the two factors will also be important for other applications such as the tube current modulation to decrease the dose to the breasts.
The proposed method is very easy to implement and computationally efficient to perform; however, it does not take into account the different noise levels in different directions, for example, vertical rays and lateral rays, which needs to be handled by other adaptive noise filtering methods.21 In contrast, Zeng’s algorithms4,5 modify the ramp filtering kernel for each ray, thus it potentially omits the adaptive filtering.
The size of ROI could influence the significance of the halfscan artifacts and image noise on the perfusion defect detection performance. If the ROI size were smaller, noise would be more of an issue and one would want to set αs to be larger to decrease noise.
One might think that the performance of CTP may not be sufficient even after the improvement. We want to emphasize that this was a challenging case with a heterogeneous and moderate perfusion defect. The performance would improve further if the perfusion defect was homogeneous and more severe.
Another major problem in CT perfusion which degrades the reproducibility of perfusion data is the cardiac and respiratory motion between scans and the misregistration among a series of images.10 There are two methods—static and dynamic—being investigated for CTP imaging. Static CTP assesses the perfusion using a step-and-shoot or helical scan obtained during the first-pass enhancement of coronary CT angiography, while dynamic CTP obtains time-attenuation curves from multiple scans over 10–40 s. The misregistration becomes a problem except for static CTP performed with a large detector. We shall leave it to other study.
There are limitations in this study. The heart remained stationary during the scan; in real cases, the heart beats (deforms) and the use of a larger dR could introduce motion artifacts. We argue that the stationary heart allowed us to focus on the halfscan artifacts and image noise, excluding the effect of the motion artifacts. Therefore, the results of the study could be applicable to other applications such as chest CT exams of female patients. The amount of motion artifacts varies strongly depending on the patient heart rates, the gantry rotation speed, and the specific motion compensated image reconstruction method employed. Specific conditions must be chosen to assess the tradeoff of overall artifacts and image noise. This simulation study was performed using monochromatic x-rays, not polychromatic x-rays. We argue, again, that the use of monochromatic x-rays allowed us to exclude the effect of imperfect beam-hardening correction methods.
ACKNOWLEDGMENT
This work was supported in part by NIH/NHLBI Grant No. R01 HL087918. The authors are grateful for discussion with Dr. Takahiro Higuchi of University of Würzburg and Dr. Elliot K. Fishman of The Johns Hopkins University School of Medicine.
REFERENCES
- 1.Parker D. L., “Optimal short scan convolution reconstruction for fanbeam CT,” Med. Phys. 9, 254–257 (1982). 10.1097/00004728-198210000-00061 [DOI] [PubMed] [Google Scholar]
- 2.Zeng K., De Man B., and Thibault J.-B., “Correction of iterative reconstruction artifacts in helical cone-beam CT,” in The 10th International Conference on Fully Three-Dimensional Reconstruction in Radiology and Nuclear Medicine, edited by Kang K., Tsui B. M. W., Chen Z., Kachelriess M., and Mueller K. (Beijing, China, 2009), pp. 242–245. [Google Scholar]
- 3.Schmitt K., Schöndube H., Stierstorfer K., Hornegger J., and Noo F., “Challenges posed by statistical weights and data redundancies in iterative x-ray CT reconstruction,” in The 12th International Meeting on Fully Three-Dimensional Reconstruction in Radiology and Nuclear Medicine, edited by Leahy R. and Qi J. (Lake Tahoe, CA, 2013), pp. 432–435. [Google Scholar]
- 4.Zeng G. L., “A filtered backprojection MAP algorithm with nonuniform sampling and noise modeling,” Med. Phys. 39, 2170–2178 (2012). 10.1118/1.3697736 [DOI] [PMC free article] [PubMed] [Google Scholar]
- 5.Zeng G. L. and Zamyatin A., “A filtered backprojection algorithm with ray-by-ray noise weighting,” Med. Phys. 40, 031113 (7pp.) (2013). 10.1118/1.4790696 [DOI] [PMC free article] [PubMed] [Google Scholar]
- 6.Zeng G. L., “Noise-weighted spatial domain FBP algorithm,” in The Third International Conference on Image Formation in X-ray Computed Tomography, edited by Noo F. (Salt Lake City, UT, 2014), pp. 37–42. [Google Scholar]
- 7.Ko B. S., Cameron J. D., Leung M., Meredith I. T., Leong D. P., Antonis P. R., Crossett M., Troupis J., Harper R., Malaiapan Y., and Seneviratne S. K., “Combined CT coronary angiography and stress myocardial perfusion imaging for hemodynamically significant stenoses in patients with suspected coronary artery disease: A comparison with fractional flow reserve,” JACC: Cardiovasc. Imaging 5, 1097–1111 (2012). 10.1016/j.jcmg.2012.09.004 [DOI] [PubMed] [Google Scholar]
- 8.Huber A. M., Leber V., Gramer B. M., Muenzel D., Leber A., Rieber J., Schmidt M., Vembar M., Hoffmann E., and Rummeny E., “Myocardium: Dynamic versus single-shot CT perfusion imaging,” Radiology 269, 378–386 (2013). 10.1148/radiol.13121441 [DOI] [PubMed] [Google Scholar]
- 9.Primak A. N., Dong Y., Dzyubak O. P., Jorgensen S. M., McCollough C. H., and Ritman E. L., “A technical solution to avoid partial scan artifacts in cardiac MDCT,” Med. Phys. 34, 4726–4737 (2007). 10.1118/1.2805476 [DOI] [PMC free article] [PubMed] [Google Scholar]
- 10.Isola A. A., Schmitt H., Stevendaal U.v., Begemann P. G., Coulon P., Boussel L., and Grass M., “Image registration and analysis for quantitative myocardial perfusion: Application to dynamic circular cardiac CT,” Phys. Med. Biol. 56, 5925–5947 (2011). 10.1088/0031-9155/56/18/010 [DOI] [PubMed] [Google Scholar]
- 11.Crawford C. R. and King K. F., “Computed tomography scanning with simultaneous patient translation,” Med. Phys. 17, 967–982 (1990). 10.1118/1.596464 [DOI] [PubMed] [Google Scholar]
- 12.Taguchi K., “Temporal resolution and the evaluation of candidate algorithms for four-dimensional CT,” Med. Phys. 30, 640–650 (2003). 10.1118/1.1561286 [DOI] [PubMed] [Google Scholar]
- 13.Noo F. and Heuscher D. J., “Image reconstruction from cone-beam data on a circular short-scan,” Proc. SPIE 4684, 50–59 (2002). 10.1117/12.467199 [DOI] [Google Scholar]
- 14.Nett B. E., Zeng K., and Pack J. D., “Image reconstruction from an axial short scan using a Katsevich type algorithm: Considerations for repeatable quantitative imaging,” in The 12th International Meeting on Fully Three-Dimensional Reconstruction in Radiology and Nuclear Medicine, edited byLeahy R. and Qi J. (Lake Tahoe, CA, 2013), pp. 249–252. [Google Scholar]
- 15.Pack J. D., Yin Z., Zeng K., and Nett B. E., “Mitigating cone-beam artifacts in short-scan CT imaging for large cone-angle scans,” inThe 12th International Meeting on Fully Three-Dimensional Reconstruction in Radiology and Nuclear Medicine, edited by Leahy R. and Qi J. (Lake Tahoe, CA, 2013), pp. 300–303. [Google Scholar]
- 16.Hsieh J., Molthen R. C., Dawson C. A., and Johnson R. H., “An iterative approach to the beam hardening correction in cone beam CT,” Med. Phys. 27, 23–29 (2000). 10.1118/1.598853 [DOI] [PubMed] [Google Scholar]
- 17.Stenner P., Schmidt B., Bruder H., Allmendinger T., Haberland U., Flohr T., and Kachelriess M., “Partial scan artifact reduction (PSAR) for the assessment of cardiac perfusion in dynamic phase-correlated CT,” Med. Phys. 36, 5683–5694 (2009). 10.1118/1.3259734 [DOI] [PubMed] [Google Scholar]
- 18.Ramirez-Giraldo J. C., Yu L., Kantor B., Ritman E. L., and McCollough C. H., “A strategy to decrease partial scan reconstruction artifacts in myocardial perfusion CT: Phantom and in vivo evaluation,” Med. Phys. 39, 214–223 (2012). 10.1118/1.3665767 [DOI] [PMC free article] [PubMed] [Google Scholar]
- 19.George R. T., Silva C., Cordeiro M. A. S., DiPaula A., Thompson D. R., McCarthy W. F., Ichihara T., Lima J. A. C., and Lardo A. C., “Multidetector computed tomography myocardial perfusion imaging during adenosine stress,” J. Am. Coll. Cardiol. 48, 153–160 (2006). 10.1016/j.jacc.2006.04.014 [DOI] [PubMed] [Google Scholar]
- 20.George R. T., Ichihara T., Lima J. A. C., and Lardo A. C., “A method for reconstructing the arterial input function during helical CT: Implications for myocardial perfusion distribution imaging,” Radiology 255, 396–404 (2010). 10.1148/radiol.10081121 [DOI] [PubMed] [Google Scholar]
- 21.Kachelriess M., Watzke O., and Kalender W. A., “Generalized multi-dimensional adaptive filtering for conventional and spiral single-slice, multi-slice, and cone-beam CT,” Med. Phys. 28, 475–490 (2001). 10.1118/1.1358303 [DOI] [PubMed] [Google Scholar]


