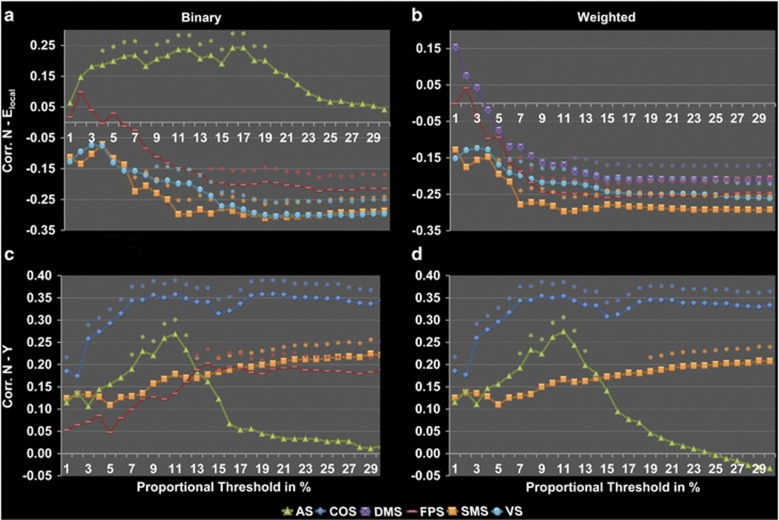
Figure 2.
Correlations between neuroticism and the network measures per module. In the panels, correlations between neuroticism, and local efficiency (Elocal) (a, b) and the participation coefficient (Y) (c, d) can be observed over a range of threshold values (T=0.01–0.30, in increments of 0.01) for binary (a, c) and weighted graphs (b, d) per module. Colors indicate the different modules: AS, affective subnetwork (green); COS, cingulo-operculum subnetwork (dark blue); DMS, default mode subnetwork (purple); FPS, fronto-parietal subnetwork (red); SMS, somatosensory-motor subnetwork (orange); and VS, visual subnetwork (light blue). Significant correlations (p<0.05, uncorrected for the number of threshold values) are marked with an asterisk (*). Only subnetworks, for which significant results were found based on permutation testing, are shown.

