

Abstract
♦ Objectives:
To develop and evaluate the self-management scale for peritoneal dialysis (PD) patients.
♦ Methods:
The item pool was formulated based on literature reviews and in-depth interviews. An initial scale containing five factors and 44 items was constructed through two rounds of Delphi expert consultation and a preliminary test. A total of 313 PD patients from the Jiangsu-Zhejiang-Shanghai area were surveyed to test the reliability and validity of the scale.
♦ Results:
Five factors, namely solution bag replacement, troubleshooting during operation, diet management, complication monitoring, emotion management and return to social life, were extracted by exploratory factor analysis: the 28 items could explain 64.567% of the total variance; the content validity index was 0.963; the Cronbach’s α coefficient and split-half coefficient were 0.926 and 0.960 respectively; and test-retest reliability was 0.937.
♦ Conclusion:
The scale has been proved to be a reliable and valid tool which allows PD nurses to evaluate the self-management ability of PD patients. The evaluation outcomes can serve as a basis for individualized nursing plans and interventions so as to provide highly effective nursing care.
Keywords: PD, self-management, reliability, validity
As the steady worldwide rise in end-stage renal disease (ESRD) population continues (1), the peritoneal dialysis (PD) population rises due to reintegrating dialysis patients with high activities in daily life (ADL) into society as compared to hemodialysis (HD) (2). According to a recent survey, approximately 200,000 patients are receiving peritoneal dialysis (PD) worldwide (3). PD in Asia has become the preferred renal replacement therapy for ESRD patients (4). The number of patients receiving PD treatment in China is approximately 16,000, and it is on the increase each year (5).
Although some progress has been achieved in PD, the control of patients’ conditions is still not satisfactory, and morbidity and mortality of patients is still very high (6). Wu et al. reported that the 3-year technical mortality rate of PD patients in China was 36.7% (7). By encouraging self-care with the aim of improving the quality and length of patients’ lives (8), effective self-management was also beneficial in reducing dialysis complications (2) and reducing medical costs (9). But self-management of PD patients has many requirements including solution bag replacement, troubleshooting during operation and diet management (10) which require unbiased pre-dialysis counseling, close consideration of patients’ preferences and life situation, as well as easy access to health professionals and technical support (11). Hope also found that PD patients were short of understanding of patient-perceived barriers to such therapies in attempting to increase the use of self-caring modalities (12). At present, PD nurses cannot systematically and effectively evaluate patients’ self-management abilities since there is still a lack of effective evaluation tools in China. The self-efficacy scale for PD patients developed by Lin et al. (13) in Taiwan in the 1980s is not fully applicable to patients in mainland China. The existing PD self-management scales in China are either only concerned with solution bag replacement or lacking in rigorous reliability and validity testing (14,15). Costantini et al. have developed the Self-Care for Adults on Dialysis tool (SCAD) which is not completely suitable for Chinese PD patients (16,17). It is very important that effective evaluation tools be developed for PD patients in China. This study aims to develop a comprehensive and localized self-management scale with good reliability and validity for assessing the effectiveness of PD patients’ self-management and nursing interventions.
Methods and Subjects
Theoretical Framework and Conceptual Definition
The theoretical framework of the self-management scale for evaluating PD patients was based on the “Health deviation self-care requisites” in Orem’s Theory of Self-care. According to Orem (18), self-care deficit occurs in conditions of illness, injury, or disease, when self-care agency falls short of self-care need. Due to the continuous therapeutic needs of PD patients at home, PD nurses are incapable of providing continuous interventions for them. In this sense, PD patients are lacking in effective self-care in China (10), which means nursing care is required. It is on such a theoretical basis that we began to develop a self-management evaluation scale for PD patients.
Subjects
In order to ensure the availability of participants and adequate sample size, convenience sampling method was used to select 313 PD patients from seven first-class hospitals in the Jiangsu-Zhejiang-Shanghai area from October 2012 to April 2013. Inclusion criteria: subjects should meet the diagnostic criteria for uremia (19), be 18 years old and over, be capable of self-evaluation, follow a regular follow-up schedule and have a stable condition (excluding uremia patients with complications such as acute heart failure, respiratory failure, stroke, etc.), be able to articulate their self-care experience and feelings, and give informed consent to participate in this study on a voluntary basis.
Item Pool Development and Pre-Test Scale Preparation
The item pool was derived from three sources: 1) literature reviews of local and foreign publications; 2) in-depth interviews with 12 patients who have been undergoing PD therapy for more than six months to identify problems in their operations of the PD system and extract items concerning self-management; 3) two rounds of Delphi expert consultation. The 15 experts being consulted for each round were the same and their specialty areas included nephrology, cardiovascular medicine, nutrition, pedagogy, scale development, etc. Among the 15 experts, 11 were physicians and nurses from the nephrology department, accounting for 73.33% of the expert panel. Based on literature reviews and in-depth interviews, repeated discussions on the extracted items were held: items with repetitions or ambiguities in meaning as well as irrelevant items were deleted. Nine PD patients with different ages, educational backgrounds and occupations were purposefully selected to assess the comprehensibility of the items. The expert panel was asked to evaluate whether each item in the scale was a logical representative of the content to be measured. The contribution of individual items in each dimension was adjusted. Finally, a pre-test scale with five factors and 44 items was formed.
Scale Structure and Scoring
The initial scale included the following five dimensions: solution bag replacement, which is directly related to PD, medication management, diet management, monitoring of PD-related biochemical indexes and complications, emotion management and return to social life. The dimensions in the finalized scale were amended or confirmed by factor analysis. The Likert 4-grade scoring system was used for the response items in the five subscales. The scores for “Never”, “Sometimes”, “Often”, and “Always” are 0, 1, 2, and 3 points respectively. The scale does not include any reverse items. The higher the score is, the higher the self-management level of PD patients.
Data Collection
Four investigators were uniformly trained, of whom two graduate students were sent to hospitals in Shanghai and Zhejiang province to distribute copies of the initial scale and give verbal instructions when necessary to assure the homogeneity of the survey. Prior to the survey, its objectives and methods were explained to the participating PD patients and their informed consent was obtained. For illiterate patients, the investigators read the initial scale to them in concise and clear language and the patients chose the score accordingly. All questionnaires were collected on site. The test-retest interval was determined by the principle that the contents of the initial scale should be forgotten and it should not be subject to the influence of the patient’s condition or the circumstances for treatment (20). Therefore, one week after the initial test, 35 patients were randomly selected to participate in the re-test to evaluate the test-retest reliability of the scale.
Structure Validity and Internal Consistency Coefficient
Kaiser-Meyer-Olkin (KMO) Measure of the data was used to see whether the scale was suitable for factor analysis; Critical Ration (CR) and Pearson correlation analysis were used to examine the discrimination of items (11); and exploratory factor analysis was used for construct validity analysis. Screening criteria (16): 1) Kaiser-Meyer-Olkin value < 0.5 meant the scale was not suitable for factor analysis. 2) Items with factor loading coefficient < 0.4 were deleted. 3) Factors with Eigen value > 1 were extracted. 4) The critical ratio of an item was significant when p < 0.05. 5) Correlation coefficients between items and the total scale, between items and factors, among factors, and between factors and the total scale were analyzed, and p < 0.05 was considered significant.
Cronbach’s α coefficient and test-retest reliability were used to measure the overall internal consistency reliability of the scale. The Cronbach’s α coefficient of an ideal instrument should be above 0.80 and those of the sub-scales should be above 0.60 (16). The correlation coefficient between two tests was above 0.7, which means the retest reliability was good and the scale had good stability (20).
Ethical Considerations
Approval to conduct the study was obtained from the Ethics Committee of the First Affiliated Hospital of Soochow University. Subjects willing to participate signed a written informed consent form. All subjects were assured of confidentiality and the ability to decline participation in the study.
Data Processing
The SPSS 16.0 software was used for data entry and analysis. Independent samples, t-test, and Pearson correlation analysis were used for item analysis; scale reliability was measured using Cronbach’s α coefficient, split-half coefficient and test-retest coefficient; construct validity was tested by exploratory factor analysis.
Results
Demographic Data of Participants
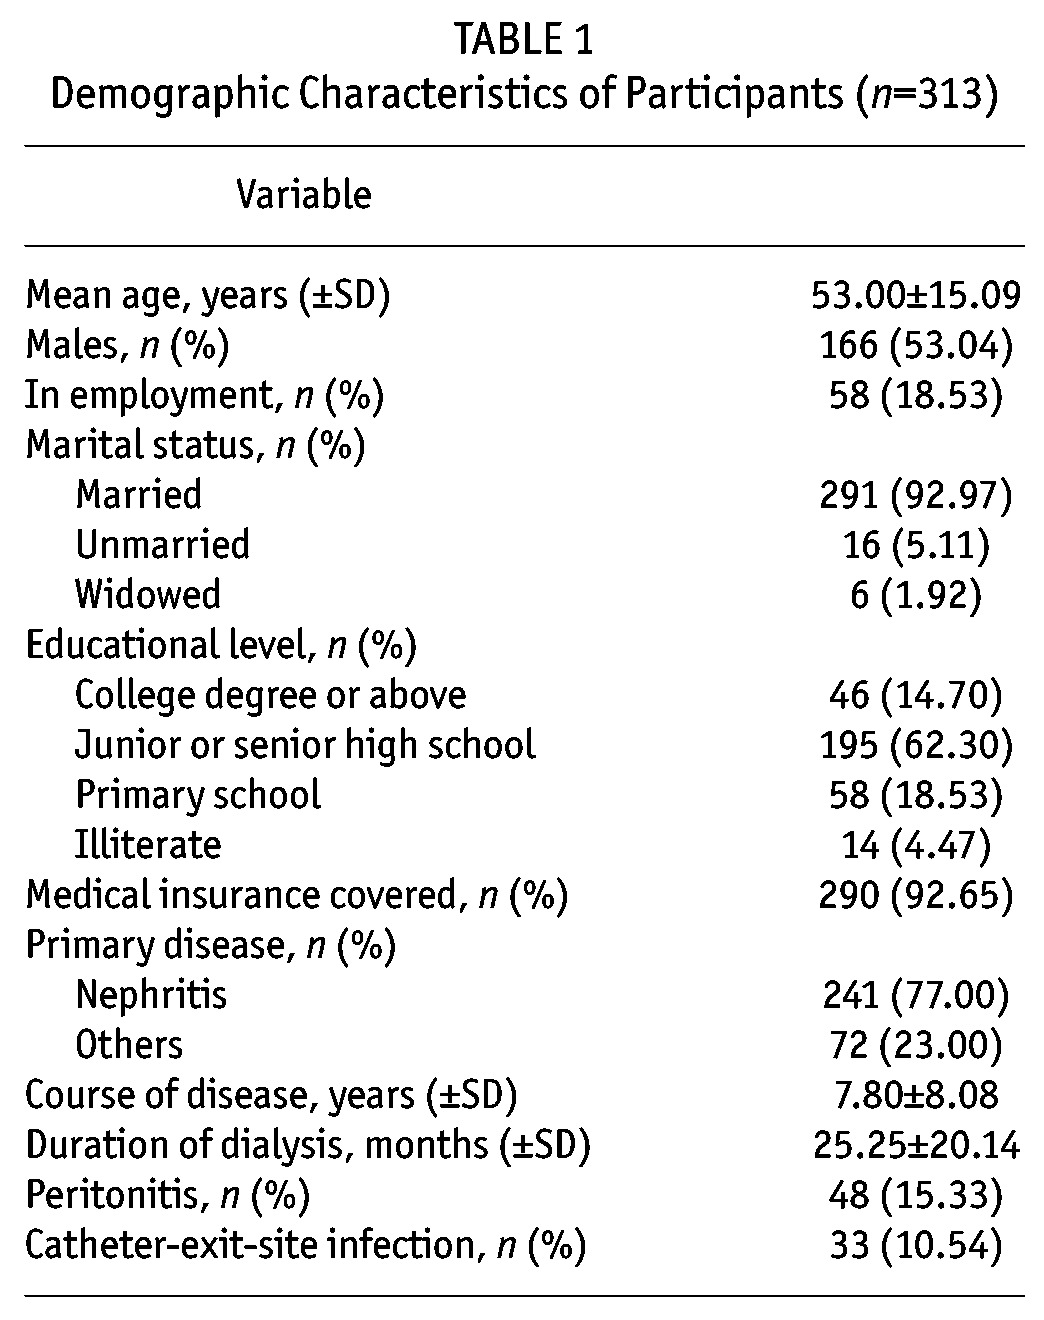
A total of 336 copies of the initial scale were collected with the completion time being 8.34 ± 4.80 min for each. Among those collected, 4 were refuse-to-answer; 19 either had over 11 omissions or had the same answer for all the items. Therefore, these 23 copies were excluded and the remaining 313 were considered valid, with the recovery rate being 93.15%. The demographic characteristics of the participants are listed in Table 1.
TABLE 1.
Demographic Characteristics of Participants (n=313)
Item Analysis
The correlation coefficients of the original Items No. 10, 15, 23, 28, 33 and 44 were r < 0.4. However, both t-test and correlation analysis showed that the significance probability (p) of each item was p < 0.001, which indicated that the discrimination of each item was good, so all the items were kept to undergo further tests.
Validity Analysis
Face Validity and Content Validity: The initial scale was drafted based on literature reviews, semi-structured interviews with PD patients and Delphi expert consultation, following which it was tested against a small sample and showed good face validity. According to the Content Validity Index (CVI) equation (22) and the number of votes each item got from the panel of 15 experts, the average CVI of the total scale was 0.963, with the CVI of each factor being 0.9 ∼ 1.0 and that of each item being 0.73 ∼ 1.0.
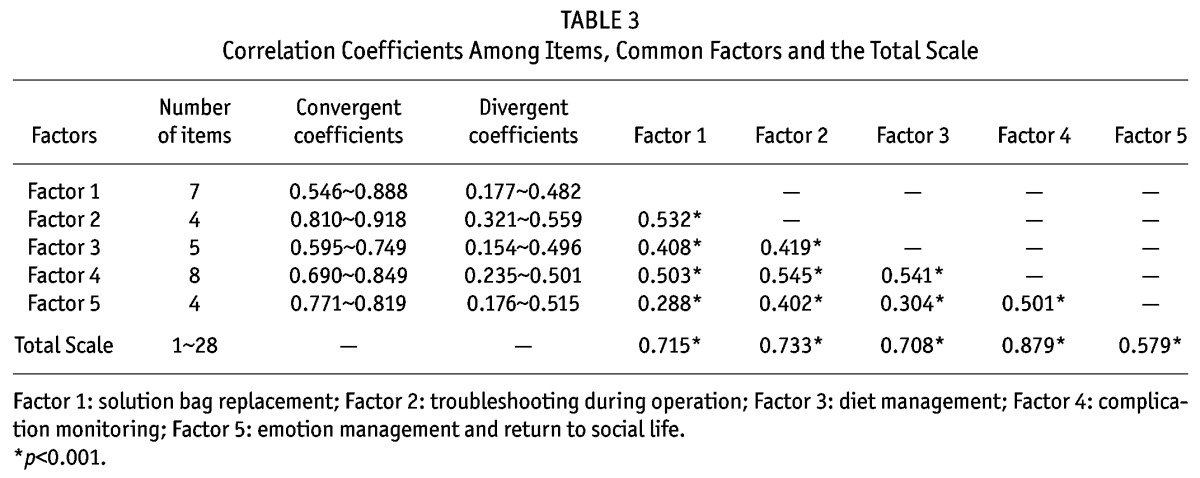
Construct Validity: The value of KMO was 0.911 and the result of Barlett’s sphericity test was χ2 = 8789.137 (df = 946, p = 0.000), which indicated that the items of the scale were suitable for factor analysis (21). Using principal component analysis, through varimax orthogonal rotation, factors with eigen values > 1 were selected. Complying with the screening principle of factor analysis (21), seven rotations were made and analyses were completed accordingly. Sixteen original items were deleted. The loading coefficients of the common factors to which original items No. 10, 28 and 33 belonged were 0.110, 0.338 and 0.390 respectively, which attested to the low degree of discrimination in factor analysis. Therefore, the three items were deleted along with 13 other items that were removed as well. Item No. 15, “use of dialysis solution per doctor’s orders”, originally fell under the factor “mediation management”. After the rotations, it was classified under the factor “technical operations directly related to PD” and its factor coefficient was 0.591. Broadly speaking, it is reasonable that the item falls under the range of “selecting the right dialysis solution during operation”. Therefore, in accordance with the results of factor analysis, the items under “technical operations directly related to PD” were retained. Original item No. 23, “low intake of food rich in salt and sodium”, was changed to “moderate intake of food containing salt and sodium” and was re-classified under the “diet management” factor after repeated discussions with the expert panel. The loading coefficient of original item No. 44, “chat and get together with friends and take part in recreational activities”, was 0.778 under the “emotion management and return to social life” factor and was thus retained. Finally, a total of 28 items were obtained. By subjecting the original scale to Scree Plot analysis (Figure 1), a final scale with five factors and 28 items was derived. The factors were renamed according to their potential attributes and the sequence of items was adjusted correspondingly. The cumulative explained variance rate of the scale was 64.567%, and the variance contribution rate of each factor fell in the range of 8.938% ∼ 18.882%. The eigen value of the common factors was 1.512 ∼ 10.241 and the loading coefficient of items under common factors was 0.535 ∼ 0.915 (Table 2). In addition, the validity of the scale was tested against the convergent validity between items and the common factor to which they belong, the divergent validity between items and other common factors, the correlation coefficient among common factors and that between common factors and total scale (Table 3).
Figure 1 —
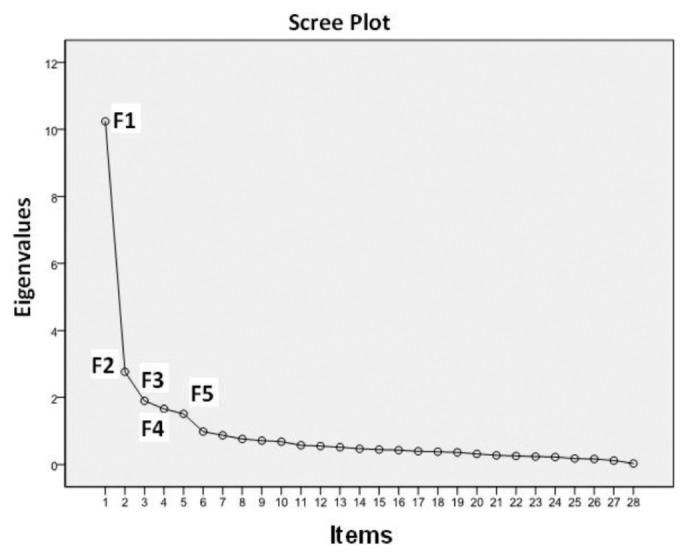
The original scale subject to Scree Plot analysis.
TABLE 2.
Loading Coefficients of Items Under Each Factor (n=313)
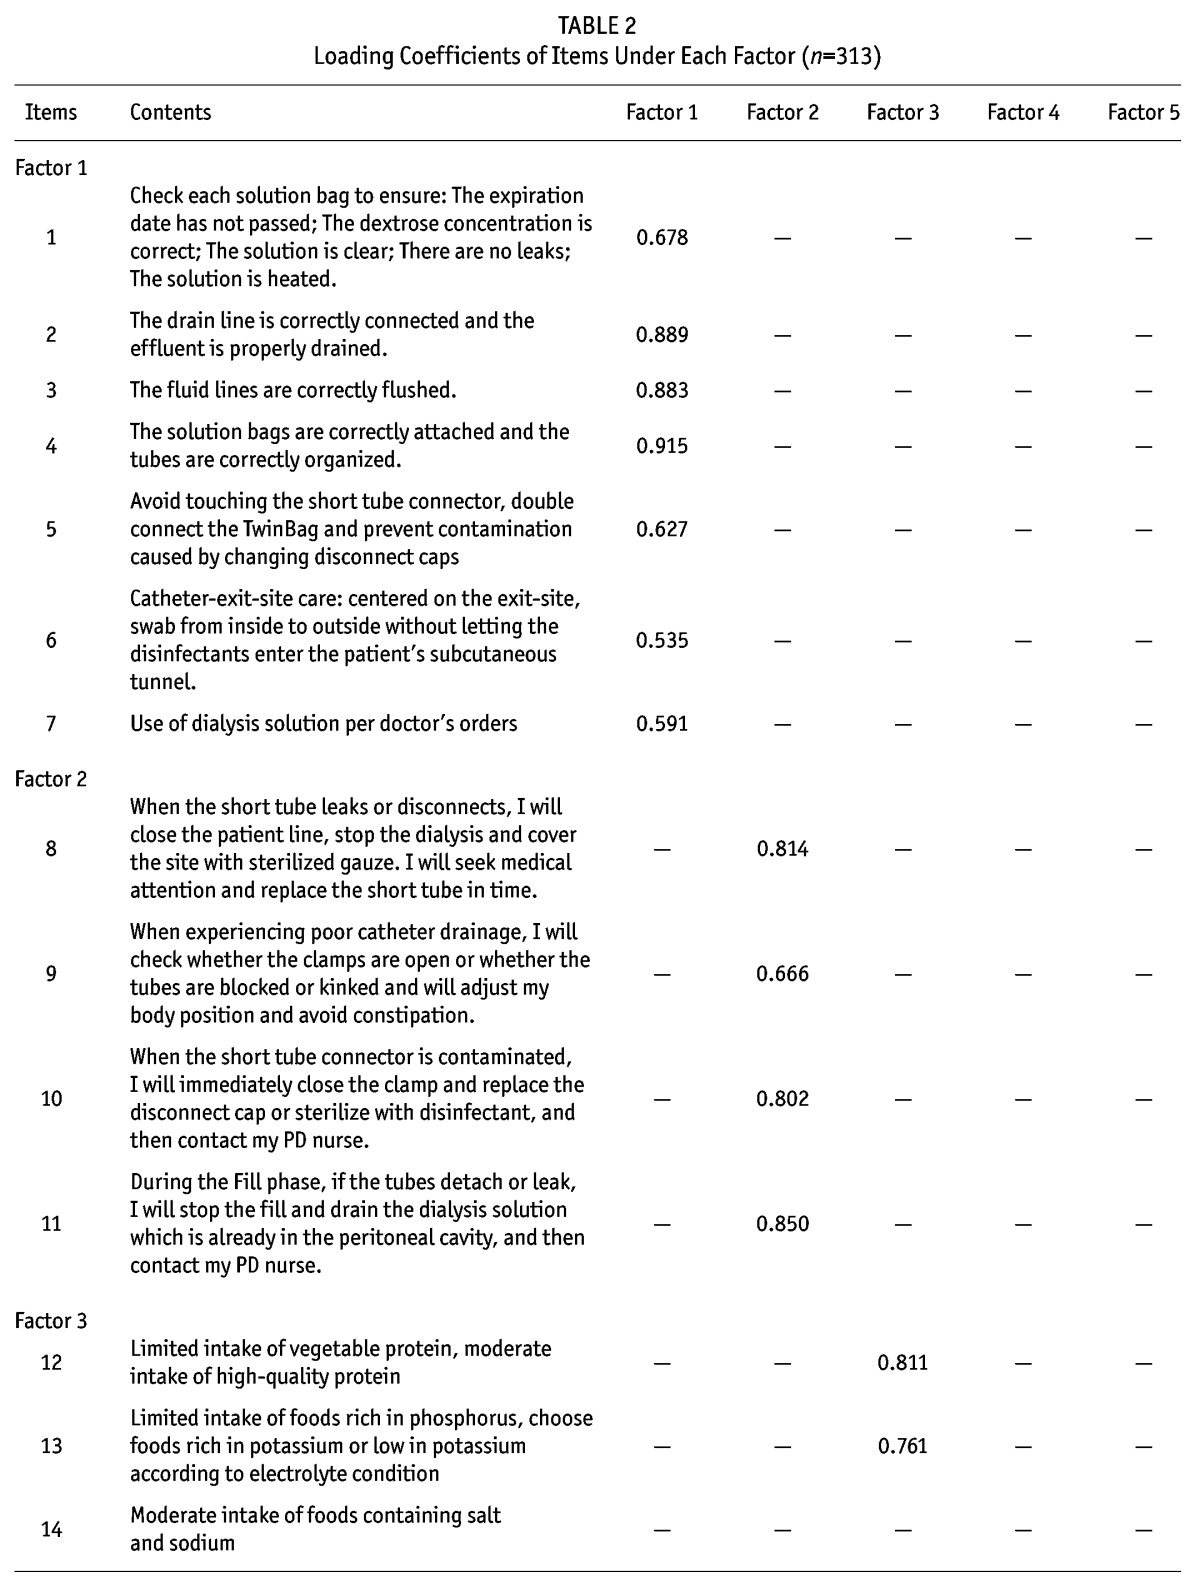
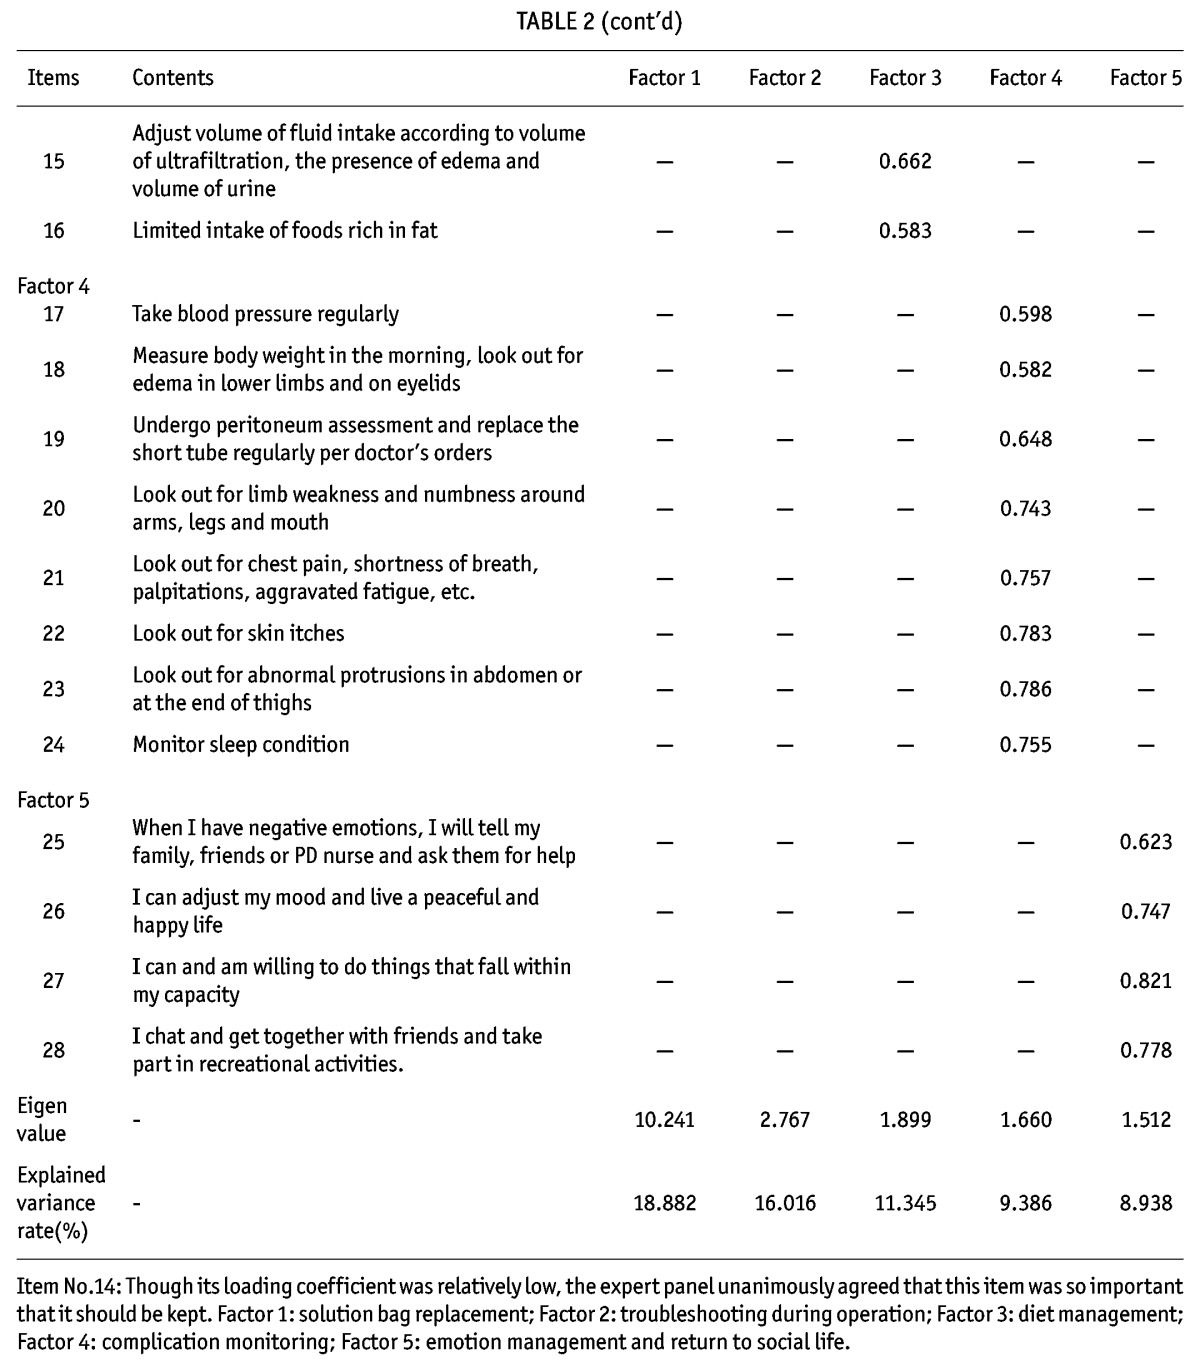
TABLE 3.
Correlation Coefficients Among Items, Common Factors and the Total Scale
Reliability Analysis: The internal consistency coefficient (known as the Cronbach’s α coefficient) of the total scale was 0.926. The internal consistency coefficients of the common factors fell in the range of 0.650 ∼ 0.908, and the split-half coefficient of the total scale was 0.960 with that of each factor falling in the range of 0.640 ∼ 0.925 (Table 4).
TABLE 4.
Scale Reliability
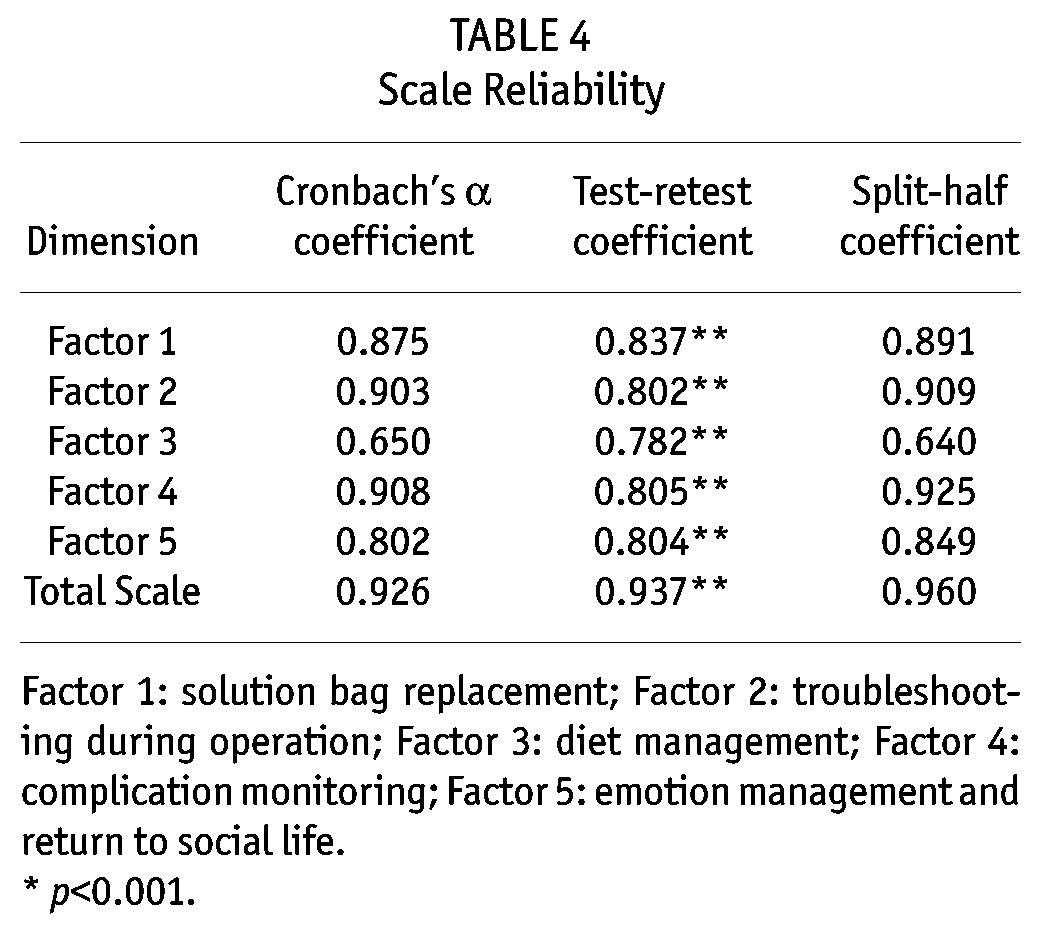
Stability Analysis: The test-retest reliability of the total scale was r = 0.937, with that of each factor falling in the range of 0.782 ∼ 0.837, which was statistically significant (p < 0.001) and indicated that the scale had good stability over time (Table 4).
Discussion
Sampling
The scale was developed in strict accordance with the inclusion criteria. The survey was conducted among PD patients in seven hospitals in the Jiangsu-Zhejiang-Shanghai area. The sample size was big enough for sampling of tool development (21), and patients included came from different areas, different hospitals and different medical settings and thus were representative. The sample size was 7.11 times the number of items, which met the sample size requirements of characteristics assessment in scale surveying (21). We plan to further test the reliability and validity of the scale in future randomized controlled trials in order to improve the insufficiency of sampling in this study.
Scale Reliability
The Cronbach’s α coefficient and the split-half reliability of the scale were high, indicating that the items of the scale had a high degree of relevance. Test-retest reliability coefficient also suggested that the scale had high stability. Although the Cronbach’s α coefficient and split-half coefficient of the factor “diet management” were low, they still fell under an acceptable range. Also, via step-by-step item analysis, it was found that after original item No. 23, “limited intake of foods rich in salt and sodium”, was deleted, the Cronbach’s α coefficient and split-half coefficient of the factor were increased significantly to 0.778 and 0.791 respectively. However, the expert panel considered the item very important and unanimously agreed on retaining it. The coefficients of the other four factors were all above 0.80.
Scale Validity
Content Validity: All the invited experts possess a master’s degree or above and 60% of them are associate professors or above. The panel of experts examined the classification and logicality of all the items and provided constructive advice for the research from different perspectives, thus making the scale comprehensible and covering all the aspects of self-management of PD patients. The initial scales which underwent two rounds of expert consultation were all collected in due time and the positive coefficient was 100%, with the expert judgment coefficient being 0.88, familiarity coefficient being 0.81, and authority coefficient being 0.84, which indicated that the authority of the experts consulted for this study enjoy a high degree of authority and thus the consultation had high credibility. The CVI value of the scale was ≥ 0.75, which suggests that the scale constructed was acceptable (23). The CVI values of the scale and each factor were all above 0.9, indicating that the content of the scale was highly pertinent and could accurately express the concepts to be measured.
Construct Validity: Factor analysis tested the reliability of the common factors. Scree Plot revealed that the curve smoothed out from the sixth factor on, which means that no special factors were worth extracting and therefore only five common factors were extracted. After factor analysis, the number of the items under the original factor “medication management” was less than three, so the factor was deleted (22). The original factor “technical operations directly related to PD” was further divided into two factors, “solution bag replacement” and “troubleshooting during operation”. Except for the item “use of dialysis solution per doctor’s orders” which originally fell under the factor “mediation management” and was relocated to another factor, the rest of the items all remained under their initial factor and had a relatively high loading coefficient. Correlation analysis also suggested that the correlation coefficients of each item with the common factor to which it belonged were all higher than those with other factors, thus attesting to the convergent and divergent validity of the scale (24); there was a low-to-medium degree of correlation among the common factors, indicating that the concept of each factor was inter-related while independent of each other and the factors could jointly reflect the overall condition of self-management of PD patients; and that there was a high degree of correlation between the common factors and the total scale, which suggested that the content discrimination and the hierarchical structure of factors were good.
Limitations
There are some limitations in this study. It did not include any criterion validity tests using relevant scales. Sampling method should be improved. The analysis of certain problems was limited to surface level. The survey was only conducted in hospitals in the Jiangsu-Zhejiang-Shanghai area, which is not all-representative and further surveys should be conducted in hospitals of different levels nation-wide using proportional stratified sampling so that the results of this study can be verified against a larger sample size, resulting in a more mature self-management evaluation scale for PD patients in mainland China.
Clinical Implications
This scale is a scientific measuring tool with good reliability and validity, which can be used to guide the work of PD nurses. When ESRD patients use PD for the first time, the scale can be used to evaluate their self-management level. If the total score or score for one particular factor is relatively low, PD nurses should formulate and implement individualized interventions. Before discharge, nurses should base the discharge plan on the results of a second-time evaluation by the scale. During implementation of self-management by PD patients, PD nurses should evaluate patients in a timely manner to identify existing problems and carry out corresponding nursing interventions in order to avoid complications and improve the long-term outcomes for PD patients.
Disclosures
The authors hereby declare that no conflict of interest exists regarding this article.
Acknowledgments
This study is sponsored by the National Science Foundation of China (Grant No. 81172347).
REFERENCES
- 1. Khan A, Rigatto C, Verrelli M, Komenda P, Mojica J, Roberts D, et al. High rates of mortality and technique failure in peritoneal dialysis patients after critical illness. Perit Dial Int, 2012; 32:29–36. [DOI] [PMC free article] [PubMed] [Google Scholar]
- 2. Imada A. Care for patients carrying out dialysis therapy at home. Contrib Nephrol 2012; 177:93–8. [DOI] [PubMed] [Google Scholar]
- 3. Jain AK, Blake P, Cordy P, Garg AX. Global trends in rates of peritoneal dialysis. J Am Soc Nephrol 2012; 23:533–44. [DOI] [PMC free article] [PubMed] [Google Scholar]
- 4. Yao Q. Peritoneal dialysis is the optimal therapy for Asians with end-stage renal failure. Chin J Nephrol 2010; 26:481–3. [Google Scholar]
- 5. Lo WK. Peritoneal dialysis in the far East-an astonishing situation in 2008. Perit Dial Int 2009; 29(Suppl 2):S227–9. [PubMed] [Google Scholar]
- 6. Stanković-Popović V, Popović D, Dimković N, Maksić D, Vasilijić S, Colić M, et al. Influence of peritoneal dialysis solution biocompatibility on long-term survival of patients on continuous ambulatory peritoneal dialysis and the technique itself. Vojnosanit Pregl 2013; 70:352–62. [DOI] [PubMed] [Google Scholar]
- 7. Wu B, Wang M, Zhao H. Survival rates in patients with diabetes on peritoneal dialysis in China. Ren Fail 2013; 35:231–4. [DOI] [PubMed] [Google Scholar]
- 8. Brady M, O’Donoghue D. Back to the future: changes in the dialysis delivery model in the UK. Perit Dial Int 2011; 31(Suppl 2):S63–72. [DOI] [PubMed] [Google Scholar]
- 9. Lorig KR, Holman H. Self-management education: history, definition, outcomes and mechanisms. Ann Behav Med 2003; 26:1–7. [DOI] [PubMed] [Google Scholar]
- 10. Jian-hong P, Ling L, Xiao-hua W, Yang J, Yi X, Jing-bo Q. A qualitative research on the experience of continuous ambulatory peritoneal dialysis patients during home-based self-management. J Nurs Training 2014; 29 (Accepted for publication) [Google Scholar]
- 11. Lee A, Gudex C, Povlsen JV, Bonnevie B, Nielsen CP. Patients’ views regarding choice of dialysis modality. Nephrol Dial Transplant 2008, 23:3953–9. [DOI] [PubMed] [Google Scholar]
- 12. Hope J. A patient perspective on the barriers to home dialysis. J Ren Care 2013; 39, Suppl 1:3–8. [DOI] [PubMed] [Google Scholar]
- 13. Lin QJ, Lu L, Wang JX, et al. Development and testing of self-efficacy scale for CAPD patients. Chin Nurs Res 1987; 6:315–26. [Google Scholar]
- 14. Su CY, Zheng XX, Ma YQ, Nie JD, Sun LH, Zhang F, et al. Applying self-management education to improve the health status of patients following peritoneal dialysis. Chin J Nur 2008; 43:8–11. [Google Scholar]
- 15. Zhao Y, Ren XY, Su CY. Evaluation and analysis of peritoneal dialysis patients’ dialysate exchange procedures. Chin J Mod Nurs 2010; 16:1993–5. [Google Scholar]
- 16. Costantini L, Beanlands H, Horsburgh ME. Development of the self-care for adults on dialysis tool (SCAD). CANNT J 2011; 21:38–43. [PubMed] [Google Scholar]
- 17. Horsburgh ME, Laing GP, Beanlands HJ, Meng AX, Harwood L. A new measure of ‘lay’ care-giver activities. Kidney Int 2008; 74:230–6. [DOI] [PubMed] [Google Scholar]
- 18. Denyes MJ, Orem DE, Bekel G SozWiss. Self-care: a foundational science. Nurs Sci Q 2001; 14:48–54. [DOI] [PubMed] [Google Scholar]
- 19. Chen XW, Liang D, Liu HF. Chronic Renal Failure. Beijing: China Medical Science Press; 2006:261–7. [Google Scholar]
- 20. Daving Y, Andren E, Nordholm L, Grimby G. Reliability of an interview approach to the Functional Independence Measure. Clin Rehahil 2001; 15:301–10. [DOI] [PubMed] [Google Scholar]
- 21. Wu ML. Statistical analysis of questionnaires: operation and application of SPSS. Chongqing: Chongqing University Press; 2010:158–265. [Google Scholar]
- 22. Shi JZ, Mo XK, Sun ZQ. Content validity index in scale development. J Cent South U (Med Sci) 2012; 37:152–5. [DOI] [PubMed] [Google Scholar]
- 23. Polit DF, Beck CT. The content validity index: Are you sure you know what’s being reported? Critique and recommendations. Res Nurs Health 2006; 29:489–97. [DOI] [PubMed] [Google Scholar]
- 24. Chen PY. Application of SPSS 13.0. Beijing: People’s Medical Publishing House; 2005: 252. [Google Scholar]