Abstract
Lung cancer is among the major causes of cancer deaths, and the survival rate of lung cancer patients is extremely low. Recent studies have demonstrated that the gene CDKN3 is related to neoplasia, but in the literature severe controversy exists over whether it is involved in cancer progression or, conversely, tumor inhibition. In this study, we investigated the expression of CDKN3 and its association with prognosis in lung adenocarcinoma (ADC) and squamous cell carcinoma (SCC) using datasets in Lung Cancer Explorer (LCE; http://qbrc.swmed.edu/lce/). We found that CDKN3 was up-regulated in ADC and SCC compared to normal tissues. We also found that CDKN3 was expressed at a higher level in SCC than in ADC, which was further validated through meta-analysis (coefficient = 2.09, 95% CI = 1.50–2.67, P < 0.0001). In addition, based on meta-analysis for the prognostic value of CDKN3, we found that higher CDKN3 expression was associated with poorer survival outcomes in ADC (HR = 1.65, 95% CI = 1.39–1.96, P < 0.0001), but not in SCC (HR = 1.10, 95% CI = 0.84–1.44, P = 0.494). Our findings indicate that CDKN3 may be a prognostic marker in ADC, though the detailed mechanism is yet to be revealed.
Keywords: lung adenocarcinoma, lung squamous cell carcinoma, CDKN3, prognostic marker, meta-analysis
Introduction
Lung cancer is one of the most prominent types of cancer, both in the US and around the world. For the past two decades, it has been the second-most diagnosed type of cancer and the leading cause of cancer death in the US for both males and females.1 On a global scale, the GLOBOCAN project by the International Agency for Research on Cancer (IARC) reported in 2012 that lung cancer had the highest incidence and mortality among all cancer types.2 Despite massive efforts in research, the 5-year survival rate of only 16.8% is still significantly lower than most other cancers.3 Therefore identifying effective prognostic factors is critical, so that patients can be properly categorized by potential outcomes and risks, and more appropriate treatments can be planned to improve survival. As diverse subtypes of lung cancers tend to differ in their biology,4–7 one plausible route to better treatments may lie in investigating prognostic markers in a subtype-specific manner.
Deregulated proliferative signaling is a keystone of cancer development.8 Under normal conditions, a cell cycle is elaborately controlled by three major checkpoints: the G1/S checkpoint, G2/M checkpoint and M checkpoint. The G1/S checkpoint, also called the restriction point, determines whether or not the cell enters a new round of DNA replication and cell division. Once past this point, the cell is committed to completing the entire cell cycle.9 Thus the restriction point is the most crucial for the proliferation rate. G1/S transition signaling is frequently mutated in cancers,10 which makes it a hotspot for the discovery of drug targets and prognostic markers for various cancers, including lung, bladder, liver cancer and others.11–15
The CDKN3 gene, mapped to chromosome 14q22,16 encodes a dual specificity phosphatase at G1/S transition, which interacts with Cdk2, dephosphorylates threonine 160 when Cyclin is dissociated or degraded, and prevents its Cyclin-dependent kinase activity.17–19 When overexpressed in yeast or HeLa cells, cell cycle progression is retarded,17 suggesting CDKN3 is a negative regulator of cell proliferation. It has also been shown that CDKN3 is down-regulated in human glio-blastoma20 and that CDKN3 knock-down facilitates leukemia xenograft growth in mice.21 Paradoxically, however, even more evidence implies the opposite scenario: CDKN3 is in fact overexpressed in hepatocellular carcinoma, cervical cancer and epithelial ovarian cancer.22–24 Overexpression of CDKN3 promotes cell proliferation in renal cancer cells and hepatocel-lular carcinoma cells,22,25 and CDKN3 depletion inhibits the growth of ovarian cancer cell lines,24 which makes it a potential therapeutic target. In addition to the increase in cell proliferation, CDKN3 overexpression also renders renal cancer cells more tumorigenic, invasive and resistant to apoptosis.25 Moreover, CDKN3 expression has been associated with poor survival in cervical cancer and may be a potential prognostic marker.23 Therefore it is probable that whether CDKN3 is tumor-suppressive or oncogenic depends on different molecular contexts in diverse cancer types, which is still far from being fully understood.
Non-small-cell lung cancer (NSCLC) is the most common cause of lung cancer death, accounting for up to 85% of deaths from lung cancer. Two subtypes account for 70% of NSCLC, lung adenocarcinoma (ADC) and squamous cell carcinoma (SCC). In order to investigate whether CDKN3 is a potential prognostic marker in ADC and/or SCC, we examine CDKN3 differential expression and its association with patient outcomes in the clinical studies collected in our lung cancer database. We find that CDKN3 is differentially expressed between normal, ADC and SCC samples. Subsequent meta-analyses substantiate its differential expression between ADC and SCC, and indicate that CDKN3 expression is a robust biomarker for poor prognosis in ADC patients but not in SCC patients.
Methods
Data source and preprocessing
The datasets included in the analysis were selected from our group’s Lung Cancer Database (LCDB) supporting Lung Cancer Explorer (LCE; http://qbrc.swmed.edu/lce/). LCDB stores datasets selected from over sixty lung cancer gene expression microarray data-sets in the public domain (GEO, ArayExpress etc.) as well as private data from University of Texas Southwestern Medical Center. Thirty-seven datasets satisfying the following criteria were collected into LCDB: (1) clinical outcomes were available along with gene expression profiles; and (2) genome-wide platforms either had clear probe annotations or could provide probe sequences to be processed by Blast alignment probe mapping in Probemapper.26 In our analysis, when raw data were not available, data processed by the authors were used; otherwise, data processed by our group from raw data were used. The gene expression profiles of each sample were log2-transformed, and standardized to have zero median and unit variance.
Probe-level data were aggregated to the gene level by the following two steps: (1) Probes were mapped to genes based on one of three probe mapping information sources (prioritized from high to low): Blast alignment in Probemapper (weight = 1), platform vendor, and Bioconductor. The highest-priority source among those available was used. (2) When multiple probes were mapped to a gene, the arithmetic mean of the probe-level expression was computed as the expression level for the gene.
Occasionally a patient may have had multiple tumor or normal samples. In such cases, the average expression level from the samples was used for that patient under the tumor and normal conditions, respectively.
Selection of datasets in statistical analyses
Datasets with patients annotated as ADC or SCC were selected from LCDB in our study, and datasets without CDKN3 expression information were excluded. The included datasets were further filtered according to the criteria for specific analysis (Table 1). Patient characteristics of each dataset are summarized in Table S1. For the meta-analysis of CDKN3 differential expression, datasets with both ADC and SCC patients were included. For the meta-analysis of CDKN3 hazard ratios (HR) in ADC or SCC, datasets containing ADC or SCC patients with information about overall survival time and vital status were included. When comparing CDKN3 expression levels in a particular dataset, we required that the sample size of each group (ADC, SCC, normal) be larger than 20 to assure robust analysis results.
Table 1.
List of candidate datasets for the analyses.
| STUDY | YEAR | DATASET NAME | ADC & SCC | SCC+SURVIVAL | ADC+SURVIVAL | ADC >20 & SCC >20 |
|---|---|---|---|---|---|---|
| Larsen et al.55 | 2007 | Lung_Larsen_2007_A | N | Y | N | N |
| Larsen et al.56 | 2007 | Lung_Larsen_2007_B | N | N | Y | N |
| Kuner et al.57 | 2009 | Lung_Kuner_2009 | Y | N* | Y | N |
| Bild et al.58 | 2006 | Lung_Bild_2006 | Y | Y | Y | Y |
| Hou et al.34 | 2010 | Lung_Hou_2010 | Y | Y | Y | Y† |
| Tomida et al.59 | 2009 | Lung_Tomida_2009 | N | N | Y | N |
| Baty et al.60 | 2010 | Lung_Baty_2010 | Y | Y | Y | N |
| Matsuyama et al.61 | 2011 | Lung_Matsuyama_2011 | Y | Y | Y | Y |
| Bhattacharjee et al.62 | 2001 | Lung_Bhattacharjee_2001 | Y | N | Y | Y |
| Raponi et al.63 | 2006 | Lung_Raponi_2006 | N | Y | N | N |
| Shedden et al.64 | 2008 | Lung_Shedden_2008 | N | N | Y | N |
| Zhu et al.65 | 2010 | Lung_Zhu_2010 | Y | Y | Y | Y |
| Girard et al.66 | 2011 | Lung_Girard_2011 | N | N | N* | N |
| Jones et al.67 | 2004 | Lung_Jones_2004 | N | N | N* | N |
| Moriya et al.68 | 2007 | Lung_Moriya_2007 | Y | N | N | N |
| Wright et al.69 | 2010 | Lung_Wright_2010 | N | N | Y | N |
| Ding et al.70 | 2008 | Lung_Ding_2008 | Y | N | N | N |
| Lee et al.71 | 2008 | Lung_Lee_2008 | Y | Y | Y | Y |
| Curley et al.72 | 2005 | ExpO | Y | N | N | Y |
| Dehan et al.73 | 2007 | Lung_Dehan_2007 | Y | N | N | N |
| Fujiwara et al.74 | 2012 | Lung_Fujiwara_2012 | Y | N | N‡ | N |
Notes:
Survival data for the corresponding cancer subtype exist, but for either high CDKN3 or low CDKN3 group there are no deceased patients and thus the Cox proportional hazard model is not applicable.
More than 20 patients have normal samples.
Only one patient has survival time information.
Statistical methods
All the statistical analyses were performed using R (http://cran.us.r-project.org/). Cox proportional hazard models were fitted and meta-analyses conducted using the R packages “survival” and “meta”, respectively. For the meta-analysis on CDKN3 differential expression, a logistic regression of cancer subtype (SCC vs ADC) on CDKN3 expression was fitted for each eligible dataset. The regression coefficients were then pooled by meta-analysis. Similarly, the associations between CDKN3 expression and age, cancer stage, and gender were investigated by combining linear regression coefficients or mean differences via meta-analysis (Figs. S8–S10).
The prognostic value of CDKN3 was studied using the Cox proportional hazard model for ADC and SCC patients separately. The median (or mean) of CDKN3 expressions in ADC/SCC patients of a dataset was used as a cutoff to categorize the patients into high CDKN3 and low CDKN3 groups. Then a Cox proportional hazard model was fitted to estimate the HR of the high CDKN3 group vs. low CDKN3 group and the corresponding 95% confidence interval (CI). Finally meta-analysis was used to combine estimates of log(HR) from different datasets.
Pooled values of logistic/linear regression coefficients, log(HR) or mean differences were calculated using the inverse-variance fixed effect model27 or DerSimonian-Laird random effects model.28,29 The fixed effect model assumes a common true effect for all studies in the meta-analysis, while the random effects model assumes that the true effect for a study is a normally distributed random variable. When inter-study heterogeneity is negligible, the fixed effect model is preferred for its higher statistical power. When there is non-negligible variation between the effects of different studies, the type I error rate is elevated if using the fixed effect model, so the random effects model should be used instead.30 The choice between the fixed effect and random effects models was made based on testing the heterogeneity between studies via the commonly-used statistics I2 and Cochran’s Q31. If I2 was higher than 50% and the P-value from the Chi-square test for Cochran’s Q was smaller than 0.10, we regarded it as an indication of high inter-study heterogeneity and used the random effects model; otherwise the fixed effect model was used. Begg’s funnel plot was made and Egger’s test performed to account for potential publication bias.32,33 In the funnel plot, the treatment effect (x-axis) was plotted against its standard error (y-axis). We expected that the studies would be distributed symmetrically about the pooled effect size if there were no publication bias, while the existence of publication bias would generate an asymmetric plot, and the significance of asymmetry could be evaluated by Egger’s test.
Results
CDKN3 is differentially expressed among normal, ADC and SCC tissues
Given the contradictory observations on whether CDKN3 tends to be up-regulated or down-regulated in tumors and the possibility of its behavior being context-dependent, we compared the expression levels of CDKN3 among three tissue types: normal, ADC and SCC. We searched the preliminarily-filtered datasets for those with sample size >20 for each of the three types, and Hou et al’s study34 was selected (Table 1, Y† in column “ADC >20 & SCC >20”). In this dataset, by comparing CDKN3 expression across normal, ADC and SCC lung tissues, we found that both ADC and SCC had significantly higher CDKN3 expression levels (Fig. 1), suggesting that CDKN3 is up-regulated in ADC and SCC compared to normal samples. Intriguingly, there was also a drastic difference in CDKN3 expression between ADC and SCC, with SCC significantly higher than ADC.
Figure 1.
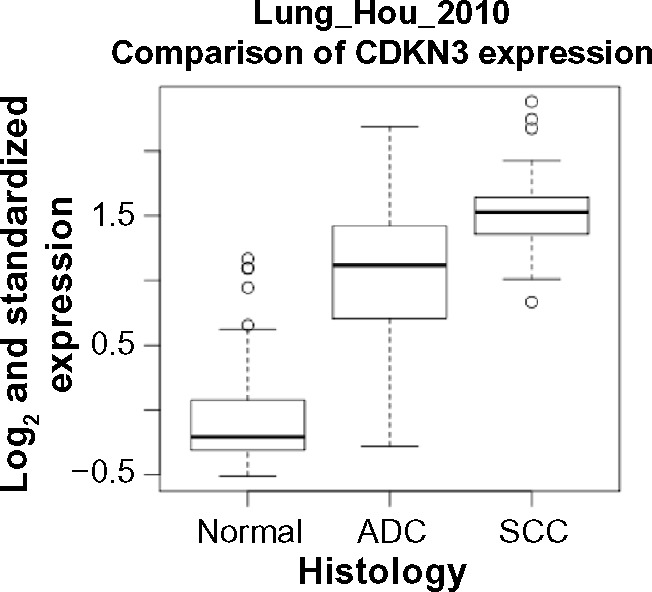
Box plots of CDKN3 expression levels in normal tissues, ADC samples and SCC samples. Comparison among the three groups was made by the commonly used parametric method, one-way ANOVA with Tukey test, as well as a nonparametric method, Kruskal-Wallis test (with pairwise Wilcoxon-Mann-Whitney test). P-values of the pairwise comparisons are less than 0.0001 by both methods. n = 65 for normal, n = 45 for ADC and n = 27 for SCC.
Differential expression of CDKN3 between ADC and SCC is corroborated by meta-analysis
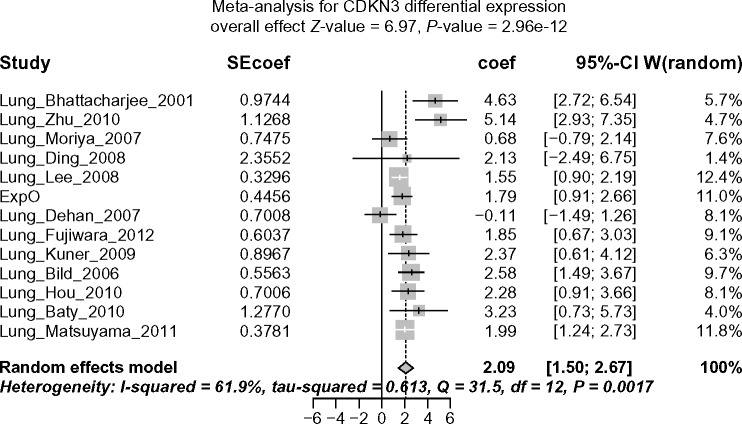
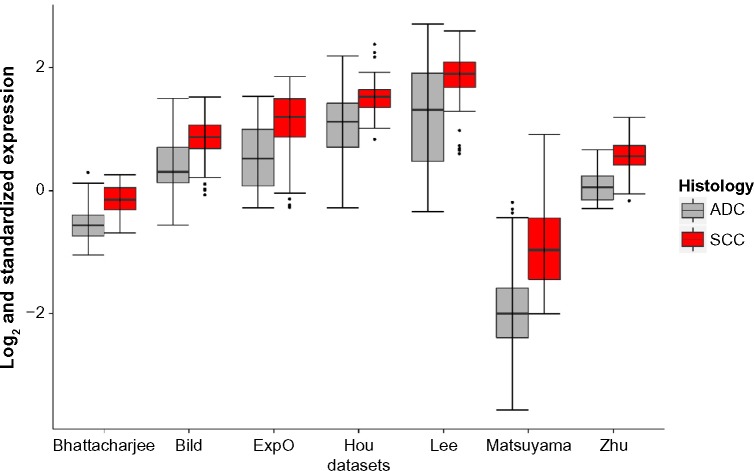
To confirm that higher expression of CDKN3 in SCC compared to ADC was a generalizable observation, we performed a meta-analysis for CDKN3 differential expression. Datasets with both SCC and ADC samples were used in this analysis (Table 1, column “ADC & SCC”). Here, I2 = 61.9% .50% and Cochran’s Q-test P = 0.0017 < 0.10 indicated significant inter-study heterogeneity, and thus the random effects model was used in meta-analysis. The pooled coefficient of 2.09 (95% CI: 1.50–2.67; Z-value = 6.97, P-value < 0.0001) and the corresponding forest plot (Fig. 2A) imply that SCC consistently expressed more CDKN3 than ADC. No significant publication bias was indicated by the Begg’s funnel plot or Egger’s test (Fig. 2B). For a closer look at individual data-sets, we selected seven studies (including the one in Fig. 1) with sample size .20 for both ADC and SCC (Table 1, Y in column “ADC .20 & SCC .20”) and conducted both parametric and nonparametric tests for each dataset, including the two-sample t-test requiring the normality assumption and the Wilcoxon-Mann-Whitney test that is distribution-free. In all seven studies, regardless of which test we used, CDKN3 levels in SCC were significantly higher than those in ADC (Fig. 2C), which is consistent with our result from the meta-analysis.
Figure 2A.
Forest plot displaying the results of the meta-analysis on CDKN3 differential expression, SCC vs ADC. Coef >0 indicates that CDKN3 is expressed at higher level in SCC than in ADC.
Figure 2B.
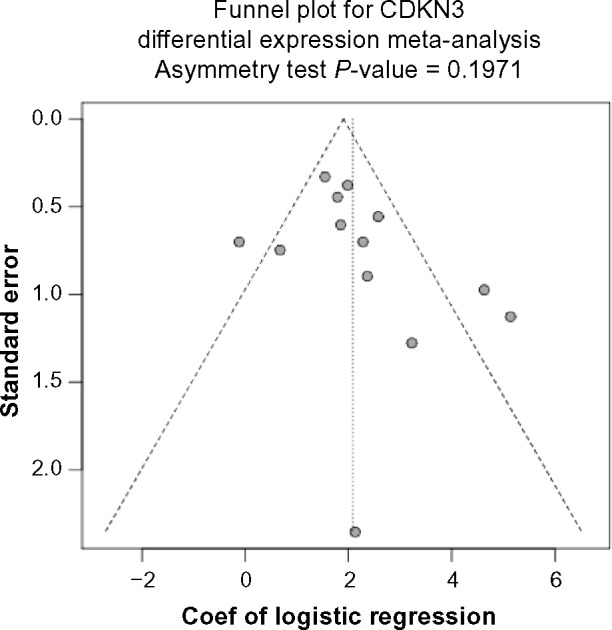
Funnel plot for assessing publication bias. Begg’s funnel plot and Egger’s test show no significant publication bias regarding the meta-analysis for CDKN3 differential expression.
Figure 2C.
Box plots of CDKN3 expression levels in ADC samples and SCC samples. Comparison between the two groups was made by two-sample t-test (a parametric method) and Wilcoxon-Mann-Whitney test (a nonparametric method) in datasets with adequate number of samples. The P-values are less than 0.0001 by both methods for all the seven datasets.
CDKN3 expression is prognostic in ADC but not in SCC
Given the evidently and consistently different expression levels of CDKN3 between ADC and SCC in multiple studies, it is possible, though not necessary, that the pathways interconnected with CDKN3 are in different statuses between ADC and SCC, which may in turn make CDKN3 exhibit entirely distinct behaviors in two such contexts. Under this general hypothesis, we performed two separate survival meta-analyses summarizing the HR of high vs. low CDKN3 expression (median as cutoff), one for ADC and the other for SCC. Datasets including ADC or SCC patients with available survival information are indicated by Y in the ADC+survival column or SCC+survival column of Table 1. In the meta-analysis for ADC, I2 was 0% and Cochran’s test P-value was 0.4578; thus the heterogeneity was negligible and the fixed effect model was used. The pooled HR was 1.65 (95% CI: 1.39–1.96; Z-value = 5.73, P-value < 0.0001) (See Fig. 3A for the forest plot), so CDKN3 expression was associated with poor survival outcomes in ADC. No significant publication bias was indicated by the Begg’s funnel plot or Egger’s test (Fig. 3B).
Figure 3A.
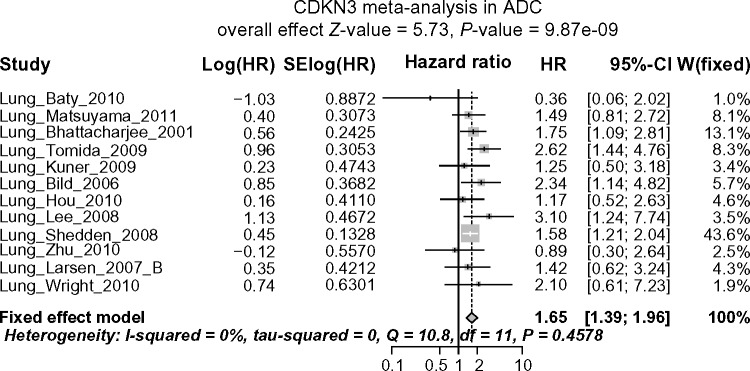
Forest plot displaying the results of the meta-analysis on association between CDKN3 and ADC patient survival. HR >1 means high CDKN3 expression is associated with poor survival outcomes.
Figure 3B.
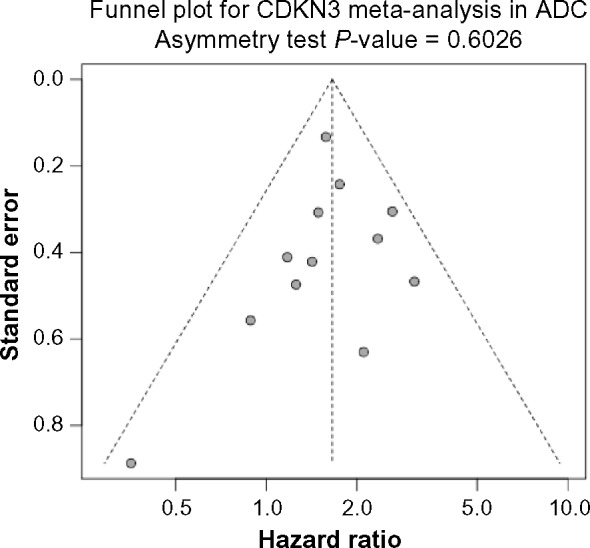
Funnel plot for assessing publication bias. Begg’s funnel plot and Egger’s test show no significant publication bias regarding the meta-analysis for the association between CDKN3 expression and ADC patient survival.
In SCC the heterogeneity is also negligible (I2 = 0% and Cochran’s test P-value = 0.7189), but the result from the meta-analysis based on the fixed effect model was completely different from that of ADC. Instead of being prognostic, no significant association between CDKN3 expression and overall survival was observed in SCC, with pooled HR = 1.10 (95% CI: 0.84–1.44; Z-value = 0.68, P-value = 0.494) (See Fig. 3C for forest plot). Again, no significant publication bias was indicated by the Begg’s funnel plot or Egger’s test (Fig. 3D). The above conclusions remained the same for both ADC and SCC when using the mean instead of the median as the cutoff between high and low CDKN expression (Fig. S1).
Figure 3C.
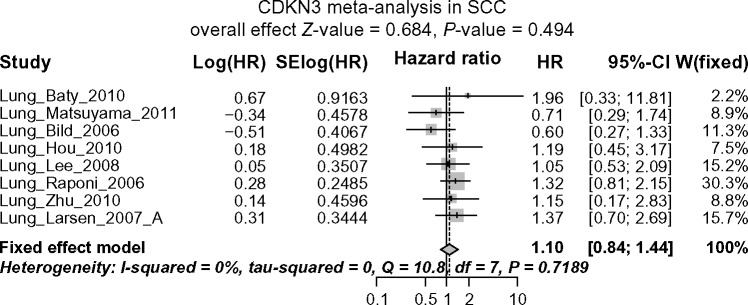
Forest plot displaying the results of the meta-analysis on association between CDKN3 and SCC patient survival. No significant association between CDKN3 expression and overall survival in SCC patients is observed.
Figure 3D.
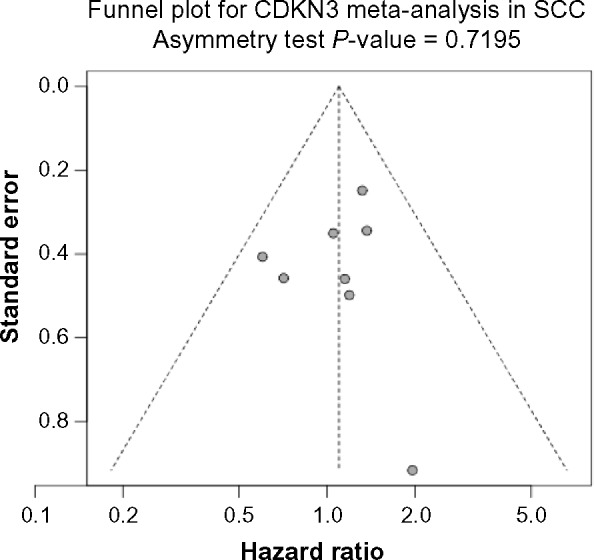
Funnel plot for assessing publication bias. Begg’s funnel plot and Egger’s test show no significant publication bias regarding the meta-analysis for the association between CDKN3 expression and SCC patient survival.
The prognostic value of CDKN3 in ADC was also demonstrated by the Kaplan-Meier plots within individual data-sets (Fig. S2 using median and S5 using mean as the cutoff). Seven and eight out of 12 datasets, respectively, did not show significant survival difference between the two groups. Such inconsistency with the conclusion from the meta-analysis is legitimate, as a meta-analysis has much higher statistical power than any individual study.35 Significant correlation between sample sizes and –log(P-value) implies that low statistical significance in some studies is at least partially due to small sample sizes (Figs. S3 and S6). All the comparisons within the individual datasets showed that there was no significant association between CDKN3 expression and SCC patient survival (Figs. S4 and S7). To summarize the evidence above, CDKN3 expression is a marker for poor survival outcomes in ADC but not in SCC patients.
Discussion
In the present study, we compared CDKN3 expression in ADC and SCC to that of normal lung tissues and found that CDKN3 is up-regulated in those two subtypes of NSCLC, as already reported in studies of several other cancers,22–24 but the mechanism of CDKN3 up-regulation is unclear. It was postulated in prostate cancer that such up-regulation may be explained by chromosomal ablation, because 14q22 is amplified in the PC3 prostate cancer cell line.36,37 However, this may not be the case in ADC or SCC, since no significant chromosomal amplification was found at 14q22 by arrayCGH in SCC or by SNP array in ADC.38,39 In breast cancer cells treated with glutaminase inhibitor, H3K4me3, the histone modification associated with active gene transcription was decreased at several cancer-related genes, including CDKN3.40 If high H3K4me3 can be shown to contribute to up-regulated CDKN3 expression and could also be attenuated by glutaminase inhibition in lung cancer cells, it would add to the validity of glutamine metabolism as a therapeutic target, given that several glutamine metabolism inhibitors are already in clinical trials for treating lung cancer.41 Other potential upstream regulators of CDKN3 expression include nAChRs,42 p21,43 PPARγ,44 DNMTs45,46 and YB-1,47 but more dissection is needed to validate whether they regulate CDKN3 expression in NSCLC and whether such regulation is direct or indirect.
In the comparison of CDKN3 expression, we also observed its differential expression between ADC and SCC. Our meta-analysis further showed that SCC consistently expressed a higher level of CDKN3 than ADC. Motivated by the idea that ADC and SCC are different at the molecular level and thus each subtype may have distinct CDKN3-related behavior, we have investigated the association between CDKN3 and overall survival in ADC and SCC patients separately, and the results suggest that CDKN3 is a marker for poor survival outcomes in ADC, but not in SCC.
To our knowledge, this is the first meta-analysis of the prognostic value of CDKN3. A common practice in meta-analyses is searching the literature for publications regarding a particular topic and summarizing the published effects. One potential pitfall of such an approach is that the results of the meta-analysis may be subject to publication bias.48 For example, since significantly positive results are more likely to be published, if the published studies regarding the prognostic effect of a specific gene are collected for meta-analysis, the effects summarized tend to be biased towards larger effects. On the contrary, the studies included in our lung cancer database have no such bias, and they were included in our meta-analysis as long as genome-wide microarray data of lung cancer was available, regardless of the specific topics the authors investigated and the conclusions they drew. Such meta-analysis based on genome-wide data increases the number of eligible studies and at the same time is less prone to publication bias, as can be seen in Figure 2B, 3B and 3D, thus giving more reliable results than traditional meta-analysis. Nevertheless, our study has limitations. We did not investigate by multivariate Cox models whether CDKN3 is a factor independent of other prognostic indicators such as TNM stages and p53 mutations,12 and further study is needed to answer whether the prognostic value of CDKN3 differs between patient subgroups categorized by age, gender, ethnicity, smoking status, etc., but a potential difficulty of taking more factors into consideration in survival analyses is that fewer studies will be eligible and the number of patients in each group will be smaller, which makes results less stable. Instead, using the demographic and clinical variables available in LCDB, we performed meta-analyses on the association between CDKN3 expression and age, gender and cancer stage within ADC and SCC patients, and none of the analyses showed significant associations (Figs. S8–S10). Smoking status information is only available for three ADC datasets, so only comparisons within individual datasets were conducted (Fig. S11). Two out of three datasets showed positive associations between smoking and CDKN3 expression.
As CDKN3 expression has a higher level in SCC than in ADC, a simple justification for the difference in CDKN3’s prognostic value between the two subtypes is that its expression in SCC patients is so high that its neoplastic effect is almost saturated, while in ADC patients, lower overall expression allows for a larger effect on survival by inter-patient variations in expression. If this were true, we might deduce that SCC patients generally perform worse than ADC patients in terms of overall survival. However, no significant difference in survival outcomes was observed between ADC and SCC (Fig. S12). For the three datasets (Matsuyama, Bild and Lee) with visible separation of survival curves between ADC patients with low CDKN3 expression and ADC patients with high CDKN3 expression, we compared the SCC patient group to ADC patient groups with high and low CDKN3 expression (Fig. S13). In two (Matsuyama and Lee) out of these three datasets, the survival curves of the SCC group tend to coincide with that of high-CDKN3 ADC group and diverge, though not statistically significantly, from that of low-CDKN3 ADC group, while this pattern is not observed in the Bild dataset and the three curves seem to separate from each other visibly. Still, we cannot exclude the possibility that the effect of CDKN3 is different from that in ADC due to some certain unique molecular context of SCC. By showing the cytoplasmic expression of CDKN3 in renal cell carcinoma, Lai et al.25 proposed that proliferation enhancement by CDKN3 could be due to its interaction with and dephosphorylation of unknown cytoplasmic substrates. If this assumption holds, different substrates and interaction partners in SCC and ADC may account for the different prognostic effects of CDKN3. Further study of the biology of CDKN3 under different pathological conditions is needed to identify the dynamics of its interactome. On the other hand, some authors claimed that CDKN3 promotes oncogenesis by its aberrant transcripts49–52; thus it is also possible that SCC and ADC express different transcript variants or mutants of CDKN3.
Cyclin-dependent kinase inhibitor (CDKI) is a family of proteins with high importance in cell cycle control. In addition to CDKN3, other members of CDKI include CDKN1A, CDKN1B, CDKN1C, CDKN2A, CDKN2B, CDKN2C and CDKN2D. Although the vast majority of publications support their function as tumor suppressors, rare adverse observations also exist. For example, in thyroid cancer CDKN2A is upregulated in follicular adenomas, follicular carcinomas and papillary carcinomas compared to normal tissues.53 Additionally, CDKN2D expression was found to be a negative prognostic factor in ovarian cancer patients.54 Further investigations should be conducted to understand the complex functions of CDKI in cancer.
In summary, differential expression of CDKN3 was found across normal tissues, ADC and SCC. Through meta-analysis, we identified CDKN3 to be a prognostic marker predicting poor overall survival outcomes in ADC, which implies that CDKN3 may be valuable as a potential biomarker for prognosis. Given that the effect of CDKN3 in SCC is different from that in ADC, further research into its molecular mechanisms in various lung cancer subtypes is needed.
Supplementary Materials
Figure S1. Same analyses as those of Figure 3AD, except that mean (instead of median) was used as the cutoff between low and high CDKN3 expression.
Figure S2. Kaplan-Meier plots comparing survival curves of low-CDKN3 vs high-CDKN3 ADC patients. (Median as cutoff)
Figure S3. Scatter plot showing the correlation between –log(P-value) and sample sizes in Figure S2 (P-value of correlation < 0.01).
Figure S4. Kaplan-Meier plots comparing survival curves of low-CDKN3 vs high-CDKN3 SCC patients. (Median as cutoff)
Figure S5. Kaplan-Meier plots comparing survival curves of low CDKN3 vs high CDKN3 ADC patients. (Mean as cutoff)
Figure S6. Scatter plot showing the correlation between –log(P-value) and sample sizes in Figure S5 (P-value of correlation < 0.05).
Figure S7. Kaplan-Meier plots comparing survival curves of low CDKN3 vs high CDKN3 SCC patients. (Mean as cutoff)
Figure S8. Meta-analyses showed no significant association between age and CDKN3 expression.
Figure S9. Meta-analyses showed no significant association between gender and CDKN3 expression.
Figure S10. Meta-analyses showed no significant association between cancer stage and CDKN3 expression.
Figure S11. Box plots comparing CDKN3 expressions of current smokers and non-smokers (ADC patients). ***P-value < 0.001 by both t-test and Wilcoxon-Mann- Whitney test; **P-value < 0.001 by t-test and P-value < 0.01 by Wilcoxon-Mann-Whitney test; NS non-significant.
Figure S12. Kaplan-Meier plots comparing survival of SCC vs ADC patients in five datasets for which CDKN3 differential expression between ADC and SCC has been validated in Figure 2C. ExpO and Bhattacharjee datasets were not included here due to lack of survival information.
Figure S13. Datasets in Figure S12 were further dissected by comparing the overall survival of SCC patients vs ADC patients with low CDKN3 expression (ADClow) and ADC patients with high CDKN3 expression (ADChigh); median was used as the cutoff to separate ADClow and ADChigh.
Figure S14. Same analysis as that of Figure S13, except that mean (instead of median) was used as the cutoff between low and high CDKN3 expression.
Table S1. Summary of patient characteristics in each dataset.
Acknowledgments
We would like to thank Jessie Norris for helping us to proofread the manuscript.
Footnotes
ACADEMIC EDITOR: JT Efird, Editor in Chief
FUNDING: This work was supported by NIH grants 5R01CA152301 and 1R01CA172211 and by Cancer Prevention Research Institute of Texas award RP101251. The authors confirm that the funder had no influence over the study design, content of the article, or selection of this journal.
COMPETING INTERESTS: Authors disclose no potential conflicts of interest.
Paper subject to independent expert blind peer review by minimum of two reviewers. All editorial decisions made by independent academic editor. Upon submission manuscript was subject to anti-plagiarism scanning. Prior to publication all authors have given signed confirmation of agreement to article publication and compliance with all applicable ethical and legal requirements, including the accuracy of author and contributor information, disclosure of competing interests and funding sources, compliance with ethical requirements relating to human and animal study participants, and compliance with any copyright requirements of third parties. This journal is a member of the Committee on Publication Ethics (COPE).
Author Contributions
Conceived and designed the experiments: XW, YX, GX, MC. Analyzed the data: XZ, YZ. Wrote the first draft of the manuscript: XZ, XW, YX, GX, MC. Contributed to the writing of the manuscript: YZ. Agree with manuscript results and conclusions: XZ, XW, YX, GX, YZ, MC. Jointly developed the structure and arguments for the paper: XZ, XW, YX. Made critical revisions and approved final version: GX, MC. All authors reviewed and approved of the final manuscript.
REFERENCES
- 1.Siegel R, Ma J, Zou Z, Jemal A. Cancer statistics, 2014. CA: A Cancer Journal for Clinicians. 2014;64(1):9–29. doi: 10.3322/caac.21208. [DOI] [PubMed] [Google Scholar]
- 2.GLOBOCAN 2012 v10, Cancer Incidence and Mortality Worldwide: IARC CancerBase No. 11[Internet] International Agency for Research on Cancer; 2013. [Accessed November 3, 2014]. http://globocan.iarc.fr. [Google Scholar]
- 3.SEER Cancer Statistics Review, 1975–2011. National Cancer Institute; [Accessed November 3, 2014]. based on November 2013 SEER data submission, posted to the SEER web site, April 2014. http://seer.cancer.gov/csr/1975_2011/ [Google Scholar]
- 4.Björkqvist AM, Husgafvel-Pursiainen K, Anttila S, et al. DNA gains in 3q occur frequently in squamous cell carcinoma of the lung, but not in adenocarcinoma. Genes Chromosomes and Cancer. 1998;22(1):79–82. [PubMed] [Google Scholar]
- 5.Cooper WA, Lam DCL, O’Toole SA, Minna JD. Molecular biology of lung cancer. Journal of Thoracic Disease. 2013:S479–90. doi: 10.3978/j.issn.2072-1439.2013.08.03. [DOI] [PMC free article] [PubMed] [Google Scholar]
- 6.Hida T, Yatabe Y, Achiwa H, et al. Increased Expression of Cyclooxygenase 2 Occurs Frequently in Human Lung Cancers, Specifically in Adenocarcinomas. Cancer Research. 1998;58(17):3761–4. [PubMed] [Google Scholar]
- 7.Ceppi P, Volante M, Saviozzi S, et al. Squamous cell carcinoma of the lung compared with other histotypes shows higher messenger RNA and protein levels for thymidylate synthase. Cancer. 2006;107(7):1589–96. doi: 10.1002/cncr.22208. [DOI] [PubMed] [Google Scholar]
- 8.Hanahan D, Weinberg RA. Hallmarks of cancer: the next generation. Cell. 2011;144(5):646–74. doi: 10.1016/j.cell.2011.02.013. [DOI] [PubMed] [Google Scholar]
- 9.Planas-Silva MD, Weinberg RA. The restriction point and control of cell proliferation. Current Opinion in Cell Biology. 1997;9(6):768–72. doi: 10.1016/s0955-0674(97)80076-2. [DOI] [PubMed] [Google Scholar]
- 10.Molinari M. Cell cycle checkpoints and their inactivation in human cancer. Cell proliferation. 2000;33(5):261–74. doi: 10.1046/j.1365-2184.2000.00191.x. [DOI] [PMC free article] [PubMed] [Google Scholar]
- 11.Gabrielli B, Brooks K, Pavey S. Defective cell cycle checkpoints as targets for anti-cancer therapies. Frontiers in pharmacology. 2012;3:9. doi: 10.3389/fphar.2012.00009. [DOI] [PMC free article] [PubMed] [Google Scholar]
- 12.Nikliński J, Niklińska W, Laudanski J, Chyczewska E, Chyczewski L. Prognostic molecular markers in non-small cell lung cancer. Lung Cancer. 2001;34(Supplement 2(0)):S53–8. doi: 10.1016/s0169-5002(01)00345-2. [DOI] [PubMed] [Google Scholar]
- 13.Wikman H, Kettunen E. Regulation of the G1/S phase of the cell cycle and alterations in the RB pathway in human lung cancer. Expert review of anticancer therapy. 2006;6(4):515–30. doi: 10.1586/14737140.6.4.515. [DOI] [PubMed] [Google Scholar]
- 14.Lopez-Beltran A, Luque RJ, Alvarez-Kindelan J, et al. Prognostic factors in stage T1 grade 3 bladder cancer survival: the role of G1-S modulators (p53, p21 Waf1, p27kip1, Cyclin D1, and Cyclin D3) and proliferation index (ki67-MIB1) European urology. 2004;45(5):606–12. doi: 10.1016/j.eururo.2003.11.011. [DOI] [PubMed] [Google Scholar]
- 15.Matsuda Y, Wakai T, Hirose Y, Osawa M, Fujimaki S, Kubota M. p27 Is a critical prognostic biomarker in non-alcoholic steatohepatitis-related hepatocellular carcinoma. International journal of molecular sciences. 2013;14(12):23499–515. doi: 10.3390/ijms141223499. [DOI] [PMC free article] [PubMed] [Google Scholar]
- 16.Demetrick DJ, Matsumoto S, Hannon GJ, et al. Chromosomal mapping of the genes for the human cell cycle proteins cyclin C (CCNC), cyclin E (CCNE), p21 (CDKN1) and KAP (CDKN3) Cytogenetics and cell genetics. 1995;69(3–4):190–2. doi: 10.1159/000133960. [DOI] [PubMed] [Google Scholar]
- 17.Gyuris J, Golemis E, Chertkov H, Brent R. Cdi1, a human G1 and S phase protein phosphatase that associates with Cdk2. Cell. 1993;75(4):791–803. doi: 10.1016/0092-8674(93)90498-f. [DOI] [PubMed] [Google Scholar]
- 18.Hannon GJ, Casso D, Beach D. KAP: a dual specificity phosphatase that interacts with cyclin-dependent kinases. Proceedings of the National Academy of Sciencesof the United States of America. 1994;91(5):1731–5. doi: 10.1073/pnas.91.5.1731. [DOI] [PMC free article] [PubMed] [Google Scholar]
- 19.Poon RY, Hunter T. Dephosphorylation of Cdk2 Thr160 by the cyclin-dependent kinase-interacting phosphatase KAP in the absence of cyclin. Science. 1995;270(5233):90–3. doi: 10.1126/science.270.5233.90. [DOI] [PubMed] [Google Scholar]
- 20.Nalepa G, Barnholtz-Sloan J, Enzor R, et al. The tumor suppressor CDKN3 controls mitosis. The Journal of cell biology. 2013;201(7):997–1012. doi: 10.1083/jcb.201205125. [DOI] [PMC free article] [PubMed] [Google Scholar]
- 21.Chen Q, Chen K, Guo G, et al. A Critical Role of CDKN3 in Bcr-Abl-Mediated Tumorigenesis. PLoS One. 2014;9(10):e111611. doi: 10.1371/journal.pone.0111611. [DOI] [PMC free article] [PubMed] [Google Scholar]
- 22.Xing C, Xie H, Zhou L, et al. Cyclin-dependent kinase inhibitor 3 is overexpressed in hepatocellular carcinoma and promotes tumor cell proliferation. Biochemical and biophysical research communications. 2012;420(1):29–35. doi: 10.1016/j.bbrc.2012.02.107. [DOI] [PubMed] [Google Scholar]
- 23.Espinosa AM, Alfaro A, Roman-Basaure E, et al. Mitosis is a source of potential markers for screening and survival and therapeutic targets in cervical cancer. PLoS One. 2013;8(2):e55975. doi: 10.1371/journal.pone.0055975. [DOI] [PMC free article] [PubMed] [Google Scholar]
- 24.Li T, Xue H, Guo Y, Guo K. CDKN3 is an independent prognostic factor and promotes ovarian carcinoma cell proliferation in ovarian cancer. Oncology reports. 2014;31(4):1825–31. doi: 10.3892/or.2014.3045. [DOI] [PubMed] [Google Scholar]
- 25.Lai MW, Chen TC, Pang ST, Yeh CT. Overexpression of cyclin-dependent kinase-associated protein phosphatase enhances cell proliferation in renal cancer cells. Urologic oncology. 2012;30(6):871–8. doi: 10.1016/j.urolonc.2010.09.010. [DOI] [PubMed] [Google Scholar]
- 26.Allen JD, Wang S, Chen M, et al. Probe mapping across multiple microarray platforms. Briefings in bioinformatics. 2012;13(5):547–54. doi: 10.1093/bib/bbr076. [DOI] [PMC free article] [PubMed] [Google Scholar]
- 27.Hedges LV. Estimation of effect size from a series of independent experiments. Psychological Bulletin. 1982;92(2):490–9. [Google Scholar]
- 28.DerSimonian R Laird N. Meta-analysis in clinical trials. Controlled clinical trials. 1986;7(3):177–88. doi: 10.1016/0197-2456(86)90046-2. [DOI] [PubMed] [Google Scholar]
- 29.Paule RC, Mandel J. Consensus values and weighting factors. Journal of Research of the National Bureau of Standards. 1982;87(5):377–85. doi: 10.6028/jres.087.022. [DOI] [PMC free article] [PubMed] [Google Scholar]
- 30.Brenda C, Wei W, Mary EN. Advances in Collating and Using Trial Data. Future Science Ltd; 2014. Advances in collating and using trial data; pp. 20–36. [Google Scholar]
- 31.Higgins JP, Thompson SG. Quantifying heterogeneity in a meta-analysis. Stat Med. 2002;21(11):1539–58. doi: 10.1002/sim.1186. [DOI] [PubMed] [Google Scholar]
- 32.Sterne JAC, Harbord RM. Funnel plots in meta-analysis. Stata Journal. 2004;4(2):127–41. [Google Scholar]
- 33.Egger M, Davey Smith G, Schneider M, Minder C. Bias in meta-analysis detected by a simple, graphical test. Bmj. 1997;315(7109):629–34. doi: 10.1136/bmj.315.7109.629. [DOI] [PMC free article] [PubMed] [Google Scholar]
- 34.Hou J, Aerts J, den Hamer B, et al. Gene Expression-Based Classification of Non-Small Cell Lung Carcinomas and Survival Prediction. PLOS ONE. 2010;5(4):e10312. doi: 10.1371/journal.pone.0010312. [DOI] [PMC free article] [PubMed] [Google Scholar]
- 35.Borenstein M, Hedges LV, Higgins JPT, Rothstein HR. Introduction to Meta-Analysis. John Wiley & Sons, Ltd; 2009. Why Perform a Meta-Analysis; pp. 9–14. [Google Scholar]
- 36.Lee SW, Reimer CL, Fang L, Iruela-Arispe ML, Aaronson SA. Overexpression of kinase-associated phosphatase (KAP) in breast and prostate cancer and inhibition of the transformed phenotype by antisense KAP expression. Molecular and cellular biology. 2000;20(5):1723–32. doi: 10.1128/mcb.20.5.1723-1732.2000. [DOI] [PMC free article] [PubMed] [Google Scholar]
- 37.Bernardino J, Bourgeois CA, Muleris M, Dutrillaux AM, Malfoy B, Dutrillaux B. Characterization of chromosome changes in two human prostatic carcinoma cell lines (PC-3 and DU145) using chromosome painting and comparative genomic hybridization. Cancer genetics and cytogenetics. 1997;96(2):123–8. doi: 10.1016/s0165-4608(96)00258-0. [DOI] [PubMed] [Google Scholar]
- 38.Boelens MC, Kok K, van der Vlies P, et al. Genomic aberrations in squamous cell lung carcinoma related to lymph node or distant metastasis. Lung Cancer. 2009;66(3):372–8. doi: 10.1016/j.lungcan.2009.02.017. [DOI] [PubMed] [Google Scholar]
- 39.Weir BA, Woo MS, Getz G, et al. Characterizing the cancer genome in lung adenocarcinoma. Nature. 2007;450(7171):893–8. doi: 10.1038/nature06358. [DOI] [PMC free article] [PubMed] [Google Scholar]
- 40.Simpson NE, Tryndyak VP, Pogribna M, Beland FA, Pogribny IP. Modifying metabolically sensitive histone marks by inhibiting glutamine metabolism affects gene expression and alters cancer cell phenotype. Epigenetics: official journal of the DNA Methylation Society. 2012;7(12):1413–20. doi: 10.4161/epi.22713. [DOI] [PMC free article] [PubMed] [Google Scholar]
- 41.Mohamed A, Deng X, Khuri FR, Owonikoko TK. Altered Glutamine Metabolism and Therapeutic Opportunities for Lung Cancer. Clinical Lung Cancer. 2014;15(1):7–15. doi: 10.1016/j.cllc.2013.09.001. [DOI] [PMC free article] [PubMed] [Google Scholar]
- 42.Kalantari-Dehaghi M, Bernard HU, Grando SA. Reciprocal effects of NNK and SLURP-1 on oncogene expression in target epithelial cells. Life sciences. 2012;91(21–22):1122–5. doi: 10.1016/j.lfs.2012.02.004. [DOI] [PMC free article] [PubMed] [Google Scholar]
- 43.Baldi A, Piccolo MT, Boccellino MR, et al. Apoptosis induced by piroxicam plus cisplatin combined treatment is triggered by p21 in mesothelioma. PLoS One. 2011;6(8):e23569. doi: 10.1371/journal.pone.0023569. [DOI] [PMC free article] [PubMed] [Google Scholar]
- 44.Cekanova M, Yuan JS, Li X, Kim K, Baek SJ. Gene alterations by peroxisome proliferator-activated receptor gamma agonists in human colorectal cancer cells. International journal of oncology. 2008;32(4):809–19. [PMC free article] [PubMed] [Google Scholar]
- 45.Yaqinuddin A, Qureshi SA, Qazi R, Abbas F. Down-regulation of DNMT3b in PC3 cells effects locus-specific DNA methylation, and represses cellular growth and migration. Cancer cell international. 2008;8:13. doi: 10.1186/1475-2867-8-13. [DOI] [PMC free article] [PubMed] [Google Scholar]
- 46.Yaqinuddin A, Qureshi SA, Qazi R, Farooq S, Abbas F. DNMT1 silencing affects locus specific DNA methylation and increases prostate cancer derived PC3 cell invasiveness. The Journal of urology. 2009;182(2):756–61. doi: 10.1016/j.juro.2009.03.082. [DOI] [PubMed] [Google Scholar]
- 47.Yu YN, Yip GW, Tan PH, et al. Y-box binding protein 1 is up-regulated in proliferative breast cancer and its inhibition deregulates the cell cycle. International journal of oncology. 2010;37(2):483–92. [PubMed] [Google Scholar]
- 48.Thornton A, Lee P. Publication bias in meta-analysis: its causes and consequences. Journal of clinical epidemiology. 2000;53(2):207–16. doi: 10.1016/s0895-4356(99)00161-4. [DOI] [PubMed] [Google Scholar]
- 49.Yu Y, Jiang X, Schoch BS, Carroll RS, Black PM, Johnson MD. Aberrant splicing of cyclin-dependent kinase-associated protein phosphatase KAP increases proliferation and migration in glioblastoma. Cancer Res. 2007;67(1):130–8. doi: 10.1158/0008-5472.CAN-06-2478. [DOI] [PubMed] [Google Scholar]
- 50.Yeh CT, Lu SC, Chao CH, Chao ML. Abolishment of the interaction between cyclin-dependent kinase 2 and Cdk-associated protein phosphatase by a truncated KAP mutant. Biochemical and biophysical research communications. 2003;305(2):311–4. doi: 10.1016/s0006-291x(03)00757-5. [DOI] [PubMed] [Google Scholar]
- 51.Yeh CT, Lu SC, Chen TC, Peng CY, Liaw YF. Aberrant transcripts of the cyclin-dependent kinase-associated protein phosphatase in hepatocellular carcinoma. Cancer Res. 2000;60(17):4697–700. [PubMed] [Google Scholar]
- 52.Pita JM, Figueiredo IF, Moura MM, Leite V, Cavaco BM. Cell cycle deregulation and TP53 and RAS mutations are major events in poorly differentiated and undifferentiated thyroid carcinomas. The Journal of clinical endocrinology and metabolism. 2014;99(3):E497–507. doi: 10.1210/jc.2013-1512. [DOI] [PubMed] [Google Scholar]
- 53.Ferru A, Fromont G, Gibelin H, et al. The status of CDKN2A alpha (p16INK4A) and beta (p14ARF) transcripts in thyroid tumour progression. Br J Cancer. 2006;95(12):1670–7. doi: 10.1038/sj.bjc.6603479. [DOI] [PMC free article] [PubMed] [Google Scholar]
- 54.Felisiak-Golabek A, Dansonka-Mieszkowska A, Rzepecka IK, et al. p19(INK4d) mRNA and protein expression as new prognostic factors in ovarian cancer patients. Cancer biology & therapy. 2013;14(10):973–81. doi: 10.4161/cbt.25966. [DOI] [PMC free article] [PubMed] [Google Scholar]
- 55.Larsen JE, Pavey SJ, Passmore LH, et al. Expression profiling defines a recurrence signature in lung squamous cell carcinoma. Carcinogenesis. 2007;28(3):760–6. doi: 10.1093/carcin/bgl207. [DOI] [PubMed] [Google Scholar]
- 56.Larsen JE, Pavey SJ, Passmore LH, Bowman RV, Hayward NK, Fong KM. Gene Expression Signature Predicts Recurrence in Lung Adenocarcinoma. Clinical Cancer Research. 2007;13(10):2946–54. doi: 10.1158/1078-0432.CCR-06-2525. [DOI] [PubMed] [Google Scholar]
- 57.Kuner R, Muley T, Meister M, et al. Global gene expression analysis reveals specific patterns of cell junctions in non-small cell lung cancer subtypes. Lung Cancer. 2009;63(1):32–8. doi: 10.1016/j.lungcan.2008.03.033. [DOI] [PubMed] [Google Scholar]
- 58.Bild AH, Yao G, Chang JT, et al. Oncogenic pathway signatures in human cancers as a guide to targeted therapies. Nature. 2006;439(7074):353–7. doi: 10.1038/nature04296. [DOI] [PubMed] [Google Scholar]
- 59.Tomida S, Takeuchi T, Shimada Y, et al. Relapse-related molecular signature in lung adenocarcinomas identifies patients with dismal prognosis. Journal of clinical oncology : official journal of the American Society of Clinical Oncology. 2009;27(17):2793–9. doi: 10.1200/JCO.2008.19.7053. [DOI] [PubMed] [Google Scholar]
- 60.Baty F, Facompre M, Kaiser S, et al. Gene profiling of clinical routine biopsies and prediction of survival in non-small cell lung cancer. American journal of respiratory and critical care medicine. 2010;181(2):181–8. doi: 10.1164/rccm.200812-1807OC. [DOI] [PubMed] [Google Scholar]
- 61.Matsuyama Y, Suzuki M, Arima C, et al. Proteasomal non-catalytic subunit PSMD2 as a potential therapeutic target in association with various clinicopathologic features in lung adenocarcinomas. Molecular carcinogenesis. 2011;50(4):301–9. doi: 10.1002/mc.20632. [DOI] [PubMed] [Google Scholar]
- 62.Bhattacharjee A, Richards WG, Staunton J, et al. Classification of human lung carcinomas by mRNA expression profiling reveals distinct adenocarcinoma subclasses. Proceedings of the National Academy of Sciencesof the United States of America. 2001;98(24):13790–5. doi: 10.1073/pnas.191502998. [DOI] [PMC free article] [PubMed] [Google Scholar]
- 63.Raponi M, Zhang Y, Yu J, et al. Gene expression signatures for predicting prognosis of squamous cell and adenocarcinomas of the lung. Cancer Res. 2006;66(15):7466–72. doi: 10.1158/0008-5472.CAN-06-1191. [DOI] [PubMed] [Google Scholar]
- 64.Shedden K, Taylor JM, Enkemann SA, et al. Gene expression-based survival prediction in lung adenocarcinoma: a multi-site, blinded validation study. Nat Med. 2008;14(8):822–7. doi: 10.1038/nm.1790. [DOI] [PMC free article] [PubMed] [Google Scholar]
- 65.Zhu CQ, Ding K, Strumpf D, et al. Prognostic and predictive gene signature for adjuvant chemotherapy in resected non-small-cell lung cancer. Journal of clinical oncology : official journal of the American Society of Clinical Oncology. 2010;28(29):4417–24. doi: 10.1200/JCO.2009.26.4325. [DOI] [PMC free article] [PubMed] [Google Scholar]
- 66.Girard L, et al. Primary Lung Cancer Specimens. 2011. http://www.ncbi.nlm.nih.gov/geo/query/acc.cgi?acc=GSE31908.
- 67.Jones MH, Virtanen C, Honjoh D, et al. Two prognostically significant subtypes of high-grade lung neuroendocrine tumours independent of small-cell and large-cell neuroendocrine carcinomas identified by gene expression profiles. Lancet. 2004;363(9411):775–1. doi: 10.1016/S0140-6736(04)15693-6. [DOI] [PubMed] [Google Scholar]
- 68.Moriya Y, et al. Gene expression data of primary lung cancer. 2007. http://www.ncbi.nlm.nih.gov/geo/query/acc.cgi?acc=GSE7339.
- 69.Wright CM, Larsen JE, Hayward NK, et al. ADAM28: a potential oncogene involved in asbestos-related lung adenocarcinomas. Genes, chromosomes & cancer. 2010;49(8):688–98. doi: 10.1002/gcc.20779. [DOI] [PubMed] [Google Scholar]
- 70.Ding L, Getz G, Wheeler DA, et al. Somatic mutations affect key pathways in lung adenocarcinoma. Nature. 2008;455(7216):1069–75. doi: 10.1038/nature07423. [DOI] [PMC free article] [PubMed] [Google Scholar]
- 71.Lee ES, Son DS, Kim SH, et al. Prediction of recurrence-free survival in postoperative non-small cell lung cancer patients by using an integrated model of clinical information and gene expression. Clinical cancer research : an official journal of the American Association for Cancer Research. 2008;14(22):7397–404. doi: 10.1158/1078-0432.CCR-07-4937. [DOI] [PubMed] [Google Scholar]
- 72.Curley E, et al. Expression Project for Oncology (expO) 2005. http://www.ncbi.nlm.nih.gov/geo/query/acc.cgi?acc=GSE2109.
- 73.Dehan E, Ben-Dor A, Liao W, et al. Chromosomal aberrations and gene expression profiles in non-small cell lung cancer. Lung Cancer. 2007;56(2):175–84. doi: 10.1016/j.lungcan.2006.12.010. [DOI] [PubMed] [Google Scholar]
- 74.Fujiwara T, Hiramatsu M, Isagawa T, et al. ASCL1-coexpression profiling but not single gene expression profiling defines lung adenocarcinomas of neuroendocrine nature with poor prognosis. Lung Cancer. 2012;75(1):119–25. doi: 10.1016/j.lungcan.2011.05.028. [DOI] [PubMed] [Google Scholar]
Associated Data
This section collects any data citations, data availability statements, or supplementary materials included in this article.
Supplementary Materials
Figure S1. Same analyses as those of Figure 3AD, except that mean (instead of median) was used as the cutoff between low and high CDKN3 expression.
Figure S2. Kaplan-Meier plots comparing survival curves of low-CDKN3 vs high-CDKN3 ADC patients. (Median as cutoff)
Figure S3. Scatter plot showing the correlation between –log(P-value) and sample sizes in Figure S2 (P-value of correlation < 0.01).
Figure S4. Kaplan-Meier plots comparing survival curves of low-CDKN3 vs high-CDKN3 SCC patients. (Median as cutoff)
Figure S5. Kaplan-Meier plots comparing survival curves of low CDKN3 vs high CDKN3 ADC patients. (Mean as cutoff)
Figure S6. Scatter plot showing the correlation between –log(P-value) and sample sizes in Figure S5 (P-value of correlation < 0.05).
Figure S7. Kaplan-Meier plots comparing survival curves of low CDKN3 vs high CDKN3 SCC patients. (Mean as cutoff)
Figure S8. Meta-analyses showed no significant association between age and CDKN3 expression.
Figure S9. Meta-analyses showed no significant association between gender and CDKN3 expression.
Figure S10. Meta-analyses showed no significant association between cancer stage and CDKN3 expression.
Figure S11. Box plots comparing CDKN3 expressions of current smokers and non-smokers (ADC patients). ***P-value < 0.001 by both t-test and Wilcoxon-Mann- Whitney test; **P-value < 0.001 by t-test and P-value < 0.01 by Wilcoxon-Mann-Whitney test; NS non-significant.
Figure S12. Kaplan-Meier plots comparing survival of SCC vs ADC patients in five datasets for which CDKN3 differential expression between ADC and SCC has been validated in Figure 2C. ExpO and Bhattacharjee datasets were not included here due to lack of survival information.
Figure S13. Datasets in Figure S12 were further dissected by comparing the overall survival of SCC patients vs ADC patients with low CDKN3 expression (ADClow) and ADC patients with high CDKN3 expression (ADChigh); median was used as the cutoff to separate ADClow and ADChigh.
Figure S14. Same analysis as that of Figure S13, except that mean (instead of median) was used as the cutoff between low and high CDKN3 expression.
Table S1. Summary of patient characteristics in each dataset.


