

Abstract
Transmission electron microscopy (TEM) can provide ultrastructural information for cells in microbial community samples and phylogenetic information can be recovered via molecular surveys. Here we report an approach to link these datasets by coupling fluorescence in situ hybridization (FISH) with either conventional biological or cryogenic TEM. The method could revolutionize understanding of the organization and functioning of microbial communities in natural systems.
Keywords: Correlative microscopy, CARD-FISH, microbial communities, acid mine drainage, cryo-electron microscopy, conventional electron microscopy, thin sections, Archaea
Cultivation-independent methods such as amplification and sequencing of rRNA genes, fluorescence in situ hybridization (FISH) of organism-specific probes to cells1, community genomics, transcriptomics and proteomics have shown that microbial communities are complex and dynamic, and are constituted of many organisms about which little is known2. However, these approaches provide little insight into community architecture at high resolution or the organization of macromolecules within cells. Methods that directly integrate electron microscopy with molecular biological labeling can potentially bridge these knowledge gaps to provide information about organismal associations and inter-dependencies as well as giving structural information on the organisms themselves. This understanding is essential for the development of ecological principles to describe microbial community behavior3.
FISH is an established method by which cells can be labeled for identification and analysis of spatial distribution patterns. Probes with specificity at the species or higher phylogenetic level, are hybridized to ribosomal RNA and cells visualized by epifluorescence microscopy (see Amann and Fuchs4 for a recent detailed review). This method has been combined with approaches such as microautoradiography5, nanometer-scale secondary ion mass spectrometry (nanoSIMS)6 and immunochemistry7 to provide complementary physiological information. However, no methods have combined FISH with an approach that can provide information about sub-cellular-scale organization and inter-organism associations. Here, we developed a method based on catalyzed reporter deposition fluorescent in situ hybridization (CARD-FISH)8,9 for organism identification in conjunction with two transmission electron microscopy (TEM) imaging techniques. This approach can resolve morphological details and directly document inter-organism interactions.
The combination of FISH with TEM is faced with two competing technical challenges: Exposure to the electron beam causes dose-dependent molecular damage that compromises FISH labeling and FISH preparations damage the ultrastructure to be imaged by TEM. We used two complementary TEM techniques: on the one hand conventional TEM of high pressure frozen, freeze substituted samples allows the study of spatial relationships of community members, but requires sectioning and is prone to sample preparation artifacts (such as shrinking, dissolution and loss of lipids, carbohydrates and subcellular inclusions in general, and the breakage and/or loss of extracellular structures and appendages). For conventional TEM, FISH labeling was done prior to TEM imaging. On the other hand, cryogenic (cryo)-TEM of whole-mount (intact) cells provide artifact-free, high-resolution ultrastructural insights. However, cryo-TEM is limited to thin samples, an obstacle that prevents the holistic, comprehensive study of intact biofilms and tissues. For this EM technique, FISH was carried out after image acquisition. This required in particular the formulation of a protocol optimized to minimize electron dose damage prior to FISH for clear cryo-TEM correlated data. A balance between labeling efficiency and imaging quality had to be struck.
The systems used for method development were isolate cultures of Caulobacter crescentus and microbial biofilm communities growing in acid mine drainage (AMD) solutions7. The Gram-negative, oligotrophic bacterium C. crescentus is a well-studied model organism and ideally suited for the calibration of electron dose and methodology standards. AMD samples contain sufficiently extensive biological diversity (archaea, bacteria and eukaryotes) but limited species richness and tractable biofilm architecture7. The sample preparation methods were optimized for the two TEM techniques employed (Supplementary Fig. 1).
For CARD-FISH and conventional TEM, samples were high-pressure frozen, freeze substituted and embedded in LR White resin (supplementary online information). Ultrathin sections from these blocks were deposited on nickel finder grids which include a grid index system that allows easy correlation of optical and electron microscopy images. A multi-probe CARD-FISH protocol7 (with modifications as described in the Supplementary Information) was then carried out on the resin sections that were subsequently imaged by epifluorescence microscopy and TEM. Captured images were overlaid using image-processing software (Supplementary Information).
For correlative cryo-TEM and CARD-FISH, samples were placed on pre-treated, customized TEM nickel finder grids, cryoplunged, and imaged at low and high magnification. Two-dimensional (2D) projections (images) were acquired from selected areas. Following imaging, the frozen samples were fixed in paraformaldehyde solution while slowly thawing, dehydrated, and subjected to partial enzymatic digestion after buffer exchange (Supplementary Information). The CARD-FISH protocol was subsequently applied, and the grids imaged with a Confocal Laser Scanning Microscope (CLSM) to capture the epifluorescent signals in the same grid areas previously imaged by cryo-TEM. Images were overlaid as described above.
The imaging strategy consisted in the systematic acquisition of paired TEM and fluorescence images from LR white thin sections (Figs. 1a, b) and plunge-frozen samples of C. crescentus cells (Figs. 1d, e). FISH signals were detected after CARD FISH double labeling with general bacterial (EUB33810 in green) and archaeal probes (Arc91511 in red) plus a 4′,6-diamidino-2-phenylindole (DAPI in blue), Figs. 1b, e. All intact C. crescentus cells specifically hybridized with the EUB338 probe (but not the ARC915 archaeal control probe). The quality of conventional TEM images diminished after the FISH labeling (Fig. 1c). However, higher resolution and high quality cryo-TEM images of plunge-frozen C. crescentus cells from the same sample (Figs. 1d–f) reveal characteristic morphological details such as cell wall architecture, the S-layer, and a stalk at a cell pole.
Figure 1.
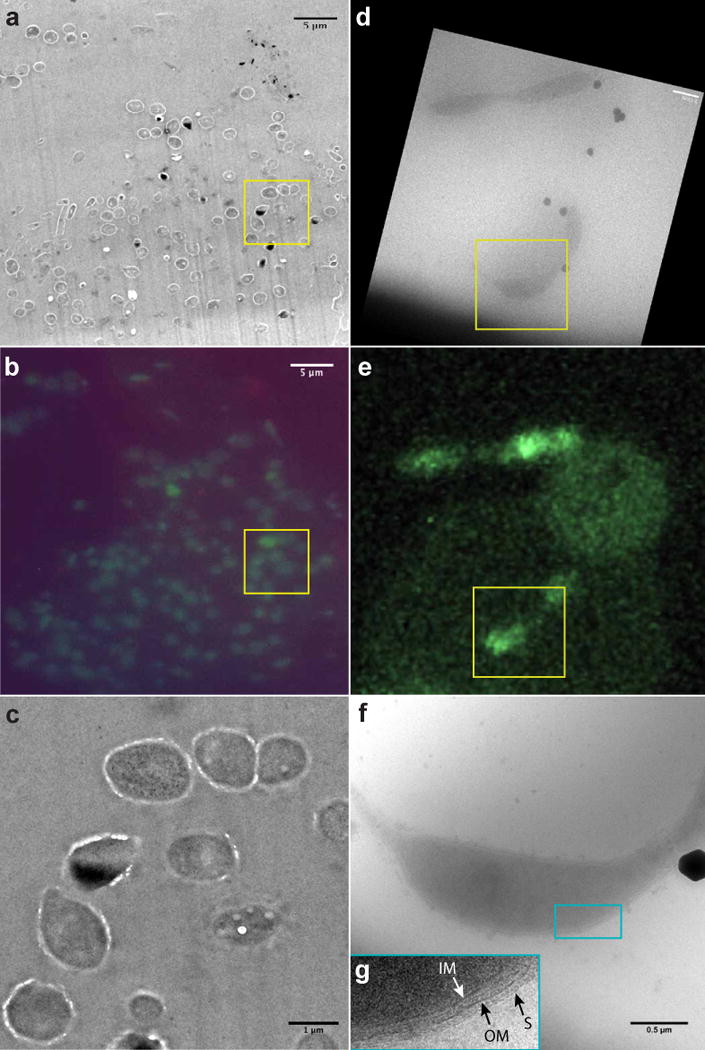
Correlative TEM and FISH of Caulobacter crescentus. (a) TEM image of a typical plastic section from a C. crescentus culture, following application of the FISH protocol. (b) Epifluorescence image of the same area, establishing a direct map of cell identity upon the TEM data. All channels, green (EUB338), red (Arc915), and blue (DAPI) are shown as a control. (c) TEM image of one cell in (a) at a higher magnification, showing the degradation of the TEM quality caused by CARD FISH labeling. (d) Cryo-TEM image of cryosamples prepared from the same cultures used in (a). (e) CARD FISH epifluorescence signal from the same cells in (d) after processing the thawed grid; only the green channel is shown. Reduced FISH signal post cryo-EM imaging requires CLSM high gain settings, resulting in visible background noise. The small circular region with high background noise corresponds to the TEM focusing beam area, and the large circular region to the imaging beam. (f) 15kx magnification image of a single C. crescentus cell for detailed morphology. “S” is S-layer, “IM” and “OM” inner and outer membrane respectively. Inset: magnified view of the region within the blue box, 300 nm in height. Images d) and f) were both obtained before FISH, in this order.
To demonstrate the utility of the combined FISH-TEM method, we imaged a microbial biofilm community (Fig. 2). With the information from the epifluorescence images (Figs. 2b, e and h), we identified bacterial and archaeal cells in TEM images (Figs. 2a, d and g), and were able to map their distribution (Fig. 2c) and assign specific, distinctive morphological features to microorganisms of interest (Figs. 2f and i). The identity, spatial, and coarse ultrastructural information obtained by conventional TEM is augmented with the ultrastructural details obtained by cryo-TEM. Important features of the cell in Fig. 2f include its overall shape and size, characteristic sinusoidal body with a flagellum at one pole, Gram-negative cell wall with clearly resolved inner and outer membranes (IM and OM) and no S-layer, and a dark round subcellular body (most probably polyphosphate). The round archaeal cell in Fig. 2i is bound by a single cytoplasmic membrane and with no attached S-layer. In general, once the species or strain identity is linked to distinct ultrastructural features, the high dose structural cryo-EM work proceeds towards more specific, species-related questions (Supplementary Movie 1).
Figure 2.
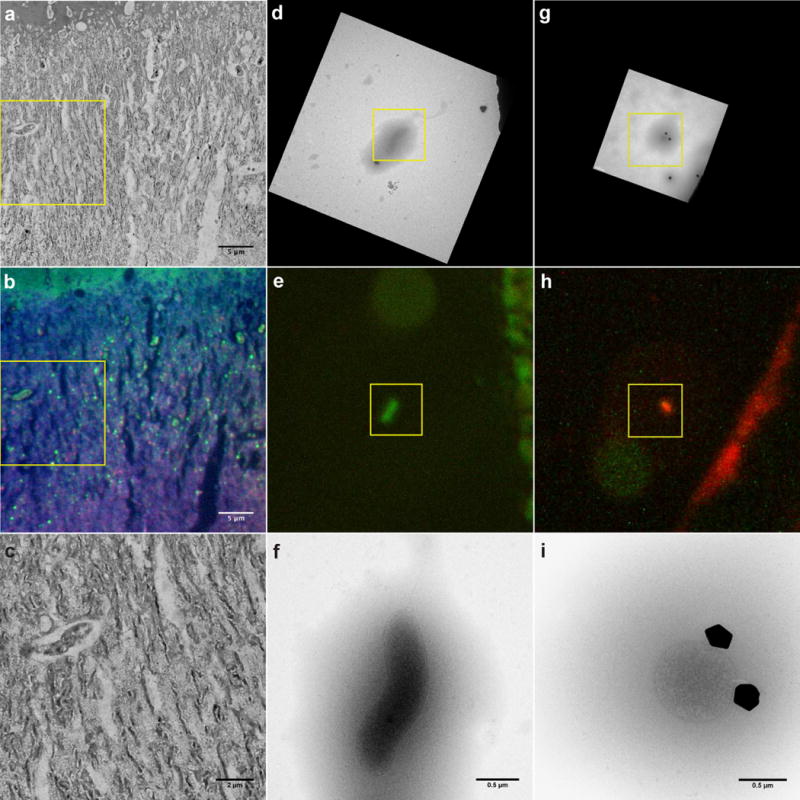
Correlative TEM and FISH of AMD biofilm microbial communities. (a) TEM wide field image of a typical plastic section from high pressure frozen, freeze substituted biofilm. (b) Epifluorescence image of the same area, enabling the direct identification of bacteria (green, labeled with EUB338) and archaea (red, labeled with Arc915) in the TEM image in (a). (c) Magnified region of the TEM image in (a) showing the degradation of the TEM quality caused by CARD FISH labeling. (d) Cryo-TEM overview image of cryosamples obtained from a biofilm, centered on a single bacterial cell. Colloidal gold in cryo-TEM images are used as fiducial markers (black spots). (e) CARD FISH epifluorescence signal from the cell in (d) labeled with the EUB338 probe (green). (f) 15kx magnification cryo-TEM image (obtained before FISH) of the bacterial cell in (d) and (e) showing morphological details. (g) Same as d), but with field of view centered on an archaeal cell (Black irregular shaped bodies are ice crystals). (h) CARD FISH epifluorescence signal from the cell in (g) labeled with the Arc-915 probe (red). (i) 15kx magnification cryo-TEM image of the archaeal cell in (g) and (h) showing its detailed morphology. Single cell images were chosen for simplicity; see Supplementary Information for an extended survey.
The radiation damage to rRNA caused by the electron beam is reflected in the CARD FISH labeling efficiency. Cells imaged at high magnification have weaker FISH signal than cells which were not imaged, Fig. 1e (the dividing C. crescentus cell in the bottom half versus the cell in the top half of the field of view; the unspecific background noise is higher in areas illuminated by TEM). Since there are many fewer ribosomes in thin sections of cells than in the same intact cells used in cryo-TEM samples, the intensity of the FISH signal is considerably lower. This is an additional reason why performing the CARD-FISH procedure prior to TEM is more informative on plastic sections. An electron dose between 0.2 and 0.4 electrons per nm2 (e−nm−2) seemed optimal to obtain excellent cryo-EM images and sufficient CARD-FISH labeling (discussion and calibration in the Supplemental Information). The cells in Figs. 1e, 2e, and 2h (within yellow squares) have been exposed to an electron beam dose of 0.28 e−nm−2, 0.08 e−nm−2, and 0.14 e−nm−2 respectively. In general, the labeling efficiency on the thawed cryogenic samples is better than on thin sections.
Typical cryogenic electron tomography (cryo-ET) of microorganisms usually requires electron doses in the order of 8 to 14 e−nm−2, providing a wealth of structural information. CARD FISH labeling efficiency approaches the detection limit at more than an order of magnitude lower electron dose. However, cryo-TEM low dose 2D projections obtained with the acceptable dose of up to 0.4 e−nm−2 are sufficient to identify and characterize cells in the cryogenic TEM images (see Figs. 1f and 2f and i). How much the CARD FISH labeling is weakened due to the exposure of the cells to the electron beam is system-dependent. Different labeling efficiencies may indicate different ribosomal RNA concentrations which have been linked to differences in activity levels of the cells. Acceptable images that provide strong correlated FISH signals can be acquired in low dose high contrast defocused diffraction mode, which requires about two orders of magnitude fewer electrons than normal imaging modes. Consequently, subsequent matching of cryo-TEM images, cryo-ET, and plastic sections with FISH data provide complete information (dose calibration in Supplementary Information).
In the current study, we demonstrated the feasibility and applicability of the correlative microscopy approach using the phylogenetically highest-level probes to differentiate bacterial and archaeal cells. However, more specific FISH probes could be used to identify bacteria and archaea down to the species or strain level4. Excitingly, the method is not limited to ribosomal RNA and could be used with messenger RNA-targeting probes to provide localized gene expression information12. The thin section and the cryogenic methods should be used in combination. Thin resin sections from high pressure frozen samples provide community structure information across biofilms whereas cryo-TEM provides high-resolution information from single cells, colonies, and can document inter-species interactions13. The approach presented here will facilitate the in-depth study of mixed microbial communities and could be combined with functional techniques such as nanoSIMS and immunochemistry to link “omic” data with ultrastructural information.
METHODS
Methods and any associated references are available in the online version of the paper at http://www.nature.com/naturemethods/.
Supplementary Material
Acknowledgments
This work was supported by the Director, Office of Science, Office of Biological and Environmental Research, of the U.S. Department of Energy under Contracts No. DEAC02-05CH11231 and DEAC03-76SF00098 and Grant DE-FG02- 05ER64134 from the U.S. DOE Genomics: GTL program. B.K. was supported by a Feodor Lynen Research Fellowship provided by the Humboldt Foundation (Germany). Special thanks are due to Susan Spaulding and Daniela Goltsman for help with bioreactor biofilms. We thank Suzan Yilmaz for the generous gift of the fluorescently labeled tyramides, Phil Hugenholtz for helpful discussions, Ken H. Downing for providing access to cryo-EM infrastructure, Roseann Csencsits for cryo-TEM technical assistance, Jan T. Liphardt for providing the CLSM infrastructure, and to Mitalee Desai for help with the image processing.
Footnotes
Author contributions: P.W., B.K., R.I.W., M.A., L.R.C., and J.F.B. designed the research, P.W., B.K., R.I.W. and B.L. developed and performed the CARD-FISH method, B.K., P.W., and R.I.W. prepared the resin samples, L.R.C. and B.L. prepared the cryogenic samples and did the cryogenic EM, P.W., B.L. and B.K. performed the fluorescence microscopy, B.K. conducted the resin section TEM, B.K. and B.L., and L.R.C. prepared the figures. All authors contributed to preparation of the manuscript.
References
- 1.DeLong EF, Wickham GS, Pace NR. Phylogenetic stains: ribosomal RNA-based probes for the identification of single cells. Science. 1989;243:1360–3. doi: 10.1126/science.2466341. [DOI] [PubMed] [Google Scholar]
- 2.Gerard E, Guyot F, Philippot P, Lopez-Garcia P. Fluorescence in situ hybridisation coupled to ultra small immunogold detection to identify prokaryotic cells using transmission and scanning electron microscopy. J Microbiol Methods. 2005;63:20–8. doi: 10.1016/j.mimet.2005.02.018. [DOI] [PubMed] [Google Scholar]
- 3.Battin TJ, et al. Microbial landscapes: new paths to biofilm research. Nat Rev Microbiol. 2007;5:76–81. doi: 10.1038/nrmicro1556. [DOI] [PubMed] [Google Scholar]
- 4.Amann R, Fuchs BM. Single-cell identification in microbial communities by improved fluorescence in situ hybridization techniques. Nat Rev Microbiol. 2008;6:339–48. doi: 10.1038/nrmicro1888. [DOI] [PubMed] [Google Scholar]
- 5.Lee N, et al. Combination of fluorescent in situ hybridization and microautoradiography-a new tool for structure-function analyses in microbial ecology. Appl Environ Microbiol. 1999;65:1289–97. doi: 10.1128/aem.65.3.1289-1297.1999. [DOI] [PMC free article] [PubMed] [Google Scholar]
- 6.Behrens S, et al. Linking microbial phylogeny to metabolic activity at the single-cell level by using enhanced element labeling-catalyzed reporter deposition fluorescence in situ hybridization (EL-FISH) and NanoSIMS. Appl Environ Microbiol. 2008;74:3143–50. doi: 10.1128/AEM.00191-08. [DOI] [PMC free article] [PubMed] [Google Scholar]
- 7.Wilmes P, et al. Natural acidophilic biofilm communities reflect distinct organismal and functional organization. ISME J. 2008 doi: 10.1038/ismej.2008.90. [DOI] [PubMed] [Google Scholar]
- 8.Pernthaler A, Pernthaler J, Amann R. Fluorescence in situ hybridization and catalyzed reporter deposition for the identification of marine bacteria. Appl Environ Microbiol. 2002;68:3094–101. doi: 10.1128/AEM.68.6.3094-3101.2002. [DOI] [PMC free article] [PubMed] [Google Scholar]
- 9.Gros O, Maurin LC. Easy flat embedding of oriented samples in hydrophilic resin (LR White) under controlled atmosphere: application allowing both nucleic acid hybridizations (CARD-FISH) and ultrastructural observations. Acta Histochem. 2008;110:427–31. doi: 10.1016/j.acthis.2007.11.001. [DOI] [PubMed] [Google Scholar]
- 10.Amann RI, et al. Combination of 16S rRNA-targeted oligonucleotide probes with flow cytometry for analyzing mixed microbial populations. Appl Environ Microbiol. 1990;56:1919–25. doi: 10.1128/aem.56.6.1919-1925.1990. [DOI] [PMC free article] [PubMed] [Google Scholar]
- 11.Stahl DA, Amann R. Development and application of nucleic acid probes. In: Stackebrandt E, Goodfellow M, editors. Nucleic acid techniques in bacterial systematics. John Wiley & Sons Ltd; Chichester (England): 1991. pp. 205–248. [Google Scholar]
- 12.Pernthaler A, Amann R. Simultaneous fluorescence in situ hybridization of mRNA and rRNA in environmental bacteria. Appl Environ Microbiol. 2004;70:5426–33. doi: 10.1128/AEM.70.9.5426-5433.2004. [DOI] [PMC free article] [PubMed] [Google Scholar]
- 13.Baker BJ, et al. Enigmatic, ultrasmall, uncultivated Archaea. Proc Natl Acad Sci U S A. 2010;107:8806–11. doi: 10.1073/pnas.0914470107. [DOI] [PMC free article] [PubMed] [Google Scholar]
Associated Data
This section collects any data citations, data availability statements, or supplementary materials included in this article.