Abstract
Background
Several chemicals have been widely used to evaluate the involvement of free Ca2+ in mechanisms underlying a variety of biological responses for decades. Here, we report high reactivity to zinc of well-known Ca2+-sensitive reagents in diverse cultured cells.
Methodology/Principal Findings
In rat astrocytic C6 glioma cells loaded with the fluorescent Ca2+ dye Fluo-3, the addition of ZnCl2 gradually increased the fluorescence intensity in a manner sensitive to the Ca2+ chelator EGTA irrespective of added CaCl2. The addition of the Ca2+ ionophore A23187 drastically increased Fluo-3 fluorescence in the absence of ZnCl2, while the addition of the Zn2+ ionophore pyrithione rapidly and additionally increased the fluorescence in the presence of ZnCl2, but not in its absence. In cells loaded with the zinc dye FluoZin-3 along with Fluo-3, a similarly gradual increase was seen in the fluorescence of Fluo-3, but not of FluoZin-3, in the presence of both CaCl2 and ZnCl2. Further addition of pyrithione drastically increased the fluorescence intensity of both dyes, while the addition of the Zn2+ chelator N,N,N',N'-tetrakis(2-pyridylmethyl)ethane-1,2-diamine (TPEN) rapidly and drastically decreased FluoZin-3 fluorescence. In cells loaded with FluoZin-3 alone, the addition of ZnCl2 induced a gradual increase in the fluorescence in a fashion independent of added CaCl2 but sensitive to EGTA. Significant inhibition was found in the vitality to reduce 3-(4,5-dimethyl-2-thiazolyl)-2,5-diphenyl-2H-tetrazolium bromide in a manner sensitive to TPEN, EDTA and BAPTA in C6 glioma cells exposed to ZnCl2, with pyrithione accelerating the inhibition. Similar inhibition occurred in an EGTA-sensitive fashion after brief exposure to ZnCl2 in pluripotent P19 cells, neuronal Neuro2A cells and microglial BV2 cells, which all expressed mRNA for particular zinc transporters.
Conclusions/Significance
Taken together, comprehensive analysis is absolutely required for the demonstration of a variety of physiological and pathological responses mediated by Ca2+ in diverse cells enriched of Zn2+.
Introduction
A prevailing view is that the excitatory amino acid neurotransmitter L-glutamic acid (Glu) plays a crucial role in neuronal development [1], neuronal plasticity [2] and neuronal cytotoxicity [3,4] through a mechanism relevant to the incorporation of extracellular Ca2+ across cell membranes [5,6] after activation of particular ionotropic receptor subtypes, such as N-methyl-D-aspartate receptor (NMDAR), in the mammalian brain. A large number of probes and reagents have been developed for the purpose to confirm and to validate the possible involvement of intracellular free Ca2+ in a variety of biological phenomena associated with activation of different transmembrane receptors for extracellular signals. For example, Calcium Green-1, Fura-2, Fluo-3, Fura-6F and others have been used to detect free Ca2+ levels in different cells exposed to a variety of extracellular stimuli in vitro [7,8]. An acetoxymethyl (AM) ester of rhodamine-2 (Rhod-2) is able to easily penetrate cellular membranes for the intracellular cleavage of AM ester and subsequent oxidization to Rhod-2 for Ca2+-dependent fluorescence in mitochondrial environments [9,10].
In addition to these fluorescent indicators useful for detecting free Ca2+ levels in different subcellular locations, a membrane permeable AM ester of 1,2-bis(o-aminophenoxy)ethane-N,N,N',N'-tetraacetic acid (BAPTA) has been used to chelate free Ca2+ in the cytoplasm with both membrane-impermeable EDTA and EGTA being a chelator for extracellular free Ca2+ [11]. In contrast, 5-(methylamino)-2-[[(2S,3R,5R,8S,9S)-3,5,9-trimethyl-2-[1-oxo-1-(1H-pyrrol-2-yl)propan-2-yl]-1,7-dioxaspiro[5.5]undecan-8-yl]methyl]-1,3-benzoxazole-4-carboxylic acid (A23187) is believed to create a complex with divalent cations as an ionophore required for the selective entry of extracellular free Ca2+ in diverse cell membranes [12,13].
However, recent studies have shown the potential interaction of the aforementioned fluorescent Ca2+ indicators with other free divalent cations such as Zn2+ in different situations [7,8]. Although free Zn2+ is released from a variety of Zn2+-binding proteins essential for the maintenance of diverse cellular functions and integrities in response to oxidative stress [14–16], emerging evidence is now accumulating for the physiological and pathological significance of Zn2+ in homeostatic functional modulations of the brain. In murine hippocampal slices, Zn2+ is released together with Glu into synaptic clefts in a Ca2+-dependent manner upon stimulation of Schaffer collateral fibers [17]. Activation of ionotropic Glu receptors leads to increased intracellular free Zn2+ levels with high toxicity via channels and transporters for Ca2+ in neurons cultured in the presence of Zn2+ [18–20]. Extracellular Zn2+ is shown to directly and progressively permeate NMDAR channels permeable for Ca2+ [21], in addition to inhibiting the opening of the channels [22,23] through an action site at a particular NMDAR subunit [24]. Moreover, Zn2+ is supposed to play a critical role in the pathogenesis of different neurodegenerative diseases such as Alzheimer’s disease [25] and amyotrophic lateral sclerosis (ALS) [26]. Upregulation of the Ca2+/Zn2+ binding protein S100A6 is similarly seen in astrocytes of autopsied brains from patients with Alzheimer’s disease and ALS [27].
These previous findings prompted us to investigate the specificity of several reagents used for confirming and validating the essential requirement for free Ca2+ in different biological systems for decades, in terms of intracellular mobilization and cellular survival using a variety of cloned lines of cells found in the brain.
Materials and Methods
Materials
Rat astrocytic C6 glioma cells and human embryonic kidney (HEK)-293 cells were purchased from RIKEN Cell Bank (Saitama, Japan). Mouse embryonal carcinoma P19 cells were obtained from ATCC (Manassas, VA, USA). Mouse microglial BV-2 cells are a generous gift from Dr. Eui-Ju Choi (Korea University, Seoul, Korea) [28]. Poly-L-lysine, all-trans retinoic acid (ATRA), Hoechst33342, propidium iodide (PI), A23187, 3-[4,5-dimethylthiazol-2-yl]-2,5-diphenyltetrazolium bromide (MTT), 2-mercaptopyridine N-oxide sodium (pyrithione) and N,N,N’,N’-tetrakis(2-pyridylmethyl)ethylenediamine (TPEN) were purchased from Sigma-Aldrich fine Chemicals (St. Louis, MO, USA). Acetoxymethyl esters of Fluo-3, Rhod-2 and FluoZin-3 were provided by Molecular Probes (Eugene, OR, USA). Both EGTA and BAPTA-AM were supplied by Dojindo (Kumamoto, Japan). Dulbecco’s Modified Eagle Medium (DMEM) and alpha minimal essential medium (αMEM) were provided by Wako (Osaka, Japan). EDTA was purchased from Nacalai Tesque (Kyoto, Japan). Other chemicals used were all of the highest purity commercially available.
Cell culture
Rat astrocytic C6 glioma cells [29], mouse neuroblastoma Neuro2A cells [30] and mouse microglial BV-2 cells [31] were cultured in DMEM supplemented with a 10% fetal bovine serum (FBS) as described elsewhere. Neuro2A cells were subjected to medium change with DMEM supplemented with 2% FBS and 20 μM ATRA for commitment to the neuronal lineage. Mouse embryonal carcinoma P19 cells [32] were cultured in αMEM supplemented with FBS, followed by further culture in the presence of 0.5 μM ATRA for 4 days to promote commitment to the neural lineage under floating conditions and subsequent trypsinization for dispersion. Cultures were always maintained in a humidified atmosphere of 5% CO2 and 95% air at 37°C.
Orchestration of acquired NMDAR channels
In addition to several cell lines described above, we used rat NMDAR subunits cloned into expression vectors to artificially orchestrate membrane receptor channels highly permeable for Ca2+ [33]. The plasmid constructs pcDNAI-GluN2A and pcDNA3.1-GluN1-1a were generous gifts from Dr. Jon W. Johnson (Department of Neuroscience, University of Pittsburgh, PA, USA) [34]. HEK293 cells were grown in DMEM supplemented with 5% FBS before transfection as described previously [35]. Cells were transfected at a 1:3 ratio with GluN1-1a and GluN2A subunit expression vectors by the calcium phosphate method in DMEM with 5% FBS, followed by rinsing with recording medium containing 129 mM NaCl, 4 mM KCl, 1 mM MgCl2, 2 mM CaCl2, 4.2 mM glucose and 10 mM HEPES (pH 7.4).
Fluorescence intensity and imaging
Medium was changed with recording medium once more, followed by incubation with 3 μM Fluo-3 AM for determination of intracellular free Ca2+ levels [33] and/or 3 μM Rhod-2 AM for determination of mitochondrial free Ca2+ levels [10] along with 30 nM Pluronic F-127 and subsequent washing twice for monitoring the individual fluorescence with an interval of 1 min using a confocal laser-scanning microscope (LSM510, Carl Zeiss, Jena, Germany). Fluorescence intensity was normalized after the addition of the Ca2+ ionophore A23187 at 10 μM at the end of each experiment for subsequent quantitative analysis. Fluorescence images with Fluo-3 and Rhod-2 were collected using excitation wavelengths of 488 nm and 543 nm, respectively.
Similarly, cells were loaded with 30 nM Pluronic F-127 and 3 μM FluoZin-3 AM for monitoring the fluorescence intensity using a confocal laser-scanning microscope. The calcium ionophore A23187 was then added at 10 μM to obtain the maximal fluorescence for quantitative normalization. Fluorescence images with FluoZin-3 were collected using an excitation wavelength of 488 nm. The parameters of illumination and detection were digitally controlled to keep the same settings throughout the experiments. For quantitative analysis of A23187 fluorescence, images were invariably quantified using ImageJ software (NIH, Bethesda, MD, USA) as the mean gray value in a visual filed selected at random 3 min after the addition of 10 μM A23187. Excitation and emission wavelengths for each fluorescent probe are as follows: Fluo-3, excitation = 505 nm, emission = 526 nm; Fluo-Zin-3, excitation = 494 nm, emission = 516 nm; Rhod-2, excitation = 552 nm, emission = 578 nm.
Determination of cell viability
Cells were usually exposed to ZnCl2 at different concentrations in the presence of a variety of chemicals for 60 min, followed by further culture for an additional 24 h and subsequent determination of cell viability with MTT reduction assays unless otherwise indicated [33]. In brief, culture medium was replaced with phosphate-buffered saline containing 0.5 mg/ml MTT and incubated for 1 h at 37°C. Cells were then solubilized in a lysis solution containing 99.5% isopropanol and 0.04 M HCl. The amount of MTT formazan product was determined by measuring the absorbance at 550 nm on a microplate reader. Relative values were calculated by percentages over control values obtained in a parallel control experimental group. Cells were also exposed to ZnCl2 for different periods of 10 to 60 min, followed by further culture for an additional period of 0.5 to 24 h for subsequent MTT reduction assays as needed.
Cell viability was also examined by double staining with the membrane-permeable fluorescent dye Hoechst33342 at 10 μg/ml and the membrane-impermeable dye PI at 5 μg/ml for DNA. Cultured cells were washed by culture medium and incubated with both dyes in culture medium for 10 min. Cells were then observed using an epifluorescent microscope (BZ-8100; Keyence, Osaka, Japan). The numbers of cells stained with Hoechst33342 and PI were individually counted in five different visual fields chosen at random per each well, to calculate percentages of PI-positive cells over the total cells stained with Hoechst33342 as an index of dead cells [10].
Real-time based quantitative polymerase chain reaction (qPCR)
Total RNA was extracted from cells, followed by synthesis of cDNA with reverse transcriptase and oligo dT primer. The cDNA samples were then used as templates for real-time qPCR analysis, which was performed on an MX3005P instrument (Agilent Technologies, Santa Clara, CA, USA), by using specific primers for each gene as summarized in Table 1. Expression levels of the genes examined were normalized by using glyceraldehyde-3-phosphate dehydrogenase (GAPDH) expression as an internal control for each sample as described elsewhere [36].
Table 1. Primers used in this study.
| genes | upstream (5' to 3') | downstream (5' to 3') |
|---|---|---|
| GAPDH | AGGTCGGTGTGAACGGATTTG | TGTAGACCATGTAGTTGAGGTCA |
| slc30a1 | TAACACCAGCAATTCCAACG | AGGACGTGCAGAAACACTCC |
| slc30a2 | CTGCCTGGTGTTCATGATTG | CAAGGCTCCAAGGATCTCAG |
| slc30a3 | GAAGAGTCTTTTCACAGAGCCC | TGTGTGCTAAATACCCACCAAC |
| slc30a4 | TGCTGAGGAAAGACGACACG | GCCACCACGACTCGAAGTTTAT |
| slc30a5 | GTGGAGCTAAGCGCCTTCAG | CCATAGCGGGCACATTTGG |
| slc30a6 | TCCTGGCTGTATTTGCTTCTACT | CCAAAAAGCGTTCTGCACTTTC |
| slc30a7 | CAGGCTGGTTTAGGTCCATCC | ATGCCGTAGAGTAGTTCCACA |
| slc30a8 | TGATGCTGCTCATCTCTTAATTG | CTGCTCGATACCACCCAAATG |
| slc30a9 | CATCCTCAACCAATGGAATCCC | TCATTTATGGCAACGAGAAGTGT |
| slc30a10 | TCGAATGTAGCAGGTGATTCC | TCAAACTGGGGTCAATGTAGC |
| slc39a1 | CTGCCATAGATGAGGCCTTG | TCCATCATGCCAATGTTGAG |
| slc39a2 | GGGAGGGACTCATGCCTTTG | GTGGTCCAGTGCCGATCTTC |
| slc39a3 | AGCGGCCTCCCTTTATAGAC | GGCTCTCGTACTCCGAGTC |
| slc39a4 | ATGCTCCCAAAGTCGCTCAC | CAGCGTATTTAACAGGCCGTC |
| slc39a5 | TATCGCATGGATGGTCCTC | CCTTCCTGAAGCAGCATTG |
| slc39a6 | TTGATGCTCGGTCTTGTCTG | AGTGGCACCAAGATGACTCC |
| slc39a7 | TGAATCTGGCTGCTGACTTG | GCAGTCAAGAGTTGCAGACG |
| slc39a8 | CGATCCTGTGTGAGGAGTTTC | TCAGCATGTCGTTCATCTCTG |
| slc39a9 | TGTTGGTGGGATGTTACGTGG | TGCTGCTTTGTCTGATGCAAT |
| slc39a10 | CATAATCGGGTTCACAAACTTGA | GCTTCTCGCTTTCGAGTATGTCG |
| slc39a11 | ACAAGCGTGAGAATGGCGAG | TGGCAGATGCAGTCTTTTCTAC |
| slc39a12 | GACATCTTGGCTTCCACCAG | CAAACTCCTTGGAGCGACAG |
| slc39a13 | CCTGGCTGTGGTATGGCAG | ACTGAGCCCAACCATGAGAGA |
| slc39a14 | CCTCAGGACAATTATGTCTCCA | ATGGTGCTCGTTTTTCTGCTT |
Data Analysis
Results are all expressed as the mean ± S.E. and the statistical significance was determined by the one-way or two-way ANOVA with Bonferroni/Dunnett post hoc test, or the two-tailed Students’ t-test. The level of significance was set at p<0.05.
Results
An increase by Zn2+ in Fluo-3 fluorescence in C6 glioma cells
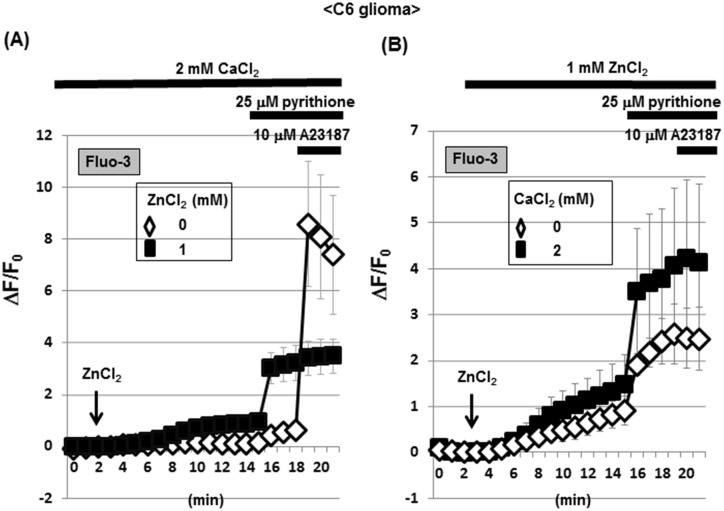
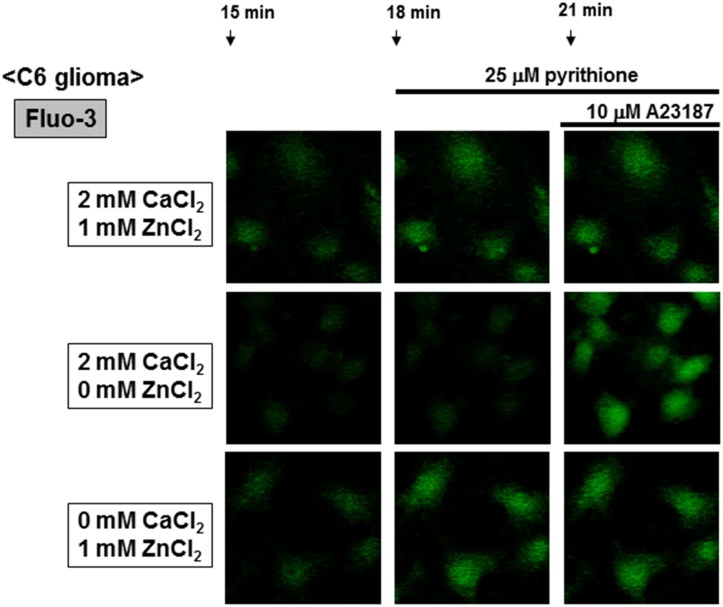
Rat C6 glioma cells were loaded with Fluo-3, followed by addition of 2 mM CaCl2 in either the presence or absence of 1 mM ZnCl2 and subsequent determination of the fluorescence intensity every 1 min. Exposure to ZnCl2 led to a gradual and spontaneous increase in the fluorescence intensity of Fluo-3 in the presence of CaCl2 throughout, while the zinc ionophore pyrithione markedly increased the Fluo-3 fluorescence in the presence of ZnCl2 without affecting that in the absence of ZnCl2 (Figs 1A and 2). Subsequent further addition of the calcium ionophore A23187 failed to additionally increase the fluorescence already elevated by pyrithione in the presence of ZnCl2, but drastically increased the fluorescence in the absence of ZnCl2. In the presence of ZnCl2 throughout, in contrast, a gradual increase was seen in Fluo-3 fluorescence with a drastic increase by pyrithione in a manner irrespective of the addition of CaCl2 (Fig 1B). Subsequent further addition of A23187 again failed to affect Fluo-3 fluorescence independent of the presence of CaCl2.
Fig 1. Effects of ZnCl2 on Fluo-3 fluorescence in C6 glioma cells.
(A) C6 glioma cells were cultured for 24 h, followed by loading of Fluo-3 in the presence of CaCl2 and subsequent determination of the fluorescence intensity in either the presence or absence of ZnCl2 every 1 min for 21 min. (B) Cells were loaded with Fluo-3 in either the presence or absence of CaCl2, followed by determination of the fluorescence intensity in the presence of ZnCl2 every 1 min. Values are the mean±S.E. of the rate of fluorescence change in 3 different experiments.
Fig 2. Micrographic pictures of Fluo-3 fluorescence in C6 glioma cells exposed to CaCl2 and ZnCl2 in the presence of A23187 and pyrithione.
Typical pictures are shown here.
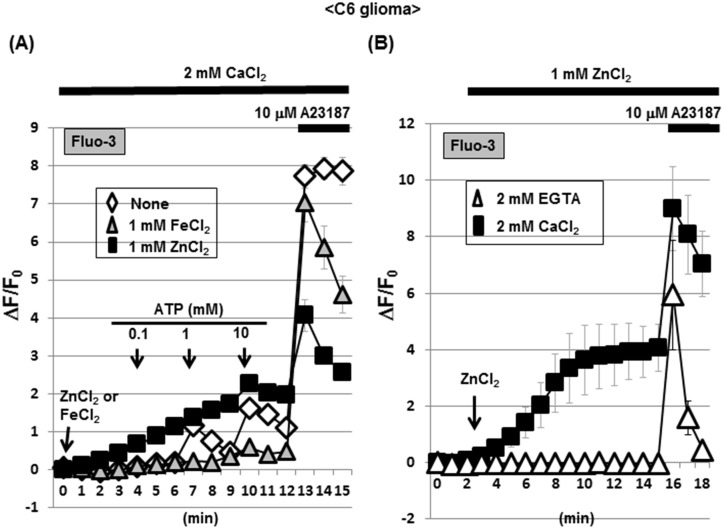
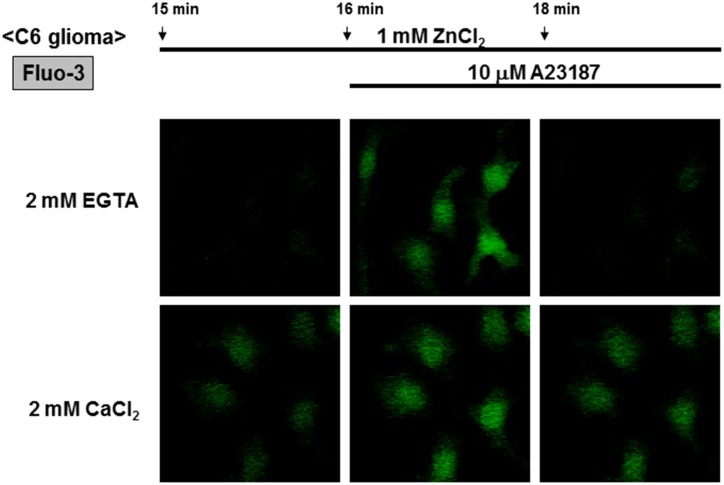
The addition of ATP did not markedly affect Fluo-3 fluorescence in C6 glioma cells known to constitutively express different ionotropic P2X receptor subtypes permeable for Ca2+ [37], while Fluo-3 fluorescence was again gradually increased in cells exposed to ZnCl2, but not to FeCl2, in the presence of CaCl2 (Fig 3A). Further addition of A23187 invariably increased Fluo-3 fluorescence irrespective of the exposure to FeCl2 and ZnCl2. In the presence of ZnCl2 throughout, further addition of CaCl2 led to a gradual increase in Fluo-3 fluorescence in a manner sensitive to the calcium chelator EGTA (Figs 3B and 4). In the presence of EGTA, however, A23187 induced a transient increase in Fluo-3 fluorescence along with a rapid decline to the basal level.
Fig 3. A selective increase by ZnCl2 in Fluo-3 fluorescence in C6 glioma cells.
(A) Cells were loaded with Fluo-3 in the presence of CaCl2, followed by determination of the fluorescence intensity in either the presence or absence of ZnCl2 and FeCl2 every 1 min. Cells were exposed to ATP at different concentrations during the determination of fluorescence. (B) Cells were loaded with Fluo-3 in the presence of either EGTA or CaCl2, followed by determination of the fluorescence intensity in the presence of ZnCl2 every 1 min. Values are the mean±S.E. of the rate of fluorescence change in 3 different experiments.
Fig 4. Micrographic pictures of Fluo-3 fluorescence in C6 glioma cells exposed to CaCl2 and ZnCl2 in the presence of A23187 and EGTA.
Typical pictures are shown here.
An increase by Zn2+ in Rhod-2 and FluoZin-3 fluorescence in C6 glioma cells
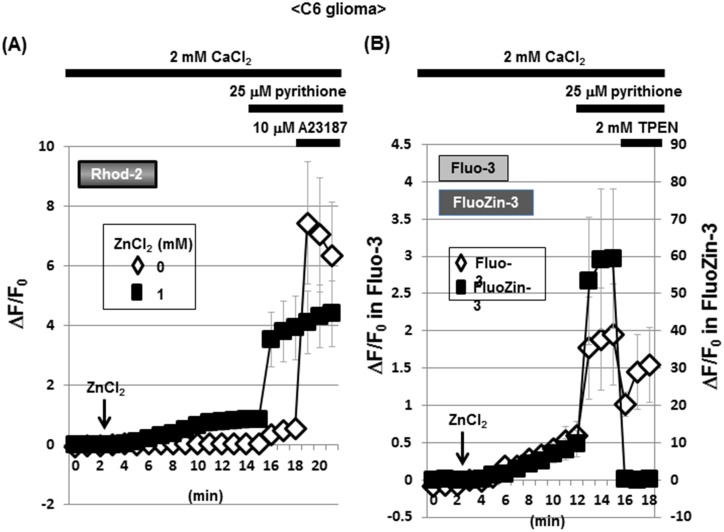
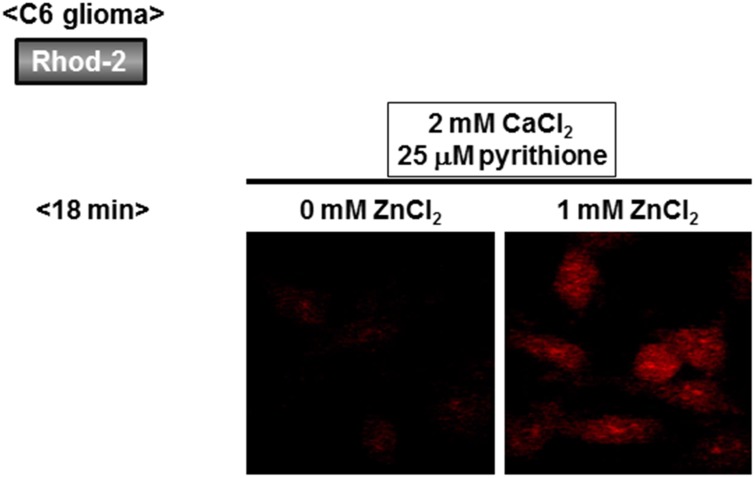
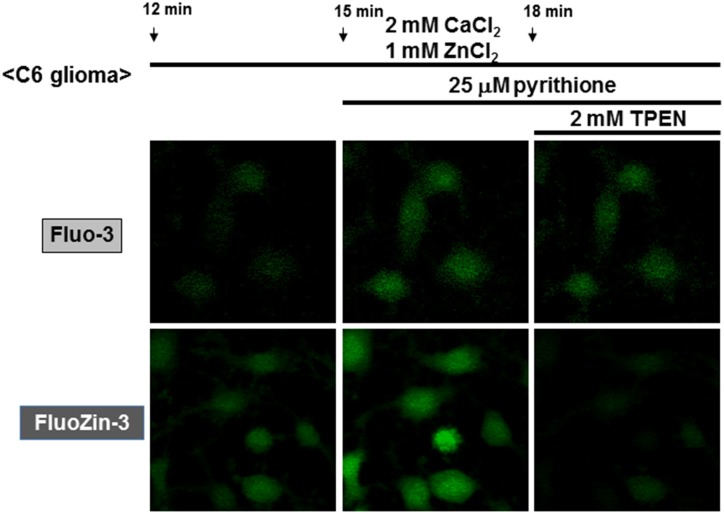
The Ca2+-sensitive fluorescent dye Rhod-2 is known to be accumulated into mitochondria due to its high cationic charge, with the fluorescence being predominantly detected in intracellular areas merged with MitoTracker fluorescence [10]. C6 glioma cells were thus loaded with Rhod-2, followed by exposure to CaCl2 in either the presence or absence of ZnCl2 and subsequent addition of pyrithione and A23187. In the absence of ZnCl2, A23187 markedly increased Rhod-2 fluorescence with pyrithione being ineffective in the presence of 2 mM CaCl2 throughout (Figs 5A and 6). In the presence of both ZnCl2 and CaCl2, in contrast, a spontaneous gradual increase was seen in Rhod-2 fluorescence with a drastic increase by pyrithione in a manner irrespective of the addition of A23187. We next used the Zn2+-sensitive fluorescent dye FluoZin-3 for monitoring intracellular Zn2+ levels, in addition to Fluo-3, in cultured glioma cells. In the presence of both CaCl2 and ZnCl2, a spontaneous gradual increase was similarly seen in the fluorescence of both fluorescent dyes (Figs 5B and 7). Although pyrithione similarly induced a drastic increase in both Fluo-3 and FluoZin-3 fluorescence, the Zn2+ chelator TPEN was highly effective in inhibiting FluoZin-3 fluorescence without affecting Fluo-3 fluorescence.
Fig 5. Possible interaction of Ca2+-sensitive dyes with Zn2+ in C6 glioma cells.
(A) C6 glioma cells were loaded with Rhod-2 in the presence of CaCl2, followed by determination of the fluorescence intensity in either the presence or absence of ZnCl2 every 1 min. (B) Cells were loaded with either Fluo-3 or FluoZin-3 in the presence of CaCl2, followed by determination of the fluorescence intensity in the presence of ZnCl2 every 1 min. Values are the mean±S.E. of the rate of fluorescence change in 3 different experiments.
Fig 6. Micrographic pictures of Rhod-2 fluorescence in C6 glioma cells exposed to CaCl2 and ZnCl2 in the presence of pyrithione.
Typical pictures are shown here.
Fig 7. Micrographic pictures of both Fluo-3 and FluoZin-3 fluorescence in C6 glioma cells exposed to CaCl2 and ZnCl2 in the presence of pyrithione and TPEN.
Typical pictures are shown here.
A selective increase by Zn2+ in FluoZin-3 fluorescence in C6 glioma cells
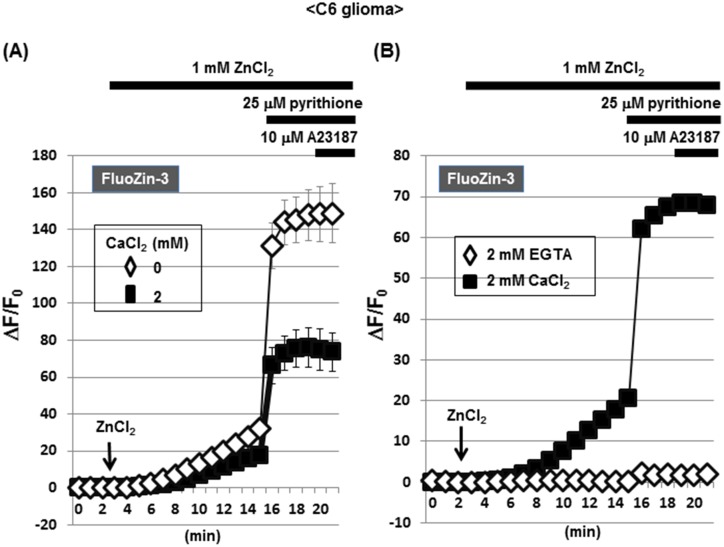
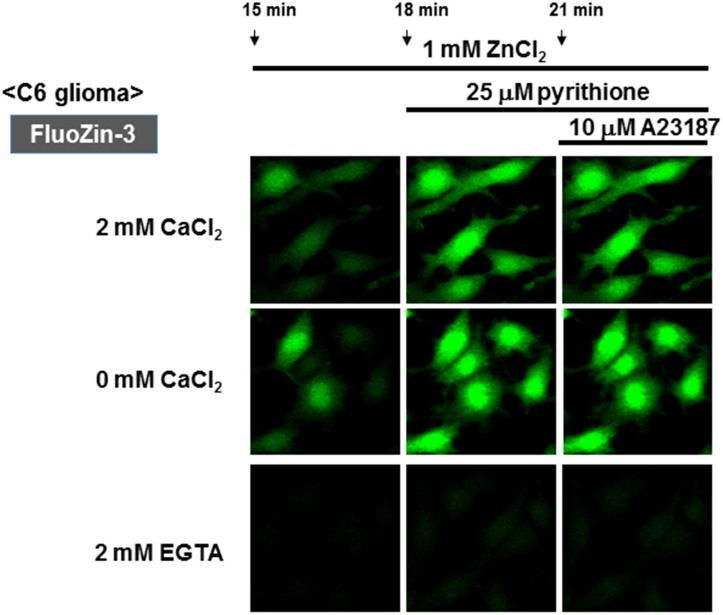
Glioma cells were loaded with FluoZin-3, followed by exposure to ZnCl2 in either the presence or absence of CaCl2. Irrespective of the addition of CaCl2, a spontaneous gradual increase was invariably seen in FluoZin-3 fluorescence along with a drastic increase by pyrithione (Figs 8A and 9). Further addition of A23187 failed to additionally increase FluoZin-3 fluorescence elevated by pyrithione irrespective of the addition of CaCl2. In the presence of EGTA, however, exposure to ZnCl2 did not induce a spontaneous gradual increase in FluoZin-3 fluorescence with both pyrithione and A23187 being ineffective (Fig 8B).
Fig 8. Effects of ZnCl2 on FluoZin-3 fluorescence in C6 glioma cells.
(A) C6 glioma cells were loaded with FluoZin-3 in either the presence or absence of CaCl2, followed by determination of the fluorescence intensity in the presence of ZnCl2 every 1 min. (B) Cells were loaded with FluoZin-3 in the presence of either EGTA or CaCl2, followed by determination of the fluorescence intensity in the presence of ZnCl2 every 1 min. Values are the mean±S.E. of the rate of fluorescence change in 3 different experiments.
Fig 9. Micrographic pictures of FluoZin-3 fluorescence in C6 glioma cells exposed to CaCl2 and ZnCl2 in the presence of A23187 and pyrithione.
Typical pictures are shown here.
Artificial NMDAR channels permeable for Ca2+ in HEK293 cells
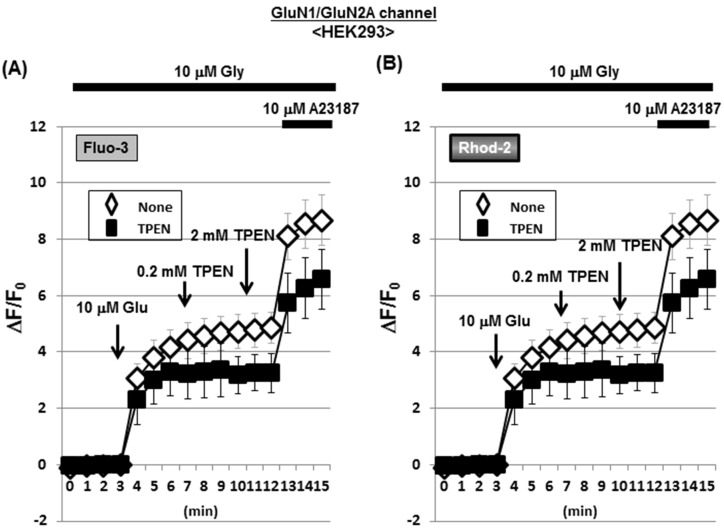
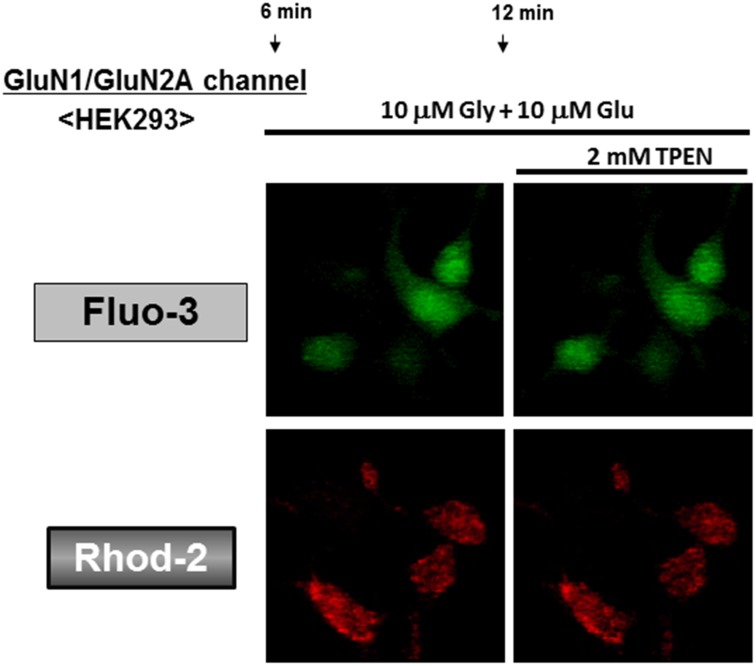
To test the selectivity of the zinc chelator TPEN for Zn2+, we artificially orchestrated acquired NMDAR channels highly permeable for Ca2+ in HEK293 cells devoid of any NMDAR subunits [33]. As both Glu and glycine (Gly) are inevitably required for the opening of NMDAR channels, HEK293 cells were transfected with both GluN1 and GluN2A subunit expression vectors, followed by loading of both Fluo-3 and Rhod-2, and subsequent exposure to Glu in the presence of Gly. The addition of Gly alone did not markedly increase the fluorescence of Fluo-3 (Fig 10A) and Rhod-2 (Fig 10B) in cells with artificial NMDAR channels, while further addition of Glu markedly increased both Fluo-3 and Rhod-2 fluorescence in a manner insensitive to TPEN at concentrations of 0.2 and 2 mM (Fig 11). Consequential further addition of A23187 drastically increased both Fluo-3 and Rhod-2 fluorescence in the presence of both Glu and Gly independent of the addition of TPEN.
Fig 10. Effects of TPEN on Fluo-3 and Rhod-2 fluorescence in HEK293 cells with acquired NMDAR channels.
HEK293 cells were transfected with expression vectors of GluNR1 and GluNR2A, followed by further culture for an additional 24 h and subsequent loading of either (A) Fluo-3 or (B) Rhod-2 in the presence of Gly. Cells were then exposed to Glu in either the presence or absence of TPEN during the determination of each fluorescence intensity every 1 min. Values are the mean±S.E. of the rate of fluorescence change in 3 different experiments.
Fig 11. Micrographic pictures of both Fluo-3 and FluoZin-3 fluorescence in HEK293 cells with artificial NMDAR.
Typical pictures are shown here.
Inhibition by Zn2+ of cellular vitality in C6 glioma cells
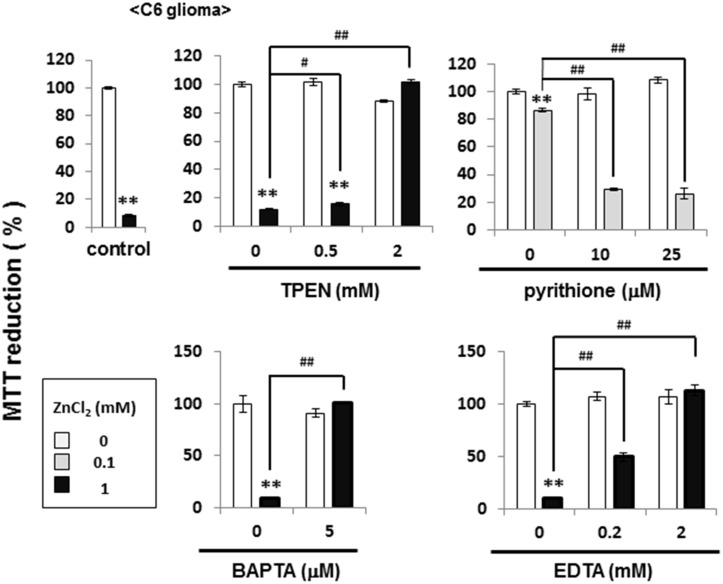
C6 glioma cells were exposed to ZnCl2 for 1 h, followed by further culture for an additional 24 h and subsequent determination of MTT reducing activity as an index of cellular vitality. Exposure to 1 mM ZnCl2 led to more than 80% inhibition of MTT reduction (Fig 12, upper left panel), while TPEN significantly prevented the inhibition by 1 mM ZnCl2 in a concentration-dependent manner at concentrations of 0.5 to 2 mM (Fig 12, upper middle panel). In contrast, pyrithione was effective at concentrations of 10 to 25 μM in significantly exacerbating the inhibition by 0.1 mM ZnCl2 of MTT reduction (Fig 12, upper right panel). In a manner similar to the Zn2+ chelator TPEN, a significant prevention was seen for the inhibition by 1mM ZnCl2 in the presence of BAPTA (Fig 12, lower left panel) and EDTA (Fig 12, lower right panel), which have been used as intracellular and extracellular Ca2+ chelators for years, respectively.
Fig 12. Effects of ZnCl2 on MTT reducing activity in C6 glioma cells.
Cells were exposed to ZnCl2 at different concentrations in either the presence or absence of TPEN, pyrithione, BAPTA and EDTA for 1 h, followed by culture for an additional 6 h and subsequent determination of MTT reducing activity. Values are the mean±S.E. of percentages over the maximal activity detected in cells not exposed to any test chemicals in 3 different experiments. *P<0.05, **P<0.01, significantly different from the control value in cells not exposed to ZnCl2. #P<0.05, #P<0.01, significantly different from the value in cells exposed to ZnCL2 at each concentration.
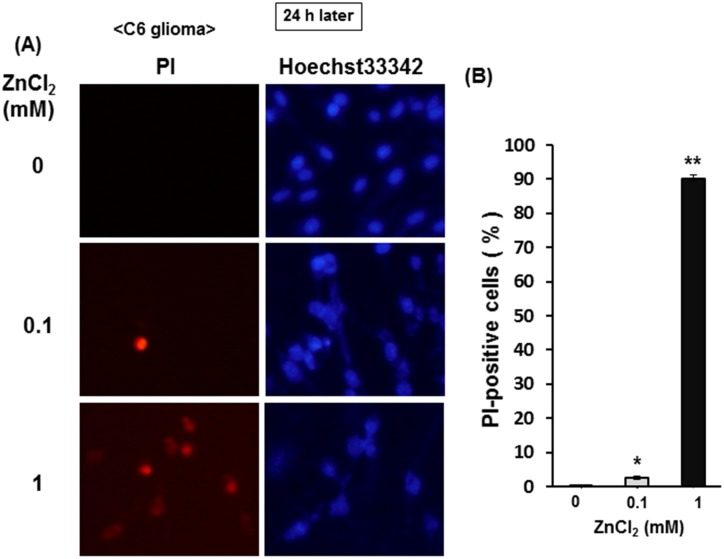
The percentage of injured cells stained with the membrane-impermeable DNA dye PI was markedly increased over the total cells stained with membrane-permeable DNA dye Hoechst33342 in cells exposed to ZnCl2 in a concentration-dependent manner, whereas the number of cell stained with Hoechst33342 was drastically decreased in cultured cells previously exposed to 1 mM ZnCl2 for 1 h when observed 24 h after exposure (Fig 13A). Quantitative analysis clearly revealed that more than 90% of cells were stained with PI in C6 glioma cells exposed to 1 mM ZnCl2 for 1 h when calculated 24 h later (Fig 13B).
Fig 13. Effects of ZnCl2 on PI and Hoechst33342 staining in C6 glioma cells.
Cells were exposed to ZnCl2 at concentrations of 0.1 to 1 mM in the presence of CaCl2 for 1 h, followed by culture for an additional 24 h and subsequent double staining with PI and Hoechst33342 for nuclear DNA. Typical micrographs are shown in the panel (A), while in the panel (B) value are the mean±S.E. of percentages of PI-positive cells over Hoechst33342-positive cells in 3 independent experiments. *P<0.05, **P<0.01, significantly different from the control value in cells not exposed to ZnCl2.
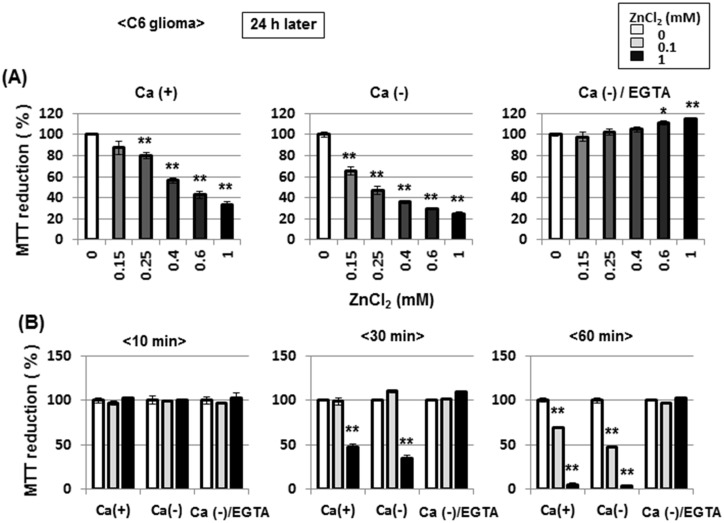
Cells were next exposed to ZnCl2 at different concentrations of 0.15 to 1 mM for 60 min in either the presence or absence of CaCl2 and EGTA, followed by further culture for an additional 24 h and subsequent determination of MTT reducing activity. Exposure to ZnCl2 for 60 min induced a concentration-dependent inhibition of MTT reduction determined 24 h later in a fashion irrespective of the addition of CaCl2, whereas further addition of 2 mM EGTA completely prevented the inhibition by ZnCl2 in the absence of CaCl2 (Fig 14A). Prior exposure to ZnCl2 for 10 min did not significantly affect MTT reduction independent of the addition of CaCl2 and EGTA when determined 24 h after exposure, while a significant inhibition of MTT reduction was found in cells exposed to ZnCl2 for 30 to 60 min irrespective of the addition of CaCl2 (Fig 14B). In cells with further addition of EGTA along with removal of CaCl2, ZnCl2 failed to significantly inhibit MTT reduction at concentrations of 0.1 to 1 mM.
Fig 14. Effects of EGTA on ZnCl2-induced inhibition of MTT reducing activity in C6 glioma cells.
(A) Cells were exposed to ZnCl2 at concentrations of 0.15 to 1 mM in either the presence or absence of CaCl2 and EGTA for 1 h, followed by culture for an additional 24 h and subsequent determination of MTT reducing activity. (B) Cells were also exposed to ZnCl2 at 0.1 or 1 mM in either the presence or absence of CaCl2 and EGTA for different periods from 10 to 60 min, followed by culture for an additional 24 h and subsequent determination of MTT reducing activity. Values are the mean±S.E. of percentages over the maximal activity detected in cells not exposed to any test chemicals in 3 different experiments. *P<0.05, **P<0.01, significantly different from the control value in cells not exposed to ZnCl2.
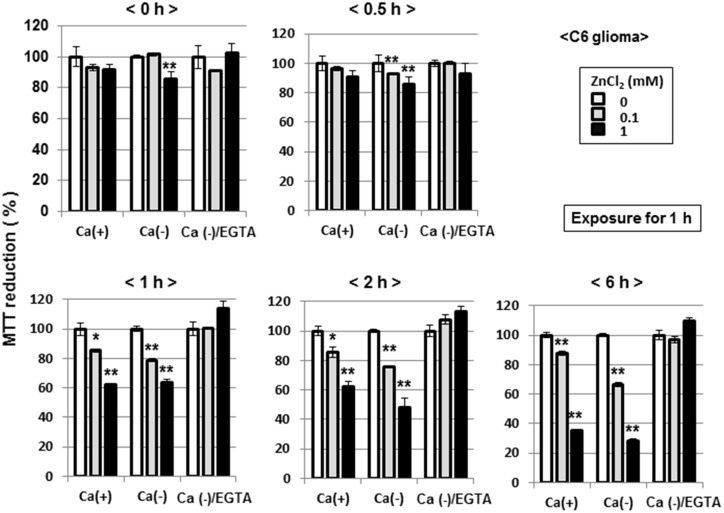
C6 glioma cells were exposed to ZnCl2 at 0.1 or 1 mM for 1 h, followed by further culture for an additional period of up to 6 h and subsequent determination of MTT reduction. No significant inhibition of MTT reduction was seen in cells collected immediately (Fig 15, upper left panel) and 30 min (Fig 15, upper right panel) after the exposure to ZnCl2 for 1 h in a manner independent of the addition of CaCl2 and EGTA. In cells collected 1 (Fig 15, lower left panel), 2 (Fig 15, lower middle panel) and 6 h (Fig 15, lower right panel) after the exposure to ZnCl2 for 1 h, by contrast, a significant inhibition of MTT reduction was induced in a fashion irrespective of the addition of CaCl2, but in a manner prevented by EGTA.
Fig 15. Effects of culture periods on ZnCl2-induced inhibition of MTT reducing activity in C6 glioma cells.
Cells were exposed to ZnCl2 at 0.1 or 1 mM in either the presence or absence of CaCl2 and EGTA for 1 h, followed by culture for an additional periods from 0.5 to 6 h and subsequent determination of MTT reducing activity. Values are the mean±S.E. of percentages over the maximal activity detected in cells not exposed to any test chemicals in 3 different experiments. *P<0.05, **P<0.01, significantly different from the control value in cells not exposed to ZnCl2.
Inhibition by Zn2+ of cellular vitality in other cell lines
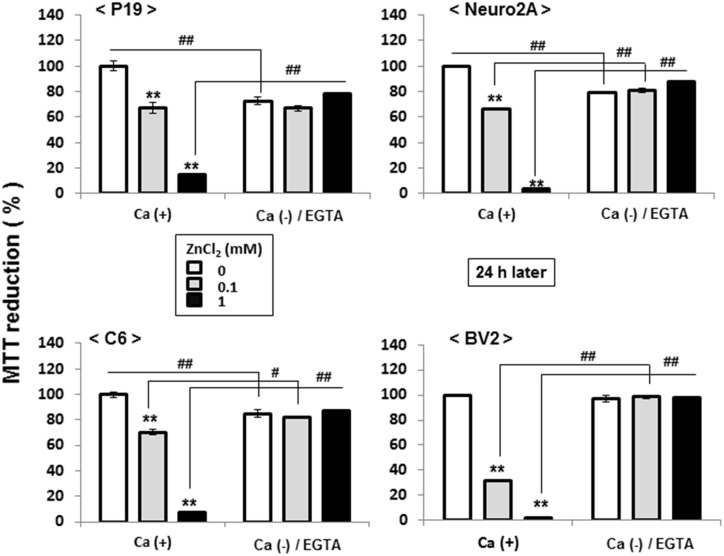
In addition to astrocytic C6 glioma cells, pluripotent P19 cells, neuronal Neuro2A cells and microglial BV2 cells were individually exposed to ZnCl2 at 0.1 or 1 mM for 1 h in either the presence or absence of CaCl2 and EGTA, followed by further culture for an additional 24 h and subsequent determination of MTT reduction. In these parallel experiments, ZnCl2 was invariably effective in significantly inhibiting MTT reduction in the presence of CaCl2 in a concentration-dependent manner in P19 (Fig 10, upper left panel), Neuro2A (Fig 16, upper right panel), C6 (Fig 16, lower left panel) and BV2 (Fig 16, lower right panel) cells, which was never seen in cultured cells additionally exposed to EGTA in the absence of CaCl2 irrespective of the types of cell lines used.
Fig 16. Effects of ZnCl2 on MTT reducing activity in different cell lines.
Cells were exposed to ZnCl2 at 0.1 or 1 mM in either the presence or absence of CaCl2 and EGTA for 1 h, followed by culture for an additional 24 h and subsequent determination of MTT reducing activity. Values are the mean±S.E. of percentages over the maximal activity detected in cells not exposed to any test chemicals in 3 different experiments. *P<0.05, **P<0.01, significantly different from the control value in cells not exposed to ZnCl2. #P<0.05, #P<0.01, significantly different from the value in cells exposed to ZnCL2 at each concentration.
Expression profiles of Zn2+ transporters in different cell lines
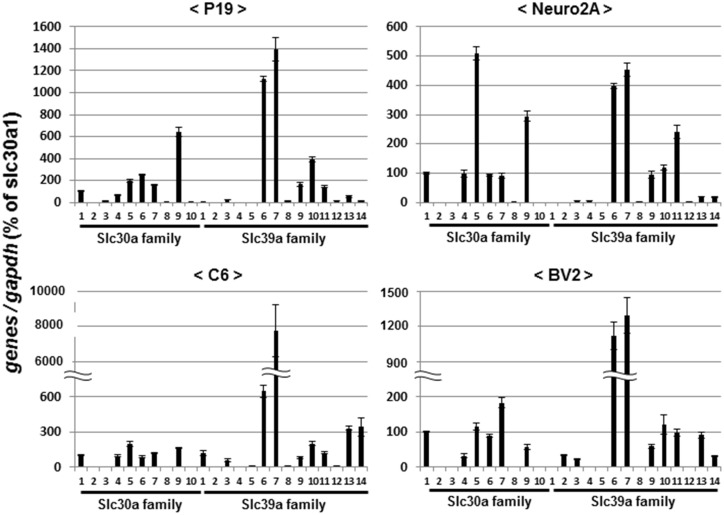
As cellular Zn2+ homeostasis is shown to at least in part involve bidirectional transport mediated by member proteins of the Zn2+ exporter solute carrier 30 (SLC30) family and the Zn2+ importer SLC39 family across membranes [38], we evaluated the possible expression of mRNA for these transmembrane Zn2+ transporters by different cell lines sensitive to the cytotoxicity of ZnCl2. Real time qPCR analysis clearly revealed constitutive mRNA expression of a variety of members of both Slc30a and Slc39a families in P19 (Fig 11, upper left panel), Neuro2A (Fig 17, upper right panel), C6 (Fig 17, lower left panel) and BV2 (Fig 17, lower right panel) cells. In particular, high expression of both Slc39a6 and Slc39a7 was commonly found in all cell lines tested which were sensitive to the cytotoxicity of ZnCl2.
Fig 17. Expression profiles of Zn2+ transporters in different cell lines.
Cells were cultured under respective appropriate conditions, followed by extraction of total RNA and subsequent determination of mRNA expression on qPCR. Values are the mean±S.E. of percentages over the expression of Slc30a1 in 3 different experiments.
Discussion
The essential importance of the present findings is that exposure to ZnCl2 induced a spontaneous gradual increase in Fluo-3 fluorescence in an EGTA-sensitive manner irrespective of the presence of added CaCl2 in C6 glioma cells. Moreover, both A23187 and pyrithione were similarly effective in drastically increasing Fluo-3 fluorescence in the presence of ZnCl2 in C6 glioma cells, which occurred independent of the presence of added CaCl2. In addition, co-existence of pyrithione would render the fluorescence of Fluo-3, rather than FluoZin-3, unstable after the addition of A23187. FluoZin-3 (Kd = 15.0 nM) is shown to have much higher affinity and selectivity for Zn2+ than other indicators such as FluoZin-1 (Kd = 7.8 μM) and FluoZin-2 (Kd = 2.1 μM). This is one of the reasons why we used FluoZin-3 as a fluorescent dye to selectively detect intracellular free Zn2+ amongst different indicators in this study.
The current findings that exposure to ZnCl2 led to a similarly drastic inhibition of MTT reducing activity irrespective of the presence of added CaCl2 altogether give rise to an unexpected idea that all Ca2+-sensitive reagents used here would substantially interact with Zn2+ besides Ca2+ in cultured C6 glioma cells in vitro. If EGTA were indeed a chelator selective for Ca2+ rather than Zn2+, the inhibition by ZnCl2 should not have been prevented by EGTA in the absence of added CaCl2. From a viewpoint of the prevention by EGTA of the cytotoxicity of ZnCl2 in the absence of added CaCl2, along with the failure of removal of CaCl2 to modulate the cytotoxicity, the possible potential interaction of EGTA with Zn2+ is highly conceivable. Similar unexpected potential interactions with Zn2+ were seen for Fluo-3, Rhod-2, A23187 and BAPTA, all of which have been widely used to evaluate and confirm the involvement of free Ca2+ in physiological, pharmacological, cellular and molecular mechanisms underlying a variety of cell biological phenomena for several decades. Taken together, much attention should be carefully paid to in vitro pharmacological profiling using these Ca2+-sensitive reagents for validation of a role of free Ca2+ in physiological and pathological processes in diverse tissues enriched of endogenous Zn2+.
In contrast to a variety of Ca2+-sensitive reagents used here, the present findings give support for an advantage of the usage of several chemicals as a reagent selective for Zn2+ rather than Ca2+. The absolute requirement for ZnCl2 by pyrithione to rapidly increase both Fluo-3 and Rhod-2 fluorescence even in the presence of CaCl2 argues in favor of an idea that pyrithione is an ionophore highly permeable for Zn2+ with an ability to increase the fluorescence intensity of both Fluo-3 and Rhod-2. The failure of TPEN to inhibit the elevated fluorescence intensity of both Fluo-3 and Rhod-2 in acquired NMDAR channels in the presence of both agonists is suggestive of higher selectivity of this chelator for free Zn2+ than Ca2+. Similar intensification of FluoZin-3 fluorescence irrespective of added CaCl2 in an EGTA-sensitive manner gives support for the usefulness of this fluorescent indicator for selective determination of intracellular free Zn2+ concentrations. Extracellular and/or intracellular Zn2+ could be at least in part responsible for the molecular pathogenesis of different neurodegenerative and neuropsychiatric disorders besides Ca2+ in a particular situation. Zinc is condensed in synaptic vesicles along with Glu for subsequent exocytotic release into synaptic clefts upon stimuli in glutamatergic nerve terminals in the brain [39–41]. Zinc metabolism is shown to be at least in part responsible for the pathogenesis of Alzheimer’s disease [25,42], whereas Zn2+ plays a role in mechanisms underlying selective neuronal cell death after transient global cerebral ischemia in rats [43].
The current findings on possible inadequacy of a variety of chemicals well known for years as tools for the specific chelation and/or detection of free Ca2+ in different cells undoubtedly discourage the use of these familiar chelators, ionophore and fluorescent dyes for free Ca2+ in different biological materials. The intracellular free Zn2+ concentration is reported to be below nM ranges in different cells including neurons as seen with intracellular free Ca2+, moreover, while intracellular free Zn2+ is shown to be accumulated into a variety of organelles including endoplasmic reticulum by particular zinc transporters [38–40]. The possibility that intracellular free Zn2+ plays a role in the physiology and pathophysiology in a manner similar to intracellular free Ca2+ in the brain is not ruled out. The use of a chelator, ionophore and fluorescent dye selective for free Zn2+ could be beneficial for the future discovery and disclosure of novel insights into elucidation of the role of intracellular free divalent cations in a variety of brain functions. Taking into consideration clearly distinct emission spectrum profiles of the three different dyes bound to the corresponding divalent cations, however, possible fluorescence interference is unlikely within the fluorescent dyes used.
It should be emphasized that all neural cell lines employed here exhibited high vulnerability to the toxicity of ZnCl2 in an EGTA-sensitive fashion together with mRNA expression of several Zn2+ transporters. In particular, vulnerable cells invariably expressed Slc39a family members such as Slc39a6 and Slc39a7 rather than Slc30a family members. Intracellular Zn2+ levels are sophisticatedly regulated by both influx and efflux mediated by two types of membrane transporters for this divalent cation across cell membranes, in addition to metallothioneins [44]. The SLC39 family is believed to play a role in cellular Zn2+ homeostasis as Zn2+ exporters across cell membranes, while the view that the SLC30 family is responsible for the influx of Zn2+ as an importer is prevailing [45–47]. SLC39A6 is shown to mediate the incorporation of extracellular Zn2+ in SH-SY5Y neuroblastoma cells [48], however, whereas SLC39A7 regulates mobilization of Zn2+ from Golgi apparatus to the cytoplasm [49]. The possibility that particular Zn2+ transporters are at least in part involved in the cellular vulnerability seen after brief exposure to ZnCl2 in different neural cells is thus not ruled out so far. The fact that removal of added CaCl2 failed to affect MTT reduction in C6 glioma cells exposed to ZnCl2 at all, by contrast, does not give rise to an involvement of the incorporation of extracellular Ca2+ across cell membranes in the cytotoxicity mediated by Zn2+.
It thus appears that the use of Ca2+-sensitive reagents widely used for years is insufficient for the direct demonstration of participation of this divalent cation in a variety of molecular, cellular and biochemical events in a particular situation. A comprehensive analysis on both Ca2+ and Zn2+ could be at least required for the accurate validation and identification of bioactive divalent cation responsible for diverse biological activities in different plasma cells enriched of Zn2+.
Data Availability
All relevant data are within the paper.
Funding Statement
This work was supported in part by Grants-in-Aid for Scientific Research to TT (No. 22500330) and YY (No. 24650196) from the Ministry of Education, Culture, Sports, Science and Technology, Japan. The funders had no role in study design, data collection and analysis, decision to publish, or preparation of the manuscript.
References
- 1. Scheetz AJ, Constantine-Paton M (1994) Modulation of NMDA receptor function: implications for vertebrate neural development. FASEB J. 8: 745–752. [DOI] [PubMed] [Google Scholar]
- 2. Collingridge GL, Bliss TV (1995) Memories of NMDA receptors and LTP. Trends Neurosci 18: 54–56. [PubMed] [Google Scholar]
- 3. Choi DW (1988) Calcium-mediated neurotoxicity: relationship to specific channel types and role in ischemic damage. Trends Neurosci 11: 465–469. [DOI] [PubMed] [Google Scholar]
- 4. Sattler R, Tymianski M (2000) Molecular mechanisms of calcium-dependent excitotoxicity. J Mol Med 78: 3–13. [DOI] [PubMed] [Google Scholar]
- 5. MacDermott AB, Mayer ML, Westbrook GL, Smith SJ, Barker JL (1986) NMDA-receptor activation increases cytoplasmic calcium concentration in cultured spinal cord neurones. Nature 321, 519–522. [DOI] [PubMed] [Google Scholar]
- 6. Mayer ML, Westbrook GL (1987) The physiology of excitatory amino acids in the vertebrate central nervous system. Prog. Neurobiol. 28, 197–276. [DOI] [PubMed] [Google Scholar]
- 7. Martin JL, Stork CJ, Li YV (2006) Determining zinc with commonly used calcium and zinc fluorescent indicators, a question on calcium signals. Cell Calcium 40: 393–402. [DOI] [PubMed] [Google Scholar]
- 8. Jagt TA, Connor JA, Weiss JH, Shuttleworth CW (2009) Intracellular Zn2+ increases contribute to the progression of excitotoxic Ca2+ increases in apical dendrites of CA1 pyramidal neurons. Neurosci 159: 104–114. [DOI] [PMC free article] [PubMed] [Google Scholar]
- 9. Kambe Y, Nakamichi N, Takarada T, Fukumori R, Nakazato R, Hinoi E, et al. (2011) A possible pivotal role of mitochondrial free calcium in neurotoxicity mediated by N-methyl-D-aspartate receptors in cultured rat hippocampal neurons. Neurochem Int 59: 10–20. 10.1016/j.neuint.2011.03.018 [DOI] [PubMed] [Google Scholar]
- 10. Fukumori R, Takarada T, Nakazato R, Fujikawa K, Kou M, Hinoi E, et al. (2013) Selective inhibition by ethanol of mitochondrial calcium influx mediated by uncoupling protein-2 in relation to N-methyl-D-aspartate cytotoxicity in cultured neurons. PLoS ONE 8: e69718 10.1371/journal.pone.0069718 [DOI] [PMC free article] [PubMed] [Google Scholar]
- 11. Tsien RY (1980) New calcium indicators and buffers with high selectivity against magnesium and protons: design, synthesis, and properties of prototype structures. Biochemistry 19: 2396–2404. [DOI] [PubMed] [Google Scholar]
- 12. Puskin JS, Gunter TE (1975) Electron paramagnetic resonance of copper ion and manganese ion complexes with the ionophore A23187. Biochemistry 14: 187–191. [DOI] [PubMed] [Google Scholar]
- 13. Wollheim CB, Blondel B, Trueheart PA, Renold AE, Sharp GW (1975) Calcium-induced insulin release in monolayer culture of the endocrine pancreas. Studies with ionophore A23187. J Biol Chem 250: 1354–1360. [PubMed] [Google Scholar]
- 14. Cuajungo MP, Lees GJ (1998) Nitric oexide generators produce accumulation of chelatable zinc in hippocampal neuronal perikarya. Brain Res 799: 118–129. [DOI] [PubMed] [Google Scholar]
- 15. St Croix CM, Wasserloos KJ, Dineley KE, Reynolds IJ, Levitan ES, Pitt BR (2002) Nitric oxide-induced changes in intracellular zinc homeostasis are mediated by metallothionein/thionein. Am J Physiol Lung Cell Mol Physiol 282: L185–L192. [DOI] [PubMed] [Google Scholar]
- 16. Bossy-Wetzel E, Talantova MV, Lee WD, Scholzke MN, Harrop A, Mathews E, et al. (2004) Crosstalk between nitric oxide and zinc pathways to neuronal cell death involving mitochondrial dysfunction and p38-activated K+ channels. Neuron 41: 351–365. [DOI] [PubMed] [Google Scholar]
- 17. Qian J, Noebels JL (2006) Exocytosis of vesicular zinc reveals persistent depression of neurotransmitter release during metabotropic glutamate receptor long-term depression at the hippocampal CA3-CA1 synapse. J Neurosci 26: 6089–6095. [DOI] [PMC free article] [PubMed] [Google Scholar]
- 18. Sensi SL, Canzoniero LM, Yu SP, Ying HS, Koh JY, Kerchner GA, et al. (1997) Measurement of intracellular free zinc in living cortical neurons: routes of entry. J Neurosci 17: 9554–9564. [DOI] [PMC free article] [PubMed] [Google Scholar]
- 19. Choi DW, Koh JY (1998) Zinc and brain injury. Annu Rev Neurosci 21: 347–375. [DOI] [PubMed] [Google Scholar]
- 20. Weiss JH, Sensi SL, Koh JY (2000) Zn2+: a novel ionic mediator of neural injury in brain disease. Trends Pharmacol Sci 21: 395–401. [DOI] [PubMed] [Google Scholar]
- 21. Christine CW, Choi DW (1990) Effect of zinc on NMDA receptor mediated channel currents in cortical neurons. J Neurosci 10: 108–116. [DOI] [PMC free article] [PubMed] [Google Scholar]
- 22. Peters S, Koh J, Choi DW (1987) Zinc selectively blocks the action of N-methyl-D-aspartate on cortical neurons. Science 236: 589–593. [DOI] [PubMed] [Google Scholar]
- 23. Westbrook GL, Mayer ML (1987) Micromolar concentrations of Zn2+ antagonize NMDA and GABA responses of hippocampal neurons. Nature 328: 640–643. [DOI] [PubMed] [Google Scholar]
- 24. Mony L, Kew JN, Gunthrope MJ, Paoletti P (2009) Allosteric modulators of NR2B-containing NMDA receptors: molecular mechanisms and therapeutic potential. Br J Pharmacol 157: 1301–1017. 10.1111/j.1476-5381.2009.00304.x [DOI] [PMC free article] [PubMed] [Google Scholar]
- 25. Bush A, Pettingell WH, Multhaup G, Paradis MD, Vonsattel J-P, Gusella JF, et al. (1994) Rapid induction of Alzheimer A beta amyloid formation by zinc. Science 265: 1464–1467. [DOI] [PubMed] [Google Scholar]
- 26. Kaneko M, Noguchi T, Ikegami S, Sakurai T, Kakita A, Toyoshima Y, et al. (2014) Zinc transporters ZnT3 and ZnT6 are downregulated in the spinal cords of patients with sporadic amyotrophic lateral sclerosis. J. Neurosci. Res. 10.1002/jnr.23491 [DOI] [PubMed] [Google Scholar]
- 27. Boom A, Pocher R, Autherlet M, Pradier L, Borghgraef P, Van Leuven F, et al. (2004) Astrocytic calcium/zinc binding protei S100A6 expression in Alzheimer’s disease and in PS1/APP transgenic mice models. Biochim Biophys Acta 1742: 161–168. [DOI] [PubMed] [Google Scholar]
- 28. Blasi E, Barluzzi R, Bocchini V, Mazzolla R, Bistoni F (1990) Immortalization of murine microglial cells by a v-raf/v-myc carrying retrovirus. J Neuroimmunol 27: 229–237. [DOI] [PubMed] [Google Scholar]
- 29. Takarada T, Yoneda Y (2009) Transactivation by runt related factor-2 of matrix metalloproteinase-13 in astrocytes. Neurosci Lett 451: 99–104. 10.1016/j.neulet.2008.12.037 [DOI] [PubMed] [Google Scholar]
- 30. Nakamura Y, Nakamichi N, Takarada T, Ogita K, Yoneda Y (2012) Transferrin receptor-1 suppresses neurite outgrowth in neuroblastoma Neuro2A cells. Neurochem Int 60: 448–457. 10.1016/j.neuint.2011.08.018 [DOI] [PubMed] [Google Scholar]
- 31. Nakazato R, Takarada T, Yamamoto T, Hotta S, Hinoi E, Yoneda Y (2011) Selective upregulation of Per1 mRNA expression by ATP through activation of P2X7 purinergic receptors expressed in microglial cells. J Pharmacol Sci 116: 350–361. [DOI] [PubMed] [Google Scholar]
- 32. Ogura M, Kakuda T, Takarada T, Nakamichi N, Fukumori R, Kim YH, et al. (2012) Promotion of both proliferation and differentiation in pluripotent P19 cells with stable overexpression of the glutamine transporter Slc38a1. PLoS ONE 7: e48270 10.1371/journal.pone.0048270 [DOI] [PMC free article] [PubMed] [Google Scholar]
- 33. Fukumori R, Nakamichi N, Takarada T, Kambe Y, Matsushima N, Moriguchi N, et al. (2010) Inhibition by 2-methoxy-4-ethylphenol of Ca2+ influx through acquired and native N-methyl-D-aspartate receptor channels. J Pharmacol Sci 112: 273–281. [DOI] [PubMed] [Google Scholar]
- 34. Li-Smerin Y, Aizenman E, Johnson JW (2000) Inhibition by intracellular Mag2+ of recombinant N-methyl-D-aspartate receptors expressed in Chinese hamster ovary cells. J Pharmacol Exp Ther 292: 1104–1110. [PubMed] [Google Scholar]
- 35. Taniura H, Iijima S, Kambe Y, Georgiev D, Yoneda Y (2007) Tex261 modulates the excitotoxic cell death induced by N-methyl-D-aspartate (NMDA) receptor activation. Biochem. Biophys. Res. Commun. 362, 1096–1100. [DOI] [PubMed] [Google Scholar]
- 36. Takarada T, Kou M, Nakamichi N, Ogura M, Ito Y, Fukumori R, et al. (2013) Myosin VI reduces proliferation, but not differentiation, in pluripotent P19 cells. PLoS ONE 8: e63947 10.1371/journal.pone.0063947 [DOI] [PMC free article] [PubMed] [Google Scholar]
- 37. Wei W, Ryu JK, Choi HB, McLarnon JG (2008) Expression and function of the P2X7 receptor in rat C6 glioma cells. Cancer Lett 260: 79–78. [DOI] [PubMed] [Google Scholar]
- 38. Sensi SL, Paoletti P, Bush AI, Sekler I (2009) Zinc in the physiology and pathology of the CNS. Nat Rev Neurosci 10: 780–791. 10.1038/nrn2734 [DOI] [PubMed] [Google Scholar]
- 39. Smart TG, Xie X, Krishek BJ (1994) Modulation of inhibitory and excitatory amino acid receptor ion channels by zinc. Prog Neurobiol 42: 393–441. [DOI] [PubMed] [Google Scholar]
- 40. Takeda A, Tamano H (2009) Insight into zinc signaling from dietary zinc deficiency. Brain Res Rev 62: 33–34. 10.1016/j.brainresrev.2009.09.003 [DOI] [PubMed] [Google Scholar]
- 41. Paoletti P, Vergnano AM, Barbour B, Casado M (2009) Zinc at glutamatergic synapses. Neuroscience 158: 126–136. 10.1016/j.neuroscience.2008.01.061 [DOI] [PubMed] [Google Scholar]
- 42. Adlard PA, Parncutt JM, Finkelstein DI, Bush AI (2010) Cognitive loss in zinc transporter-3 knock-out mice: A phenocopy for the synaptic and memory deficits of Alzheimer’s disease?, J Neurosci 30: 1631–1636. 10.1523/JNEUROSCI.5255-09.2010 [DOI] [PMC free article] [PubMed] [Google Scholar]
- 43. Koh JY, Suh SW, Gwag BJ, He YY, Hsu CY, Choi DW (1996) The role of zinc in selective neuronal death after transient global cerebral ischemia, Science 272: 1013–1016. [DOI] [PubMed] [Google Scholar]
- 44. Vallee BL (1995) The function of metallothionein. Neurochem Int 27: 23–33. [DOI] [PubMed] [Google Scholar]
- 45. Kambe T, Weaver BP, Andrews GK (2008) The genetics of essential metal homeostasis during development. Genesis 46: 214–228. 10.1002/dvg.20382 [DOI] [PMC free article] [PubMed] [Google Scholar]
- 46. Lichten LA, Cousins RJ (2009) Mammalian zinc transporters: nutritional and physiologic regulation. Annu Rev Nutr 29: 153–176. 10.1146/annurev-nutr-033009-083312 [DOI] [PubMed] [Google Scholar]
- 47. Hojyo S, Fukada T, Shimoda S, Ohashi W, Bin B-H, Koseki H, et al. (2011) The zinc transporter SLC39A14/ZIP14 controls G-protein coupled receptor-mediated signaling required for systemic growth. PLoS ONE 6: e18059 10.1371/journal.pone.0018059 [DOI] [PMC free article] [PubMed] [Google Scholar]
- 48. Chowanadisaia W, Lonnerdala B, Kelleherb SL (2008) Zip6 (LIV-1) regulates zinc uptake in neuroblastoma cells under resting but not depolarizing conditions. Brain Res 1199: 10–19. 10.1016/j.brainres.2008.01.015 [DOI] [PubMed] [Google Scholar]
- 49. Huang L, Kirschke CP, Zhang Y, Yu YY (2005) The ZIP7 Gene (Slc39a7) encodes a zinc transporter involved in zinc homeostasis of the Golgi apparatus, J Biol Chem 280: 15456–15463. [DOI] [PubMed] [Google Scholar]
Associated Data
This section collects any data citations, data availability statements, or supplementary materials included in this article.
Data Availability Statement
All relevant data are within the paper.


