

Abstract
The purpose of this study was to investigate whether the epidermal growth factor receptor (EGFR) and signal transducer and activator of transcription-3 (STAT3) signal pathway contributes to the carcinogenesis of intrahepatic cholangiocarcinoma (ICC) induced by 3’-methyl-4 dimethylaminoazobenzene (3’Me-DAB) in rats. EGFR, TGFα, STAT3 and p-STAT3 in different stages of carcinogenesis were detected by immunohistochemistry (IHC). In situ hybridization (ISH) was applied to investigate the expression of STAT3 mRNA. Oval cells were verified by the immunohistochemical staining of alpha-fetoprotein (AFP), CD133 and epithelial cell adhesion molecules (EpCAM). Sequential development of necrosis, oval cell proliferation, cholangiofibrosis (CF) and ICC was observed in the liver of rats administered 3’Me-DAB. Oval cells showed positive expression of AFP, CD133 and EpCAM. The expression of EGFR was significantly higher in the ICC than in oval cells, CF or normal bile ducts (p<0.05), but there was no difference in EGFR expression between the other groups. The highest expression of p-STAT3 and TGFα was observed in CF. The expression of these two molecules in the ICC and oval cells was significantly higher than in normal bile ducts (p<0.05). Elevation of STAT3 mRNA was detected during carcinogenesis as shown by ISH, strong intensity was observed in the ICC and moderate intensity was observed in oval cells and CF. These observations suggest that the EGFR and STAT3 signal pathway contributes to the carcinogenesis of ICC. High activity of STAT3 during the carcinogenesis of ICC may be the result of high activity of EGFR triggered by TGFα.
Keywords: 3’-methyl-4 dimethylaminoazobenzene, carcinogenesis, intrahepatic cholangiocarcinoma, epidermal growth factor receptor, signal transducer and activator of transcription-3, oval cell
Introduction
Intrahepatic cholangiocarcinoma (ICC), a primary malignant liver neoplasm secondary to hepatocellular carcinoma (HCC) accounts for approximately 13% of primary liver cancers. The incidence of ICC has increased worldwide in recent decades1. Surgical resection is the only potentially curative therapy for ICC patients. However, the resectability rate has been quite low and variable (18–70%) because most patients present at an advanced stage2. Generally, the majority of ICC patients have a poor prognosis, even after surgical resection. The increase in worldwide incidence and poor prognosis highlights the importance of understanding the molecular mechanisms associated with carcinogenesis and progression of ICC3.
The mechanisms underlying the pathogenesis of ICC are still unclear. In classical models of ICC pathogenesis, a common and important contributor to the malignant transformation of cholangiocytes is chronic inflammation of the liver. This inflammation is often coupled with injury of the bile duct epithelium and obstruction of bile flow, which increases cholangiocyte transformation4. Recent studies suggested that some ICCs could arise from liver stem cells rather than from mature cholangiocytes5. Stem cells are considered to be a possible target for carcinogenic agents, since their longevity permits the development of the multistep process leading to tumor formation during the prolonged latency period between exposure and progression to cancer6. In several rat models for studying the carcinogenesis of ICC, morphological stages imply sequential acquisition of a transformed and then a malignant phenotype. The morphological stages generally included proliferation of oval cells, cholangiofibrosis (CF) and ICC7, 8. Oval cells are regarded as the progenitor cells of rodent liver, under conditions in which proliferation of mature hepatocytes and/or cholangiocytes is inhibited, oval cells expand and differentiate into mature hepatocytes and cholangiocytes9. CF was reported to arise from the differentiation of oval cells and regarded as the precursor lesion of ICC10, 11. CF is characterized by extensive fibrosis and inflammation associated with bile duct proliferation with areas of intestinal metaplasia. Intestinal metaplasia was recorded clinically in patients with chronic biliary inflammation, hepatolithiasis, and choledochal cyst, conditions increase the risk of cholangiocarcinoma (CC) in humans10, 11.
Epidermal growth factor receptor (EGFR/ErbB1) belongs to the ErbB family of receptor tyrosine kinases (RTKs). In normal cells, EGFR is expressed at relatively low levels. Binding the ligands such as transforming growth factor α (TGFα), EGFR can activate several intracellular signaling cascades, including two main downstream pathways, namely, RAS/MAP kinase and phosphatidylinositol-3-kinase (PI3K)12, other pathways can also be activated, including the signal transducer and activator of transcription-3 (STAT3) signal transduction pathway13. In many human tumors including ICC, overexpression and/or increased activity of EGFR are key characteristics and are frequently linked to more aggressive tumor behaviors and poor prognosis14, 15. Therefore, EGFR is considered an outstanding therapeutic target for human cancers. EGFR-targeting drugs such as gefitinib and cetuximab have been developed and approved for the treatment of patients with EGFR-expressing lung cancer and colorectal carcinoma14, 16.
STAT3 is a latent cytoplasmic transcription factor that serves the dual functions of a signal transducer and activator of transcription. STAT3 can be activated by EGFR or IL-6. Once activated by phosphorylation, STAT3 dimerizes and translocates to the nucleus, where it activates transcription and in turn modulates cell proliferation, apoptosis and differentiation17. It plays an important role in both inflammation and cancer. Constitutive activation of STAT3 has been detected in a variety of primary human epithelial tumors including squamous cell carcinomas (SCCs) of the head and neck, breast, ovary, prostate and lung17. Aberrant activation of STAT3 is a common finding in ICC18. However, naturally occurring mutations of STAT3 leading to its constitutive activation have not been identified. It is therefore proposed that aberrant growth factor signaling may play an important role in the constitutive activation of STAT319. Recent studies have implicated a role for STAT3 in maintaining EGFR-mediated epithelial cancer cell proliferation20. It was reported that in tumor cells, EGFR is capable of activating STAT3; compared with IL-6, which mediates STAT3 activation rapidly and transiently, EGFR-mediated STAT3 activation is persistent13. Little is known about EGFR-STAT3 signaling in the carcinogenesis of ICC.
In the present study, in order to evaluate the role of the EGFR and STAT3 signal pathway in the multistage carcinogenesis of ICC, and whether there is any relationship between them, a rat model of 3’Me-DAB-induced ICC was established, and sequential changes in EGFR, TGFα, STAT3 and p-STAT3 were examined in different stages of carcinogenesis. The transcription of STAT3 was also examined. Correlations between these factors were evaluated.
Materials and Methods
Animals
Male Wistar rats (70–90 g) were purchased from Shanghai Medical University. Rats were maintained in polycarbonate cages with iron tops and held under conventional housing conditions. The rats were subjected to a 7-day quarantine period to ensure their health conditions.
Liver cancer was induced by feeding a choline-deficient diet containing 0.06% 3’-Me-DAB (Oriental Yeast Co., Ltd, Chiba Japan), as reported previously21,22. A corn flour diet containing 3’-Me-DAB was provided to the rats (n=70) for 12 weeks, followed by provision of a standard laboratory diet until sacrifice. Control (n=35) rats were fed a corn flour diet for 12 weeks and then only the standard diet. Ten rats in the experimental group and 5 rats in the control group were sacrificed each time at 5, 9, 12, 15, 18, 20 and 22 weeks after the start of 3’-Me-DAB feeding. At the time of sacrifice, the animals were anesthetized by ether inhalation. Samples of both tumorous and non-tumorous liver tissue were fixed in 4% paraformaldehyde and embedded in paraffin. The study was approved by the Ethics Committee of the Experimental Animal Facility of Dalian Medical University.
Histology and immunohistochemistry
Four-micrometer-thick tissue sections of formalin-fixed, paraffin-embedded liver samples were stained with hematoxylin-eosin (HE) for standard histology observation. Alcian Blue (Chroma) staining was applied to differentiated the ICC from HCC.
Immunohistochemical (IHC) staining was performed using a polyclonal antibody to TGFα (anti-TGFα) (Santa Cruz, sc9403), polyclonal antibody to EGFR (anti-EGFR) (Santa Cruz, sc03), polyclonal antibody to STAT3 (anti-STAT3) (NeoMarkers, RB-9237), polyclonal antibody to p-STAT3 (anti-p-STAT3(Tyr705)) (Cell Signaling Technology, 9131), polyclonal antibody to AFP (Proteintech, 14550-1-ap), polyclonal antibody to CD133 (Biorbyt, orb99113), polyclonal antibody to EpCAM (BioLegend, B149573) and avidin-biotin-peroxidase technique (Vectastain Elite ABC Kit, Vector Laboratories). Four-micrometer paraffin-embedded tissue sections were deparaffinized and rehydrated. Two percent H2O2 -methanol was used to ablate the endogenous peroxidase, and 5% normal horse serum was used to suppress nonspecific protein binding. The tissue sections were incubated at 37°C for 1 hour and then at 4°C overnight with the primary antibody, and 5% normal horse serum in PBS without antibody as negative control. All antibodies were diluted 1:50 in 5% serum. The sections then were washed and incubated with secondary biotinylated goat anti-rabbit or anti-mouse IgG at 37°C for 1 hour, and the incubated with avidin-biotin Complex at 37°C for 45 min. Color was developed with diaminobenzidine tetrahydrochloride. Some of the slides were counterstained with hematoxylin.
In situ hybridization
A plasmid containing cDNA of mouse STAT3, a gift from Dr. Melissa Henriksen, The Rockfeller University23, was proliferated in E.coli and extracted by plasmid minipreparation kit (Biosia Biotechnology Co.). A 442bp digoxigenin-labeled DNA probe was generated with a PCR DIG Probe Synthesis Kit (Roche) according to the manufacturer’s instructions using the plamid as a template. The primers for PCR were TCAGACCCGCCAACAAAT (sense) and GCCTCCATTCCCACATCTC (antisense) which were designed according to the published mouse cDNA sequence using the Primer 5 software.
All solutions were treated with diethylpyrocarbonate (DEPC) to avoid RNase contamination. All glassware was baked at 180°C for 4 hours. Paraffin-embedded tissue samples were sectioned (5 μm). The sections were deparaffinized in serial xylene and alcohol solvents, transferred into HCl and 0.3% Triton 100 for permeabilization and then digested with protein kinase K as reported previously24. The sections were pretreated with 4% buffered paraformaldehyde, 100 mM TEA and 0.25% anhydrous acetate and further dehydrated with serial alcohol. The sections were washed with PBS after each step, except for the last step.
The probe was diluted in prehybridization solution (1:20) (50% formamide, 5×standard saline citrate (SSC), 5×Denhardt’s reagent, 128 μg/ml herring sperm DNA, 100 μg/ml tRNA, 0.02% SDS). The double-stranded probe was denatured by heating for 10 minutes at 100°C and then chilling it rapidly in ice water. The solution was dropped on the pretreated sections, covered with parafilm and incubated in a wet chamber for 16 hours at 42°C. After hybridization, the sections were washed with 2×SSC, 1×SSC, 0.2×SSC and 0.1×SSC at 37°C successively. After incubation with 0.5% blocking regent at 37°C for 30 min, the sections were incubated with alkaline phosphatase-labeled anti-digoxigenin antibody (1:100) and visualized with NBT-BCIP substrate. Some of the sections were further counterstained with Methylene Green. To confirm the specificity of the hybridization signal, mock hybridization without a probe was performed as a control.
Evaluation of immunohistochemical stain and statistical Analysis
Bile ducts in control livers, the area of oval cell proliferation, bile ducts in CF and malignant glands in ICCs were included in the image analysis. The immunohistochemical experiments were analyzed qualitatively by optical microscopic observation or semiquantitatively evaluated with the Image-Pro Plus 6.0 image analysis software (Media Cybernetics, Inc., Rockville, MD, USA). For EGFR and STAT3 expression in ICC, microscopic examination for cell reaction products was performed and scored as follows: 1+ =5%–25% of cell staining; 2+ =25%–50% of cell staining; 3+ =50%–75% of cell staining; 4+ =>75% of cell staining. The mean densitometric values of EGFR, TGF, STAT3, and p-STAT3 in normal bile ducts, the oval cell proliferation area, bile ducts in CF and ICCs were measured with an Image-Pro Plus image analysis system. Briefly, after IHC staining, the areas from both cancerous and adjacent normal tissue were selected for analysis. Specifically, cancerous glands or solid tumor areas of the tumor tissue, normal bile ducts of the control liver, the area of oval cell proliferation in early carcinogenesis stage, and the bile ducts in CF were selected as the target objects, and the intensity of the staining signal was measured and documented. The mean densitometry value from digital image (×400) was designated as the representative staining intensity. The signal densities of tissue areas from at least six randomly selected observations were calculated and subjected to statistical analysis.
Statistical analysis was performed using SPSS 19.0 (IBM Corp., Armonk, NY), and p < 0.05 was considered significant. Comparisons between groups were performed using the Kruskal-Wallis or Mann-Whitney test. Statistical analyses were two-tailed.
Results
Sequential development of necrosis, oval cell proliferation, CF and ICC in rats administered 3’Me-DAB
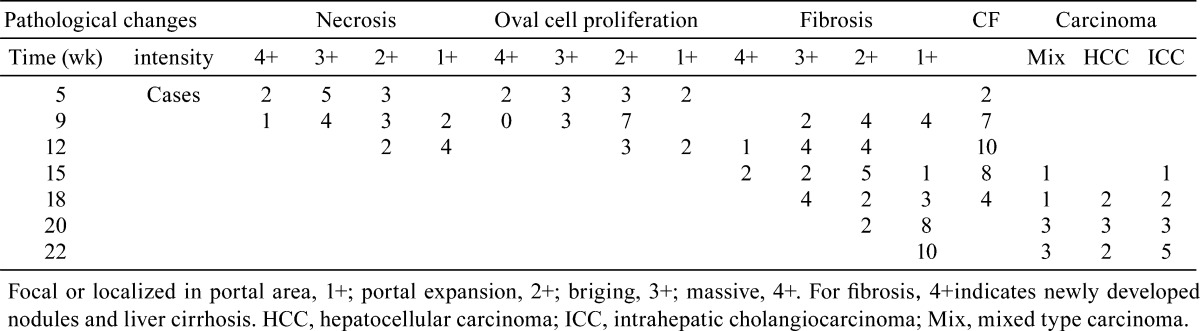
In the early stage of carcinogenesis (weeks 5 to 9), necrosis, degeneration and inflammation were detected (Fig. 1). Oval cells proliferation was noticed in the portal triad. Oval cells had oval nuclei and scanty cytoplasm, and some were arranged in the form of small ductules and cords. Oval cells were verified by IHC staining of AFP, CD133 and EpCAM. Oval cells exhibited clear membrane staining of CD133 and EpCAM and showed cytoplasmic staining of AFP (Fig. 2). CF and liver cirrhosis developed in the middle stage of carcinogenesis (weeks 12 to 15). In CF, bile ducts and atypical bile ducts were surrounded by a dense stroma that contained many fibroblasts. Atypical cholangiocytes were detected in CF. CF mostly arose in the area of massive necrosis and oval cells proliferation (Fig. 1). Carcinomas including HCC, ICC and mixed type carcinoma arose in the liver at around weeks 15 to 22, the 3’Me-DAB had been withdrawn several weeks before this (Table 1). Carcinomas were classified by histological examination of slides subjected to HE and PAS staining two pathologists (Shilun Lu and Xiaotang Yu). Nineteen cases of ICC and mixed type carcinoma developed in total. Surrounding paratumor liver tissues still exhibited fibrosis but seemed to recover from cirrhosis. The control group rats showed no obvious pathologic changes. We divided the carcinogenesis process into three morphological stages including proliferation of oval cells, CF and ICC (Fig. 1).
Fig. 1.

Gross appearances and histological changes at different stages of cholangiocarcinogenesis in the rats. A/a shows massive necrosis of the liver and oval cell proliferation. B/b shows liver cirrhosis and CF in the middle stage of carcinogenesis. C/c shows that malignant nodules arose in the liver.
Fig. 2.
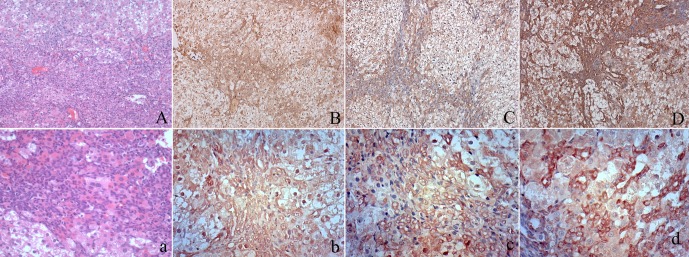
Immunohistochemical staining of AFP, CD133 and EpCAM in oval cells. At low magnification, oval cell hyperplasia appears as increased cellularity in portal areas (A). Higher magnification reveals that centrilobular hepatocyte hypertrophy is also present. Some oval cells form glandular structures resembling bile ducts (a). Oval cell proliferations can be seen bridging between adjacent portal areas. Oval cells showed cytoplasmic expression of AFP (B, b) and clear membrane expression of CD133 (C, c) and EpCAM (D, d)
Table 1. Pathological Changes in the Rat Liver During Carcinogenesis .
Expression of EGFR and TGFα in different stages of cholangiocarcinogenesis
EGFR was mainly expressed on the membrane, but there was some expression of EGFR in the cytoplasm (Fig. 3). Normal bile ducts showed either no staining or slight staining. Oval cells and the bile ducts in CF exhibited weak EGFR immunoreactivity, but showed clear membrane staining, especially on the luminal side of the cells. Strong to moderate membrane staining was detected in ICCs, and 8 of the 19 cases were classified as 4+, 6 were classified as 3+, 4 were classified as as 2+, 1 was classified as +. The results of image analysis showed that the expression of EGFR in ICCs was significantly higher than in the other groups (p<0.05). No difference in EGFR expression was found when comparing normal bile ducts, oval cells and bile ducts in CF (p>0.05) (Fig. 4, Table 2).
Fig. 3.

Immunohistochemical staining of EGFR, TGFα, STAT3 and p-STAT3 in normal bile ducts, oval cells, CF and ICC. Normal bile ducts showed weak membrane or cytoplasmic staining of EGFR (A1). Oval cells (A2) and bile ducts (A3) in CF show membrane aggregation of EGFR expression. Malignant glands in the ICC exhibited strong membrane staining of EGFR (A4). Normal bile ducts showed weak cytoplasmic staining of TGFα (B1). Elevated TGFα expression was detected in oval cells (B2). Strong cytoplastic staining of TGFα was detected in the bile ducts in CF (B3) as well as in the malignant glands in the ICC (B4). Normal bile ducts showed weak nuclear p-STAT3 expression (C1). Elevated p-STAT3 expression was detected in oval cell (C2). Strong nuclear staining of p-STAT3 was detected in the bile ducts in CF (C3) as well as in the malignant glands in the ICC (C4). Normal bile ducts (D1), oval cells (D2) and bile ducts in CF (D3) showed weak cytoplastic staining of STAT3. some hepatocellular nuclei seem positive for STAT3. Some cases of ICC showed strong cytoplastic and nuclear staining of STAT3 (D4).
Fig. 4.

IHC results of EGFR, TGFα, STAT3 and p-STAT3 expression in multistage of cholangiocarcinogenesis were semiquantified with an Image-Pro Plus image analysis system. Six different 200× views in each of the 19 cases of ICC, oval cells proliferation area in the livers of rats sacrificed in weeks 5 to 9 after administration of 3’Me-DAB, CF in the livers of rats sacrificed in weeks 12 and 15 after administration of 3’Me-DAB and bile ducts in 10 normal liver tissue specimens of the control group were included in the image analysis. The mean densitometric value was used to represent the staining intensity. Data are expressed as the mean ± standard error (SE). Differences were analyzed using analysis of variance or an independent sample t-test.*** The expression is significantly higher than in other three groups. * The expression in the ICC or oval cell is significantly higher than in normal bile ducts. # The expression of STAT3 in ICC is significantly higher than in CF.
Table 2. P Value for Comparisons Between the Expression of EGFR, TGFα, STAT3 and p-STAT3 in Different Stages of Carcinogenesis.
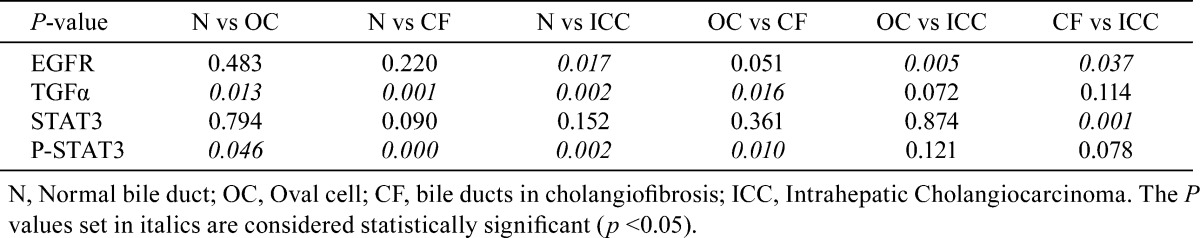
TGFα was mainly expressed in the cytoplasm (Fig. 3). No immunoreactivity or very weak TGFα immunoreactivity was detected in the normal bile duct epithelium, and oval cells showed elevated TGFα expression in the cytoplasm and in the lumen of some ductule structures. Strong TGFα expression was detected in the bile ducts in CF as well as the lumen of these bile ducts. The malignant glands in ICCs also exhibited strong cytoplasmic staining of TGFα. Image analysis showed, during carcinogenesis, that the expression of TGFα in oval cells, bile ducts in CF and ICCs was significantly higher than in normal bile ducts (p<0.05). The expression of TGFα in CF was stronger than in oval cells (p<0.05) (Fig. 4, Table 2).
Expression of STAT3 and p-STAT3 in different stages of cholangiocarcinogenesis
STAT3 staining was localized in the cytoplasm and nucleu (Fig. 3). Weak or none STAT3 staining was observed within the cytoplasm of normal bile ducts, oval cells and bile ducts in CF. Strong to moderate cytoplasmic and sometimes nuclear staining of STAT3 was noticed in ICCs. The staining intensity varied between tumors and immunoreactivity was not homogeneous throughout the individual tumor. Among the 19 ICC cases, 4 were classified as 4+, 6 were classified as 3+, 7 were classified as 2+, and 2 were classified as +. Results of image analysis showed that STAT3 staining in ICCs was significantly higher than in bile ducts and in CF (p<0.05). No difference in STAT3 expression was found between other groups (Fig. 4, Table 2).
To evaluate the activation of STAT3, phosphorylated STAT3 (Y705) (p-STAT3) was detected. P-STAT3 staining was localized in the nucleus (Fig. 3). In normal bile ducts, immunoreactivity for p-STAT3 was weak. The intensity of p-STAT3 staining was strong in the oval cells, CF and ICC. Image analysis showed that the expression of p-STAT3 in oval cells, bile ducts in CF and ICC was significantly higher than in normal bile ducts (p<0.05). The expression of p-STAT3 in CF was stronger than in oval cells (p<0.05) (Fig. 4, Table 2).
In situ hybridization detection of STAT3 mRNA
To determine the location and level of STAT3 mRNA in tissue, in situ hybridization was performed. All STAT3 mRNA signals were confined to the cytoplasm. An elevated intensity of STAT3 mRNA was identified in oval cells and bile ducts in CF, but STAT3 mRNA was undetectable in normal bile ducts in the liver of control rats. The staining intensity of STAT3 mRNA was strong in the ICC. As shown in Fig. 5, the STAT3 mRNA was expressed at a high level in ICC tissue when compared with the level in the bile ducts of the normal liver.
Fig. 5.
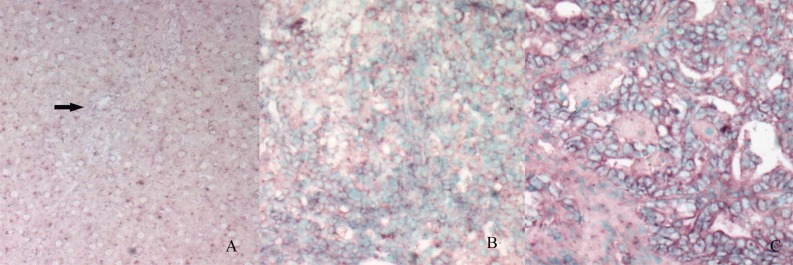
In situ hybridization analysis of STAT3 mRNA expression in the normal liver and bile duct (A, arrow), oval cells (B) and ICC (C).The purple signals are confined to the cytoplasm. Intense signals are seen in the oval cells area and ICC. (The control section hybridized with prehybridization solution without a probe shows no staining [result not shown]).
Discussion
The principal findings of this study related to the molecular mechanism of carcinogenesis of ICC. Our results demonstrate that the EGFR and STAT3 signal pathway involved in the initiation and progression of ICC. Sustained STAT3 activation in this process may be mediated by EGFR.
The observations in this 3’Me-DAB-induced rat liver cancer model supports the hypothesis of multistage carcinogenesis of stem cell origin. In the early stage of carcinogenesis, oval cells proliferated in response to massive necrosis of the liver, and some oval cells differentiated into duct-like structures. In the middle stage, CF accompanied by metaplasia of bile ducts was noticed in the area of oval cell proliferation. HCC, ICC and mixed type carcinoma arose in the liver at around weeks 15 to 22, the 3’Me-DAB had been withdrawn several weeks before this. It was reported that when a progenitor cell on its way to differentiation develops into cancer, it can give rise to tumors with a whole range of phenotypes25.
Elevated expression of EGFR and/or its ligand TGFα, is common in many types of epithelial cancer, and such changes have been shown to be an important component for maintaining the proliferative capacity of tumor cells13, 14. In our ICC model, elevated expression of TGFα was found during the whole process of carcinogenesis, and it was highest in CF, followed by in the ICC and oval cells. Elevated expression of EGFR was only observed in the ICC, but oval cells and bile ducts in CF showed membrane aggregation at the luminal side. This observation implied that in “preneoplastic” lesions, constitutive activation of EGFR was related to a ligand persistently overproduced in a paracrine or autocrine manner such as TGFα and in turn promoted the proliferation of cells, this may have facilitated the malignant change. In the ICC, aberrant high activity of EGFR signaling was associated with elevated expression of the ligand as well as aberrant elevated expression of the receptor. An aberrant change in EGFR might be one of the critical events in carcinogenesis, may occur as a result of receptor gene amplification and/or transcription-mediated protein overexpression, or may occur as a result of mutational activation25. Diverse evidences suggests that activation of TGFα/EGFR signaling plays roles in the ICC. ICC in conjunction with chronic advanced liver disease showed a higher EGFR mutation rate26. EGFR was associated with decreased overall and disease-free survival in patients with ICCs27,28,29. Recent publications have evaluated the role of anti-EGFR therapies in biliary tracts carcinomas. An antagonist of EGFR caused significant ICC growth inhibition in vivo30. In advanced cholangiocarcinoma patients, a phase II trial of gemcitabine, a monoclonal anti-EGFR antibody, and irinotecan showed encouraging efficacy31. This suggests that an EGFR-targeting drug can be an effective treatment for ICC.
Accumulating evidence has demonstrated that aberrant activity of STAT3 is implicated in carcinogenesis in several cancer types17, 18. In agreement with these finding, we found high activity of STAT3 during carcinogenesis. Elevated expression p-STAT3 was observed in oval cells, CF and the ICC, but increased expression of STAT3 was only detected in the ICC. We also detected STAT3 transcription activity by ISH. Compared with the normal liver, the transcription of STAT3 gene was active in oval cells and CF and especially in ICC. This is agreement with the high activation of STAT3, as shown by the p-STAT3 expression. The ICC seemed to show the strongest STAT3 transcription activity. Considering the constitutive activation of STAT3 in the ICC, the strong transcription activity in the ICC is easy to understand.
STAT3 can be activated by several signals including IL-6 and EGFR16. Image analysis showed similar results in p-STAT3 and TGFα. The expression of p-STAT3 and TGFα was significantly higher during carcinogenesis than in normal bile ducts, and the highest levels of expression for both were found in CF. These observations implied that constitutive activation of STAT3 may be relate to the endogenously overproduced TGFα and may contribute to preferential cell growth during carcinogenesis. Several studies had reported that IL-6-dependent activation of STAT3 was important for the initiation and progression of ICC. In a model in which activation of extracellular signal-regulated kinase (ERK) was repressive, activation of IL-6-dependent STAT3 directly enhanced the proliferation of progenitor cells32. However, is the activation of STAT3 in oval cells only mediated by IL-6? Another model showed that DDC treatment in IL-6 knockout mice resulted in liver necrosis and oval cell proliferation similar to that found in a wild-type group. These could suggest that besides IL-6, other family members can either substitute for the loss of IL-6 or are more relevant for oval cell induction33. Our experiments suggested that the high activity of STAT3 in oval cells, CF and the ICC may also be related to activation of the EGFR signal pathway. Some reports have demonstrated that EGFR-STAT3 plays an important role in carcinogenesis. In a chemically induced mouse model of oral squamous cell carcinoma, inhibition of EGFR-STAT3 signaling with erlotinib can prevent carcinogenesis34. In cholangiocarcinoma cells, Chang and colleagues proved that EGFR is involved in the activation of STAT319. But our results did not show if STAT3 was directly activated by EGFR during carcinogenesis. This requires further study.
TGFα and p-STAT3 showed the strongest immunoreactivity in CF during carcinogenesis; it was even stronger than in the ICC. In CF, strong TGFα expression was noticed both in bile ducts and in the lumen. CF may be a key step for carcinogenesis. In our ICC model, ICC arose after CF within several weeks after withdrawal of 3’Me-DAB. The studies of Maronpot also had showed this, once CF was induced by furan, it would generally progress into CC even in the absence of further furan treatment10. CF was regarded as the precursor lesion of ICC. In CF, a high level of TGFα expression may be the result of bile acids. Werneburg et al had reported that bile acids can stimulate the production of TGFα and activate the EGFR signaling pathway, and that this EGFR activation promotes the activation of downstream molecules including PI3-K, MAPK or STAT3, resulting in alterations in the cell cycle, cell growth, and cell survival4, 35. The high activity of this pathway may facilitate the malignant transformation.
In conclusion, our data presented in this study suggested that TGFα, EGFR and STAT3 played a role in the multistage carcinogenesis of ICC. Elevated activation of EGFR and STAT3 was found in oval cells, CF and the ICC. TGFα may be an autocrine growth promoter of the progression of ICC and may contribute to the constitutive activation of STAT3.
Acknowledgments
This work was partially supported by a Science Grant (L2011157) from the Department of Education, Liaoning Province, PR China. We thank Dr. Melissa Henriksen, Rockefeller University, NY, USA for kindly providing the STAT3 plasmid.
References
- 1.Wise C, Pilanthananond M, Perry BF, Alpini G, McNeal M, and Glaser SS. Mechanisms of biliary carcinogenesis and growth. World J Gastroenterol. 14: 2986–2989. 2008. [DOI] [PMC free article] [PubMed] [Google Scholar]
- 2.Morise Z, Sugioka A, Tokoro T, Tanahashi Y, Okabe Y, Kagawa T, and Takeura C. Surgery and chemotherapy for intrahepatic cholangiocarcinoma. World J Hepatol. 2: 58–64. 2010. [DOI] [PMC free article] [PubMed] [Google Scholar]
- 3.Yamamoto M, and Ariizumi S. Surgical outcomes of intrahepatic cholangiocarcinoma. Surg Today. 41: 896–902. 2011. [DOI] [PubMed] [Google Scholar]
- 4.Werneburg NW, Yoon JH, Higuchi H, and Gores GJ. Bile acids activate EGF receptor via a TGF-alpha-dependent mechanism in human cholangiocyte cell lines. Am J Physiol Gastrointest Liver Physiol. 285: G31–G36. 2003. [DOI] [PubMed] [Google Scholar]
- 5.Oishi N, and Wang XW. Novel therapeutic strategies for targeting liver cancer stem cells. Int J Biol Sci. 7: 517–535. 2011. [DOI] [PMC free article] [PubMed] [Google Scholar]
- 6.Bustos M, Sangro B, Alzuguren P, Gil AG, Ruiz J, Beraza N, Qian C, Garcia-Pardo A, and Prieto J. Liver damage using suicide genes. A model for oval cell activation. Am J Pathol. 157: 549–559. 2000. [DOI] [PMC free article] [PubMed] [Google Scholar]
- 7.Sell S, and Dunsford HA. Evidence for the stem cell origin of hepatocellular carcinoma and cholangiocarcinoma. Am J Pathol. 134: 1347–1363. 1989. [PMC free article] [PubMed] [Google Scholar]
- 8.Xiang S, Dong HH, Liang HF, He SQ, Zhang W, Li CH, Zhang BX, Zhang BH, Jing K, Tomlinson S, van Rooijen N, Jiang L, Cianflone K, and Chen XP. Oval cell response is attenuated by depletion of liver resident macrophages in the 2-AAF/partial hepatectomy rat. PLoS ONE. 7: e35180 2012; DOI . [DOI] [PMC free article] [PubMed] [Google Scholar]
- 9.Shupe T, and Petersen BE. Evidence regarding a stem cell origin of hepatocellular carcinoma. Stem Cell Rev. 1: 261–264. 2005. [DOI] [PubMed] [Google Scholar]
- 10.Hickling KC, Hitchcock JM, Chipman JK, Hammond TG, and Evans JG. Induction and progression of cholangiofibrosis in rat liver injured by oral administration of furan. Toxicol Pathol. 38: 213–229. 2010. [DOI] [PubMed] [Google Scholar]
- 11.Ren P, Silberg DG, and Sirica AE. Expression of an intestine-specific transcription factor (CDX1) in intestinal metaplasia and in subsequently developed intestinal type of cholangiocarcinoma in rat liver. Am J Pathol. 156: 621–627. 2000. [DOI] [PMC free article] [PubMed] [Google Scholar]
- 12.Sirica AE. Role of ErbB family receptor tyrosine kinases in intrahepatic cholangiocarcinoma. World J Gastroenterol. 14: 7033–7058. 2008. [DOI] [PMC free article] [PubMed] [Google Scholar]
- 13.Luwor RB, Baradaran B, Taylor LE, Iaria J, Nheu TV, Amiry N, Hovens CM, Wang B, Kaye AH, and Zhu HJ. Targeting Stat3 and Smad7 to restore TGF-β cytostatic regulation of tumor cells in vitro and in vivo. Oncogene. 32: 2433–2441. 2013. [DOI] [PMC free article] [PubMed] [Google Scholar]
- 14.Tebbutt N, Pedersen MW, and Johns TG. Targeting the ERBB family in cancer: couples therapy. Nat Rev Cancer. 13: 663–673. 2013. [DOI] [PubMed] [Google Scholar]
- 15.Yoshikawa D, Ojima H, Iwasaki M, Hiraoka N, Kosuge T, Kasai S, Hirohashi S, and Shibata T. Clinicopathological and prognostic significance of EGFR, VEGF, and HER2 expression in cholangiocarcinoma. Br J Cancer. 98: 418–425. 2008. [DOI] [PMC free article] [PubMed] [Google Scholar]
- 16.Xu L, Hausmann M, Dietmaier W, Kellermeier S, Pesch T, Stieber-Gunckel M, Lippert E, Klebl F, and Rogler G. Expression of growth factor receptors and targeting of EGFR in cholangiocarcinoma cell lines. BMC Cancer. 10: 302 2010. [DOI] [PMC free article] [PubMed] [Google Scholar]
- 17.Kamran MZ, Patil P, and Gude RP. Role of STAT3 in cancer metastasis and translational advances. Biomed Res Int. 2013: 421821 2013. [DOI] [PMC free article] [PubMed] [Google Scholar]
- 18.Isomoto H, Mott JL, Kobayashi S, Werneburg NW, Bronk SF, Haan S, and Gores GJ. Sustained IL-6/STAT-3 signaling in cholangiocarcinoma cells due to SOCS-3 epigenetic silencing. Gastroenterology. 132: 384–396. 2007. [DOI] [PMC free article] [PubMed] [Google Scholar]
- 19.Han C, Demetris AJ, Stolz DB, Xu L, Lim K, and Wu T. Modulation of Stat3 activation by the cytosolic phospholipase A2alpha and cyclooxygenase-2-controlled prostaglandin E2 signaling pathway. J Biol Chem. 281: 24831–24846. 2006. [DOI] [PubMed] [Google Scholar]
- 20.Chan KS, Carbajal S, Kiguchi K, Clifford J, Sano S, and DiGiovanni J. Epidermal growth factor receptor-mediated activation of Stat3 during multistage skin carcinogenesis. Cancer Res. 64: 2382–2389. 2004. [DOI] [PubMed] [Google Scholar]
- 21.Toyoda M, Hashimoto N, Tokita K, Goldstein BJ, Yokosuka O, Kanatsuka A, Suzuki Y, and Saito Y. Increased activity and expression of MAP kinase in HCC model rats induced by 3′-methyl-4-dimethylamino-azobenzene. J Hepatol. 31: 725–733. 1999. [DOI] [PubMed] [Google Scholar]
- 22.Boyd H, McAfee DA, and Rubin JJ. A study of cyclic nucleotide metabolism and the histology of rat liver during 3′-methyl-4-dimethylamino-azobenzene carcinogenesis. II. Cyclic AMP metabolism. Tissue Cell. 10: 477–494. 1978. [DOI] [PubMed] [Google Scholar]
- 23.Yu XT, Zhu SN, Xu ZD, Hu XQ, Zhu TF, Chen JQ, and Lu SL. Roles of EGFR-Stat3 signal pathway in carcinogenesis of experimental hepatoma in rats. J Cancer Res Clin Oncol. 133: 145–152. 2007. [DOI] [PMC free article] [PubMed] [Google Scholar]
- 24.Zhong Z, Wen Z, and Darnell JE, Jr . Stat3 and Stat4: members of the family of signal transducers and activators of transcription. Proc Natl Acad Sci USA. 91: 4806–4810. 1994. [DOI] [PMC free article] [PubMed] [Google Scholar]
- 25.Roskams T. Liver stem cells and their implication in hepatocellular and cholangiocarcinoma. Oncogene. 25: 3818–3822. 2006. [DOI] [PubMed] [Google Scholar]
- 26.Jang S, Chun SM, Hong SM, Sung CO, Park H, Kang HJ, Kim KP, Lee YJ, and Yu E. High throughput molecular profiling reveals differential mutation patterns in intrahepatic cholangiocarcinomas arising in chronic advanced liver diseases. Mod Pathol. 27: 731–739. 2014. [DOI] [PubMed] [Google Scholar]
- 27.Zhou Q, Gong Y, Huang F, Lin Q, Zeng B, Li Z, and Chen R. Expression levels and significance of nuclear factor-κB and epidermal growth factor receptor in hepatolithiasis associated with intrahepatic cholangiocarcinoma. Dig Surg. 30: 309–316. 2013. [DOI] [PubMed] [Google Scholar]
- 28.Gu MJ, and Choi JH. Clinicopathological significance of E-cadherin, β-catenin and epidermal growth factor receptor expression in intrahepatic cholangiocarcinoma. Hepatogastroenterology. 59: 1241–1244. 2012. [DOI] [PubMed] [Google Scholar]
- 29.Hoffmann AC, Goekkurt E, Danenberg PV, Lehmann S, Ehninger G, Aust DE, and Stoehlmacher-Williams J. EGFR, FLT1 and heparanase as markers identifying patients at risk of short survival in cholangiocarcinoma. PLoS ONE. 8: e64186 2013. [DOI] [PMC free article] [PubMed] [Google Scholar]
- 30.Yoshikawa D, Ojima H, Kokubu A, Ochiya T, Kasai S, Hirohashi S, and Shibata T. Vandetanib (ZD6474), an inhibitor of VEGFR and EGFR signalling, as a novel molecular-targeted therapy against cholangiocarcinoma. Br J Cancer. 100: 1257–1266. 2009. [DOI] [PMC free article] [PubMed] [Google Scholar]
- 31.Sohal DP, Mykulowycz K, Uehara T, Teitelbaum UR, Damjanov N, Giantonio BJ, Carberry M, Wissel P, Jacobs-Small M, O’Dwyer PJ, Sepulveda A, and Sun W. A phase II trial of gemcitabine, irinotecan and panitumumab in advanced cholangiocarcinoma. Ann Oncol. 24: 3061–3065. 2013. [DOI] [PubMed] [Google Scholar]
- 32.Yeoh GC, Ernst M, Rose-John S, Akhurst B, Payne C, Long S, Alexander W, Croker B, Grail D, and Matthews VB. Opposing roles of gp130-mediated STAT-3 and ERK-1/ 2 signaling in liver progenitor cell migration and proliferation. Hepatology. 45: 486–494. 2007. [DOI] [PubMed] [Google Scholar]
- 33.Plum W, Tschaharganeh DF, Kroy DC, Corsten E, Erschfeld S, Dierssen U, Wasmuth H, Trautwein C, and Streetz KL. Lack of glycoprotein 130/signal transducer and activator of transcription 3-mediated signaling in hepatocytes enhances chronic liver injury and fibrosis progression in a model of sclerosing cholangitis. Am J Pathol. 176: 2236–2246. 2010. [DOI] [PMC free article] [PubMed] [Google Scholar]
- 34.Leeman-Neill RJ, Seethala RR, Singh SV, Freilino ML, Bednash JS, Thomas SM, Panahandeh MC, Gooding WE, Joyce SC, Lingen MW, Neill DB, and Grandis JR. Inhibition of EGFR-STAT3 signaling with erlotinib prevents carcinogenesis in a chemically-induced mouse model of oral squamous cell carcinoma. Cancer Prev Res (Phila). 4: 230–237. 2011. [DOI] [PMC free article] [PubMed] [Google Scholar]
- 35.Jusakul A, Yongvanit P, Loilome W, Namwat N, and Kuver R. Mechanisms of oxysterol-induced carcinogenesis. Lipids Health Dis. 10: 44 2011. [DOI] [PMC free article] [PubMed] [Google Scholar]