

Abstract
Cocaine dependence is a complex neuropsychiatric disorder manifested as dysregulation of multiple behavioral, emotional, and cognitive constructs. Neuroimaging studies have begun to identify specific neurobiological circuit impairments in cocaine-dependent (CD) individuals that may underlie these symptoms. However, whether, where, and how the interactions within and between these circuits are disrupted remain largely unknown. We used resting-state fMRI and modularity network analysis to identify brain modules of a priori interest (default-mode network [DMN], salience network [SN], executive control network [ECN], medial temporal lobe [MTL], and striatum) in 47 CD and 47 matched healthy control (HC) participants and explored alterations within and between these brain modules as a function of addiction. At the module level, intermodule connectivity decreased between DMN and SN in CD. At the nodal level, several regions showed decreased connections with multiple modules in CD: the rostral anterior cingulate connection strength was reduced with SN and MTL; the posterior cingulate had reduced connections with ECN; and the bilateral insula demonstrated decreased connections with DMN. Furthermore, alexithymia, a personality trait previously associated with addiction, correlated negatively with intramodule connectivity within SN only in cocaine users. Our results indicate that cocaine addiction is associated with disrupted interactions among DMN, MTL, and SN, which have been implicated, respectively, in self-referential functions, emotion and memory, and coordinating between internal and external stimuli, providing novel and important insights into the neurobiological mechanisms of cocaine addiction.
Keywords: brain circuits, cocaine addiction, modularity analysis, network interactions, resting fMRI
Introduction
Cocaine dependence presents with multiple emotional and cognitive impairments along with impaired behavioral and social interactions (Goldstein and Volkow, 2002). Neuroimaging studies using functional connectivity have begun to identify altered relationships within and between specific brain regions/circuits associated with cocaine dependence (Gu et al., 2010; Koob and Volkow, 2010; Tomasi et al., 2010; Sutherland et al., 2012; Ding and Lee, 2013; Konova et al., 2013; McHugh et al., 2013). To date, studies have used seed-based or independent components analyses to focus on individual regions or networks based on findings from preclinical and task-induced activation studies. Because cocaine dependence involves multiple behavioral dysfunctions (Hasin et al., 2006), likely relating to dysregulation within and between multiple brain circuits, a network analysis approach (Bullmore and Sporns, 2009; Menon, 2011) that incorporates all circuits of interest within a single analytical framework is likely better able to account for the behavioral complexity associated with the disease and place neurobiological findings within a larger context unavailable when using a seed approach to improve interpretability (Menon, 2011; Sutherland et al., 2012).
Although the mesolimbic dopamine system underlies the reinforcing effects of abused drugs (Everitt and Robbins, 2005; Nestler, 2005), it has long been recognized (e.g., Oades and Halliday, 1987) that this system does not act in isolation but rather participates in numerous functionally distinct circuits. Large-scale brain networks have been consistently identified using various functional connectivity approaches, with three networks in particular that demonstrate good reproducibility and have been suggested to contribute to various neuropsychiatric disorders, including substance dependence (Menon, 2011). The default mode network (DMN) is involved in self-referential functions and tends to deactivate during cognitive task performance (Raichle et al., 2001; Buckner et al., 2008). The frontoparietal executive control network (ECN) is associated with cognitive functions, such as working memory and decision making, whereas the salience network (SN, including dorsal anterior cingulate cortex [dACC] and anterior insula) has been implicated in directing attention to the most current homeostatically salient events (Seeley et al., 2007). Individual components within these large-scale networks have been implicated in learning the cue and context associations that support addiction (Everitt and Robbins, 2005).
To better understand connectivity differences in cocaine dependence within a network framework, we conducted a modularity analysis on resting-state fMRI data (Power et al., 2011; Sporns, 2014). From the modules identified, we selected those likely related to cocaine dependence based on the extant literature to examine further. We hypothesized that (1) cocaine-dependent (CD) subjects would have altered interactions within and/or between modules related to motivational, affective, cognitive and interoceptive functions; and (2) alexithymia, a personality trait associated with addiction and characterized by difficulty identifying and describing one's feelings and previously associated with insula and anterior cingulate functions, would predict individual differences in functional interactions within the SN in CD subjects.
Materials and Methods
Subjects.
Data from 47 active, non–treatment-seeking CD (36 males and 11 females) and 47 healthy control (HC, 30 males 17 females) individuals were included in the study. Potential subjects were assessed with a comprehensive history and physical examination, general laboratory panel, a computerized SCID with clinical interview follow-up, and a guided interview assessing substance use. Subjects were excluded if they had any major illness, history of neurological or psychiatric disorders other than current dependence on cocaine or nicotine (i.e., meeting full criteria within the past month). In an attempt to control for the potential influence of other drugs and alcohol in the CD group, inclusion criteria for the HC group allowed some current or prior substance use, but no current or past DSM-IV dependence (except nicotine). On the day of scanning, all subjects were assessed for recent alcohol use with breathalyzer and for other recent drug use with urine drug screen for amphetamine, barbiturates, benzodiazepines, cocaine, methadone, PCP, tricyclic antidepressants, and THC. Participants with a positive breathalyzer were rescheduled or discharged from the study. Urine screen-positive participants underwent a neuromotor assessment and were rescheduled if they showed signs of acute intoxication. Cigarettes smokers were allowed to smoke ad libitum before scanning. The cocaine urine screen results were used to assess the impact of any recent cocaine use in the absence of acute intoxication on our connectivity results. Written consents were obtained from all participants before study enrollment. All the protocols contributing data to this analysis were approved by the Institutional Review Board of the National Institute on Drug Abuse Intramural Research Program.
Data acquisition.
Resting-state fMRI data were collected on a 3-T Siemens Allegra MR scanner (Siemens). Head movement was minimized by using a foam helmet individually made for each participant. During the 6 min resting scan, participants were instructed to keep still and not to think of anything in particular. Thirty-nine 4-mm-thick AC-PC parallel slices without interslice gap were prescribed to cover the whole brain. The resting data were acquired using a single-shot gradient-echo echo-planar imaging sequence with repetition time of 2 s, echo time of 27 ms, flip angle of 77°, field of view of 220 × 220 mm, and an in-plane resolution of 3.44 × 3.44 mm. High-resolution anatomical images were acquired using a 3D MPRAGE T1-weighted sequence with TR of 2.5 s, TE of 4.38 ms, flip angle of 7°, and a voxel size of 1 × 1×1 mm.
Data processing.
Data preprocessing was conducted in AFNI (Cox, 1996) and included slice-timing correction, motion correction, quadratic detrending, and low-pass temporal filter with a cutoff frequency of 0.1 Hz to retain the low-frequency fluctuation components that contribute to functional connectivity (Biswal et al., 1995; Lowe et al., 1998). Resting data were then spatially normalized to standard Talairach space with a resampled resolution of 3 × 3 × 3 mm and spatially smoothed with a 6 mm Gaussian kernel. To further align the resting data across subjects, an unbiased groupwise nonlinear registration method was used to deform each spatially smoothed image to an implicit group reference image based on a small deformation elastic model (Geng et al., 2009). Nonspecific variance due to physiological noise was removed by regression of nuisance variables, including head motion, signal averaged over ventricle, white matter, and whole brain. Given that global signal regression is still controversial (Fox et al., 2009; Murphy et al., 2009; Saad et al., 2012), we repeated our analyses without global signal regression, and all our results remained qualitatively unchanged.
Network construction.
For each subject, we constructed a voxelwise brain functional network as follows. The time course from each voxel within the gray matter mask was extracted, and the Pearson correlation between any pair of voxels was calculated to form an N × N correlation matrix (N is the number of gray matter voxels, here N = 12,884). Of note, because the removal of global signal mathematically induces negative correlations (Fox et al., 2009; Murphy et al., 2009; Saad et al., 2012) and most network algorithms cannot handle negative edges, we set the negative correlations to zero and restricted our analysis to only positive correlations. To remove weak correlations that might arise from signal noise, we applied a threshold on the brain network so that only the correlations whose corresponding p values passed a statistical threshold (p < 0.05) were retained. The false discovery rate method was used to correct for multiple comparisons by setting the false discovery rate level to 0.001. Using this threshold, we constructed a binary connection matrix, whose element was 1 if its corresponding correlation value was statistically significant and 0 otherwise. Group-averaged brain networks were generated by first averaging the binarized subject-specific networks and selecting all connections that were present in at least 50% of the group of subjects.
Modular analysis.
Modules refer to groups of nodes that are highly connected with each other but less connected with other nodes in a network. The modularity Q quantifies the efficacy of partitioning a network into modules by evaluating the difference between the actual number of intramodule connections and the expected number for the same modules in a randomized network (Newman, 2004). The objective of a modular detection procedure is to find a specific partition that maximizes the modularity Q. In theory, Q ranges between 0 and 1 (Newman and Girvan, 2004). Q approaches to 0 when nodes are randomly partitioned or all nodes belong to the same module, whereas higher Q indicates significant modular structure deviating from random networks. In practice, the modularity of a network with a strong modular structure typically ranges from 0.3 to 0.7 (Newman and Girvan, 2004). In the current study, we adopted a random-walk-based algorithm for module detection based on its ability to handle very large networks and its successful performance in benchmark tests (Danon et al., 2005; Pons et al., 2005). Also, this algorithm is deterministic and so it will always give the same partition no matter how many times is has been performed (Pons et al., 2005). This algorithm offers two quality functions for community detection: the modularity Q and the increase ratio ηk, of which the latter is proposed to overcome the resolution limit of modularity optimization that may fail to detect modules smaller than a scale (Pons et al., 2005; Fortunato and Barthélemy, 2007). In our study, we chose to use the modularity Q to identify modular structures because the modules it produced, especially the modules in which we are particularly interested, have been already well mapped and are spatially similar with those identified using other methods (e.g., group independent component analysis, gICA) by visual inspection.
We conducted the modular detection procedure for each subject to obtain the subject-specific maximal modularity Q. We also performed modular detection procedure on group-averaged networks of the cocaine and control cohorts separately. To quantify the similarity of modular structure between the two groups, we computed the variation of information, an information-theoretic-based measure of distance between partitions (Meilă, 2007).
Module assignment provides the basis for assessing the patterns of intramodule and intermodule connectivity at both module and nodal levels. At the module level, we calculated intramodule connectivity and intermodule connectivity as follows:
Intramodule connectivity (Cs) of module s is defined as follows:
 |
here, Ns is the number of nodes within module s, and εi,j are the existing edges within module s.
Intermodule connectivity (Cs,t) between module s and module t is defined as follows:
 |
where Ns is the number of nodes within module s, whereas Nt is the number of nodes within module t, and εi,j are the existing edges between module s and module t.
At the nodal level, two standard network metrics were calculated as follows (Guimera and Amaral, 2005):
Normalized within-module degree (WD):
 |
where ki is the number of intramodule connections of a node i within module s and ks is the average number of intramodule connections of all nodes in module s. σs is the SD of the intramodule connection numbers of all nodes in module s.
Participation coefficient (PC):
 |
where NM is the number of modules and kis is the number of connections between the node i and module s. ki is the total number of connections of node i to all other nodes in the NM modules.
As a control analysis, we also computed the above network metrics using another modular mask, which was generated from the average connectivity matrix over all subjects of both groups, and the results were consistent with those reported in the main text.
Head motion.
To moderate the effects of head motion on estimates of functional connectivity (Power et al., 2012; Satterthwaite et al., 2012; Van Dijk et al., 2012), we first calculated the average root mean square of head motion and found no significant between-group difference (t = −1.18, p = 0.24). The average root mean square of head movement for both groups was considerably below the cutoff of 1 mm (one-third of a voxel's width, average root mean square = 0.13 for CD, 0.16 for HC). Second, we censored volumes within each subject's fMRI time-series that were associated with sudden head motion. For each subject, fMRI volume was censored if its frame-wise displacement was >0.35. Subjects with <125 frames (∼5 min) of data remaining after motion censoring were excluded (1 CD excluded). There was no group difference in the number of remaining data points after motion censoring (t = −0.68, p = 0.49).
Statistical analysis.
Between-group differences in network measures were assessed by two-sample t tests. For module-wise measures (i.e., intramodule/intermodule connectivity), the significance threshold was set at p < 0.003 (0.05/15: 5 intra plus 10 intermodule statistical tests) using a Bonferroni correction method for multiple comparisons. For nodal-wise within-module degree and participation coefficient, the group difference maps were first thresholded with a voxelwise significance of p < 0.01, followed by multiple comparison correction using a cluster size threshold derived from Monte Carlo simulations as implemented in AFNI program “3dClustSim.” The smoothness for the Monte Carlo simulation was estimated using AFNI program “3dFWHMx” from the residual time-series of the regression analysis. The estimated smoothness values for each subject were averaged to compute a single smoothness value (mean = 10.3 mm, SD = 0.48 mm). This resulted in a minimum cluster size threshold of 20 voxels to reach a cluster level significance of p < 0.05.
To investigate the relationship between defined networks and cocaine use characteristics, multiple linear regression analyses were performed between module-wise network measures and cocaine use behaviors: years of cocaine use and current cocaine use (in dollars spent/week). Significance threshold was set at p < 0.0017 (0.05/30: 15 modular-wise metrics × 2 use characteristics) by Bonferroni method for multiple tests correction. Furthermore, given that alexithymia has been associated with drug use severity and relapse propensity in addicted individuals, which might be mediated by the functional interactions of its underlying brain structures of the key SN regions of the insular and ACC (Sutherland et al., 2013), we correlated the intramodule connectivity within the SN module with the Toronto Alexithymia Scale (TAS-20) scale, which is a psychometrically valid measurement of alexithymia that includes three subscales: difficulty identifying feelings (DIF), difficulty describing one's feelings (DDF), and the presence of externally oriented thinking (EOT) (Bagby et al., 1994a, b; Haviland and Reise, 1996). Bonferroni-corrected significance threshold was set at p < 0.0125 (0.05/4: 3 TAS-20 subscales and total scale). For the nodal-wise network metrics (WD and PC), we estimated these relationships using an ROI approach. Specifically, we extracted averaged metrics from those ROIs showing significant group differences and performed the regression analysis against cocaine use characteristics and TAS-20 scores. Significance threshold was set at p < 0.002 (0.05/24: 4 ROIs × 6 behavior characteristics) by Bonferroni method for multiple tests correction.
To mitigate possible effects of age, gender, IQ (WAIS vocabulary score), education years, and smoking status, we included these factors as covariates in group comparisons and correlation analyses. Additionally, to control for the possible influences of any residual head motion (after censoring) on group-related results, we also included individual mean motion estimates (i.e., mean frame-wise displacement) as a nuisance covariate.
Results
Demographics
CD and HC individuals (n = 47 each) were well matched for gender, age, WAIS vocabulary score, and education years. All but 14 CD and 18 HC subjects reported regular use of tobacco, and the distribution of heavy (>10 cigarettes per day) and light (≤10 cigarettes per day) smokers were well matched between the two groups (Table 1). On the day of scanning, the urine screens of 22 CDs were negative for all the drugs tested. There were 21 CD individuals showing positive urine results for cocaine, one of which was also positive for THC. One CD participant was urine positive for amphetamine and THC, one for THC only; urine data from 2 CD participants were unavailable.
Table 1.
Demographic Characteristics
| CD (n = 47) | HC (n = 47) | Group test | ||
|---|---|---|---|---|
| Age (years) | 40 ± 5.87 | 38 ± 7.68 | t = 1.51 | p = 0.14 |
| Education (years) | 12.8 ± 1.24 | 13.3 ± 1.84 | t = −1.38 | p = 0.17 |
| WAIS vocabulary score | 54 ± 8.85 | 56 ± 8.60 | t = −1.02 | p = 0.31 |
| Gender (male/famale) | 36/11 | 30/17 | x2 = 1.83 | p = 0.17 |
| Race (African American/Caucasian/Asian/Mixed) | 39/6/0/2 | 35/10/2/0 | x2 = 5.11 | p = 0.16 |
| Current cocaine usage ($/week) | $224 ± 161 | — | — | — |
| Years of cocaine use | 13.2 ± 6.4 | — | — | — |
| DSM-IV cocaine dependence | 4.6 ± 1.3 | — | — | — |
| Smoking status (Non-smoker/light-smoker/heavy-smoker) | 14/22/11 | 18/17/12 | x2 = 1.18 | p = 0.55 |
| TAS-20 | ||||
| DIF | 12.02 ± 5.85 | 8.57 ± 5.85 | t = 3.72 | p = 0.0003 |
| DDF | 10.15 ± 3.90 | 8.93 ± 3.91 | t = 1.56 | p = 0.12 |
| EOT | 18.79 ± 4.38 | 17.19 ± 1.37 | t = 1.73 | p = 0.08 |
| Total | 40.96 ± 10.13 | 34.69 ± 10.12 | t = 3.38 | p = 0.001 |
HC, Healthy control group; CD, cocaine dependent group; Toronto Alexithymia Scale (TAS-20); DIF, difficulty identifying feelings; DDF, difficulty describing one's feelings (DDF); EOT, externally oriented thinking.
To assess the impact of recent cocaine use, the CD group was divided into those who presented on the scan day with a cocaine-positive urine and those with a cocaine-negative urine. The cocaine-positive group consisted of 20 CDs positive for cocaine only and one CD positive for cocaine and THC. The cocaine-negative group included 23 CDs negative for all drugs tested and one CD urine positive for THC only, which added balance to the cocaine-positive group. There were no significant differences between the two groups on age, gender, race, education years, IQ, years of cocaine use, and current cocaine use.
The 46 HC and 44 CD subjects were in the clinically normal range of total TAS-20 score (≤60) (Bagby et al., 1994b), although the total TAS-20 score and the DIF subscale in CDs were significantly higher than those in HCs (Table 1). TAS-20 scores from 1 HC participant were not available.
Modular structures of functional brain networks
Module analysis found that both groups were modular (modularity Q = 0.450 ± 0.032 for CDs and 0.452 ± 0.035 for HCs). There was no significant between-group difference in Q (t = −0.19, p = 0.84). We then conducted modular analysis on group mean networks for CD and HC subjects to summarize network modular structure over subjects within each group. Modular detection revealed 15 modules in the HC group and 16 modules in the CD group, most of which have been previously identified using other analytical methods (e.g., group independent component analysis) and associated with specific brain functions (Fig. 1). The modular partitions were very similar between the two groups, which resulted in a low variation of information level of 0.185. We then visually identified the five a priori modules of interest in each group: the DMN, SN, ECN, MTL, and striatum (ST). As illustrated in Fig. 2, the DMN module is composed of regions of the rostral ACC (rACC), mPFC, superior frontal cortex, inferior temporal lobe, PCC/precuneus (PCu), and inferior parietal cortex. The SN module includes regions of dorsal ACC and bilateral insula. The ECN module includes primarily the bilateral frontal and parietal cortices. The MTL module consists of regions of the hippocampal gyrus and amygdala. Finally, the ST module consisted of the caudate, putamen, and lentiform nucleus. Of note, hippocampus is sometimes considered part of DMN, whereas amygdala and nucleus accumbens have been included within the SN (Buckner et al., 2008; Menon, 2011). In our analysis, hippocampus and amygdala formed a separate MTL module, whereas nucleus accumbens was incorporated within an independent ST module. We included in our analyses the overlapped spatial content of these modules between the two groups, which resulted in a common modular spatial map for both groups. This map was then used as a mask to compute the following modular network measures for each subject.
Figure 1.
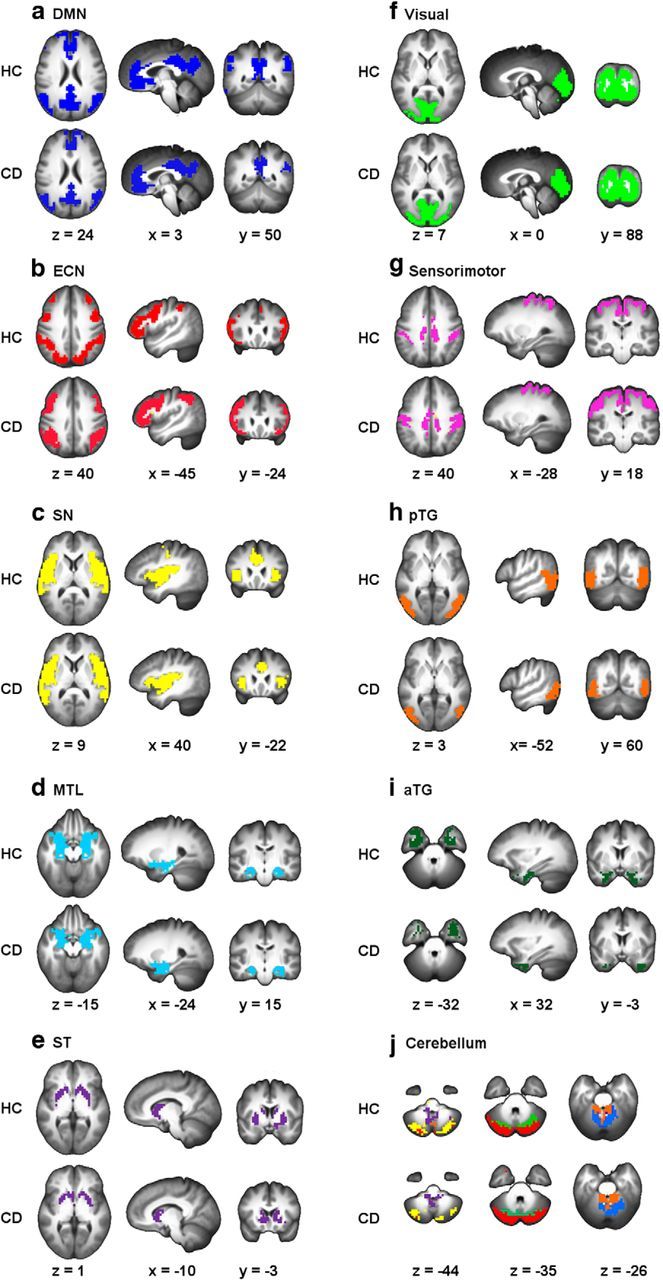
Modularity analyses on group average networks detected 15 modules in the HC group and 16 modules in the CD group. These modules included 5 modules that are shown to be related to cocaine addiction: DMN (a), ECN (b), SN (c), MTL (d), and ST (e) as well as modules in visual (f), sensorimotor (g), pTG (h), and aTG (i) areas. We also found that the cerebellum was divided into six modules in the HC group and seven modules in the CD group (j). pTG, Posterior temporal gyrus; aTG, anterior temporal gyrus.
Figure 2.

Illustration of brain modules of interest: DMN (yellow), SN (orange), ECN (green), MTL (pink), and ST (purple). Modules were defined based on the spatial map overlap between the CD and HC groups.
Intramodule and intermodule connectivity
The above module assignment provides the basis for assessing the patterns of intramodule and intermodule connectivity at both modular and nodal levels. Figure 3A, B shows the intraconnectivity and interconnectivity for all five a priori modules. For both groups, each of the five modules showed high intramodule connectivity but relatively low intermodule connectivity (there was no significant difference between the two cocaine subgroups in any network metrics). When examining differences in module connectivity between the two groups, we observed a significantly reduced intermodule connectivity between SN and DMN (t = −3.2, df = 92, p = 0.002) in the CD group compared with the HC (Fig. 3C,D), and a trend of reduced intermodule connectivity between DMN and MTL module (t = −2.7, df = 92, p = 0.008). Although there was no significant difference in the overall network connectivity (i.e., the total sum of all connections within the network) between the two groups (t = −1.52, df = 92, p = 0.13), to rule out its potential impact, we used overall network connectivity as a covariate and found that the reduction in SN-DMN connectivity in CD group remained significant (t = −3.3, df = 92, p = 0.0014). We also conducted group comparisons in module connectivity with respect to four other canonical brain networks, including the visual, sensorimotor, and anterior and posterior temporal networks, and found no significant difference between the two groups in any of the intramodule or intermodule connectivity regarding these four brain networks (all p values >0.05), which indicates that these four brain networks are not likely to be relevant to the cocaine addiction.
Figure 3.

Intramodule and intermodule connectivity for HC (A) and CD (B) groups. C, Group differences (CD − HC) in intramodule and intermodule connectivity. D, Bar plots for significant differences in intermodule connectivity between DMN and SN, and between DMN and MTL. **pcorrected < 0.05. *puncorreted < 0.05.
At the nodal level, we characterized the role of each functional network node (i.e., voxel) by measuring WD and PC. Figure 4A, B shows the spatial distribution of WD and PC for the HC group. For both HC and CD groups, we identified the module hubs with high WD (more than mean ± SD), which included the PCC/PCu and angular gyrus in DMN, bilateral insula in SN, middle frontal and superior parietal cortices in ECN, hippocampus/amygdala in MTL, and putamen/lentiform nucleus in ST. We further divided the module hubs into two categories based on their PC: provincial hubs (PC ≤ 0.25), having the most connections within their own modules, which were located primarily in the PCC/PCu and connector hubs (PC > 0.25), which have connections to multiple modules, comprised the remaining hub regions.
Figure 4.
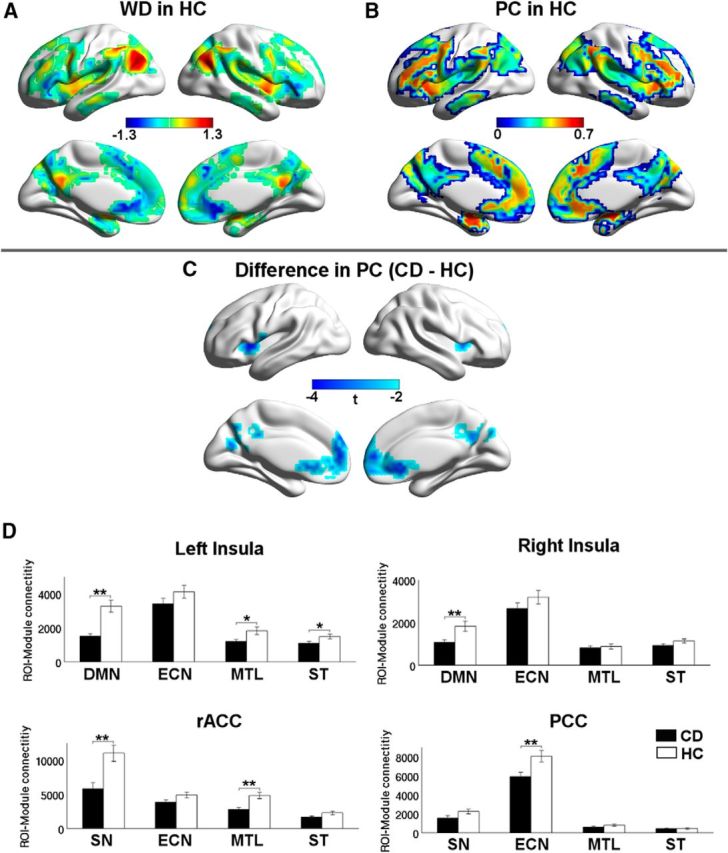
Maps of nodal roles. A, WD z-score map averaged across the HC group. B, PC map averaged across the HC group. C, Regions of rACC, PCC, and bilateral insula show decreased participation coefficient in the CD group. D, Differences in average connectivity between the regions in C (rACC, PCC, and bilateral insula) and the other four a priori modules. **pcorrected < 0.05. *puncorreted < 0.05.
Group comparisons at the nodal level revealed that, compared with HCs, there were no significant differences in WD between HC and CD individuals. However, CD participants showed significantly decreased participation coefficient (pcorrected < 0.05) in the rACC and PCC (DMN components), and bilateral insula (SN components) (Fig. 4C). Given the lack of WD differences, these likely reflect fewer connections from these regions to other modules in CD. To further assess this, we next took each identified region of reduced PC as a seed ROI and calculated the ROI-module connectivity by summing the number of connections between every voxel in the ROI and those in each of the other four modules. Our results revealed that CD participants had significantly decreased average connectivity between the rACC and the SN and MTL modules; between the PCC and the ECN module; and between the bilateral insula and the DMN (Fig. 4D). Trends of decreased average connectivity were also observed between the left insula and the MTL and striatum.
Network relationships to drug use and TAS-20
For the module-level network metrics, no significant correlations with any drug use parameters were found in the CD group. However, we observed significant negative correlation between the DDF subscale in the TAS-20 and the intramodule connectivity in the SN of the CD (p = 0.004) but not HC group (p = 0.42) (Fig. 5). There is no significant difference of variance in DDF between the cocaine and control group (F = 1.25, p = 0.48), and the correlations between DDF and SN connectivity are significantly different between the two groups (z = 2.03, p = 0.042). We also correlated the TAS-20 scores with the intramodule connectivity of the other four interested brain networks (i.e., DMN, ECN, MTL, and ST). No significant correlation was found in any of the four brain networks in either group (all p values >0.05), which demonstrates that the salience network might be selectively related to alexithymia in cocaine-dependents. For the nodal-level network metrics, focusing on the regions that have shown between-group differences in PC, we found a trend of negative correlations between current cocaine use and the averaged PC values within the right insula (p = 0.047) and the left insula (p = 0.077).
Figure 5.
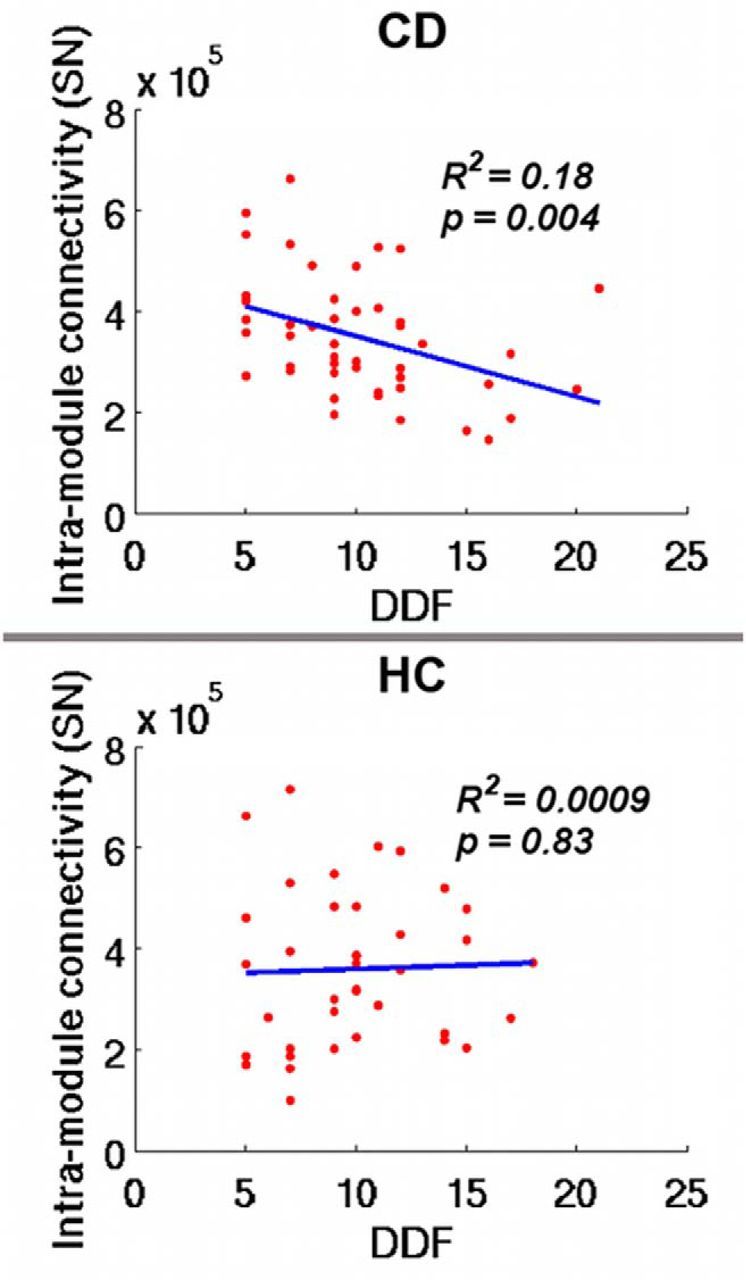
Relationship between TAS-20 subscale DDF and intramodule connectivity of the SN in CD (top) and HC (bottom) subjects.
Discussion
Using network modularity analysis in a well-matched and relatively large sample of cocaine-dependent and healthy control participants, we identified a modular organization of brain functional networks in both groups that, in general, is in accordance with previous findings of functional brain networks (He et al., 2009; Power et al., 2011). Because of their hypothesized role in CD, we selected five modules implicated in computing reward, emotional, cognitive, and interoceptive processes (DMN, SN, ECN, MTL, and ST) to elucidate functional network differences between groups. Compared with control participants, CD individuals exhibited significantly decreased intermodule connectivity between the DMN and SN modules. Moreover, the rACC (a key component of the DMN) showed decreased participation coefficient in CD and reduced connectivity to the SN module, whereas insula (a key component of the SN) showed reduced PC in CD and reduced connectivity to the DMN, pointing to specific subregions within these modules that may be responsible for the intermodule result. Rostral ACC (rACC) and PCC (also a key DMN component showing reduced PC in CD) demonstrated reduced connectivity to the MTL module. Both of these DMN components (rACC and PCC) also showed decreased average connectivity to the ECN module, although there was no intermodular connectivity difference between DMN and ECN associated with cocaine addiction as a whole. In addition, the bilateral insula were also less connected to the DMN module and their PCs showed a trend level negative relationship to intensity of current use of cocaine (dollars/week). Finally, we found a significant negative relationship between the trait alexithymia TAS-20 subscale reflecting difficulty identifying and describing one's feelings, the DDF, and the intramodule connectivity within the SN module only in CD subjects.
Recently, a triple network model proposed by Menon (2011) and adapted to addictive disorders by Sutherland et al. (2012) suggested a putative role of the SN in biasing dynamic switching between the DMN (internally oriented processing) and the ECN (externally oriented executive functioning) based on attribution of saliency to internal and external stimuli. In the context of this model, we observed alterations primarily between SN and DMN. In addition to reduced connectivity at the modular level, insula (a connector hub in SN) had reduced connectivity to DMN in CD, whereas rACC, a portion of the DMN that has been implicated in regulating emotional functions (Etkin et al., 2006), was less connected to SN suggesting compromised SN function in CD particularly in relation to the DMN. We did not find alterations in SN connectivity to ECN, as might be expected based on the triple network model, but did find reduced connectivity directly from two important DMN regions, rACC and PCC, to ECN. PCC, especially dorsal PCC, has been previously suggested to have a role in regulating cognition (Hampson et al., 2006; Mohanty et al., 2008; Leech et al., 2012; Li et al., 2013). Rostral ACC has been implicated in regulating emotions in the service of completing cognitive tasks (Etkin et al., 2006). Thus, our finding of DMN regions interacting less with ECN may relate to cognitive difficulties seen in CD. It should be noted that our modules differ slightly from those networks described by Menon (2011) and identified using a different analytical approach in that hippocampus (part of Menon's DMN) and amygdala (part of Menon's SN) formed a module of their own (MTL) and nucleus accumbens (part of Menon's SN) formed a separate module (ST) with the rest of striatum.
Numerous abnormalities in rACC in CD have been previously reported, including reduced gray matter density (Franklin et al., 2002) and more robust deactivation related to suppression of cue-induced craving (Goldstein et al., 2009). Our finding of decreased connectivity from rACC to MTL is consistent with previous reports of reduced connectivity between medial frontal cortex and amygdala (Gu et al., 2010; Wang et al., 2010) and has been associated with early relapse risk (McHugh et al., 2014).
The insula is implicated in several of our findings. It is a connector hub for SN whose PC is reduced in CD, possibly in proportion to the intensity of current cocaine use (trend level result), suggesting that the difference seen may be a result of chronic cocaine use rather than a preexisting difference. Insula showed reduced connectivity with DMN, MTL, and ST. Abnormalities in insula activation (Garavan et al., 2000; Kaufman et al., 2003) and connectivity (Cisler et al., 2013; McHugh et al., 2013; Wisner et al., 2013) in CD are common in the literature. Insula has attracted considerable attention in addiction since Naqvi et al. (2007) first showed that damage to the insula, a key SN component, can result in a sudden and profound disruption of addiction to smoking. Although loss of all insula input may disrupt addictive behaviors by removing or vastly attenuating interoceptive signals of withdrawal that likely prompt seeking the next cigarette, inadequate integration of interoceptive signals in a dysregulated insula with other regions involved in a coordinated response to the internal and external environment may hamper optimal decision making in a given situation. Our results add to the growing body of literature implicating insula as having aberrant responses and interactions with other regions in CD and in other addictions.
Alexithymia, a personality trait incorporating an externally oriented cognitive style and characterized by difficulty identifying and describing one's feelings (Taylor and Bagby, 2004; Parker et al., 2008), in the context of addiction has been shown to mediate the relationship between negative emotionality and emotional arousal to substance use (Bonnet et al., 2013), greater substance use severity (Bruce et al., 2012; Saladin et al., 2012), and shows a relationship to the structure and/or function in the insula and anterior cingulate cortex (ACC), key SN regions (Paradiso et al., 2008; Reker et al., 2010; Goerlich-Dobre et al., 2014). The relationship we found between the TAS-20 DDF subscale and SN intramodule connectivity is similar to our previous findings in smokers where reduced resting-state functional connectivity strength between anterior insula and ventromedial PFC fully mediated a relationship between alexithymia and more intense cravings during nicotine withdrawal (Sutherland et al., 2013). Consistent with this result, the same relationship between connectivity and alexithymia was not seen in healthy controls. Alexithymia is associated with emotional processing in the insula (Kano et al., 2007; Karlsson et al., 2008) and ACC (Walter et al., 2011). Thus, our observation that CD individuals with reduced functional connections within the SN tend to exhibit greater trait alexithymia suggests that organizational disruptions within the SN may give rise to deficiencies in integrating sensations from the internal bodily milieu into coherent emotion experiences, which may, in turn, contribute to sustaining cocaine (and other drug) use, as consuming a drug may alleviate uncomfortable internal sensations without needing to identify an associated emotional state. While alexithymia is generally considered a stable personality trait that does not change over time (Picardi et al., 2005), there are data suggesting it may vary across the course of illness in substance use disorders (de Haan et al., 2012). Thus, finding these relationships only in drug-dependent individuals (CD and smokers) may reflect alterations in the relationship of SN function to alexithymia that are unique to dependence and warrant further exploration.
The bilateral insula, ACC, and PCC have been identified as highly connected hubs in previous anatomical and functional studies (Hagmann et al., 2008; Buckner et al., 2009; Tomasi and Volkow, 2010). We identify insula and PCC as hubs, and most of our findings relate to insula and PCC. Hubs are functionally valuable in integrating information across brain regions and are metabolically costly (Liang et al., 2013). Hubs, therefore, could be more vulnerable when facing pathological attacks (Crossley et al., 2014). Thus, it is not surprising that the these same networks are found to be involved not only in CD but in nicotine dependence and other substance use disorders and indeed in numerous other neuropsychiatric disorders not directly related to substance misuse (Menon, 2011).
In conclusion, cocaine addiction was found to be associated with disruptions of network-level interactions involving the default mode, salience, and emotional networks. The differential interactions between SN and DMN appear broadly consistent with the “triple network model,” although we see alterations directly between components of the DMN and the ECN but no alterations between SN and ECN. We also observed that CD individuals with higher difficulty in describing their feelings tend to show less within SN connectivity, suggesting that the higher alexithymia often seen in CD individuals may be associated with an impaired SN system. When combined in a pretreatment/post-treatment intervention design, this network analysis approach may provide novel insights into the neurobiological mechanisms of cocaine addiction, facilitating development of new treatment strategies and serving as a predictive biomarker of disease severity and treatment outcome.
Footnotes
This work was supported by the Intramural Research Program of the National Institute on Drug Abuse, National Institutes of Health. Y.H. was supported by Natural Science Foundation of China Grants 81030028 and 31221003 and National Science Fund for Distinguished Young Scholars Grant 81225012.
The authors declare no competing financial interests.
References
- Bagby RM, Taylor GJ, Parker JD. The twenty-item Toronto Alexithymia Scale-II: convergent, discriminant, and concurrent validity. J Psychosom Res. 1994a;38:33–40. doi: 10.1016/0022-3999(94)90006-X. [DOI] [PubMed] [Google Scholar]
- Bagby RM, Parker JD, Taylor GJ. The twenty-item Toronto Alexithymia Scale-I: item selection and cross-validation of the factor structure. J Psychosom Res. 1994b;38:23–32. doi: 10.1016/0022-3999(94)90005-1. [DOI] [PubMed] [Google Scholar]
- Biswal B, Yetkin FZ, Haughton VM, Hyde JS. Functional connectivity in the motor cortex of resting human brain using echo-planar MRI. Magn Reson Med. 1995;34:537–541. doi: 10.1002/mrm.1910340409. [DOI] [PubMed] [Google Scholar]
- Bonnet A, Bréjard V, Pedinielli JL. Emotional dispositions and substance use: mediating effect of alexithymia. Psychol Rep. 2013;112:289–302. doi: 10.2466/18.09.20.PR0.112.1.289-302. [DOI] [PubMed] [Google Scholar]
- Bruce G, Curren C, Williams L. Alexithymia and alcohol consumption: the mediating effects of drinking motives. Addict Behav. 2012;37:350–352. doi: 10.1016/j.addbeh.2011.11.024. [DOI] [PubMed] [Google Scholar]
- Buckner RL, Andrews-Hanna JR, Schacter DL. The brain's default network: anatomy, function, and relevance to disease. Ann N Y Acad Sci. 2008;1124:1–38. doi: 10.1196/annals.1440.011. [DOI] [PubMed] [Google Scholar]
- Buckner RL, Sepulcre J, Talukdar T, Krienen FM, Liu H, Hedden T, Andrews-Hanna JR, Sperling RA, Johnson KA. Cortical hubs revealed by intrinsic functional connectivity: mapping, assessment of stability, and relation to Alzheimer's disease. J Neurosci. 2009;29:1860–1873. doi: 10.1523/JNEUROSCI.5062-08.2009. [DOI] [PMC free article] [PubMed] [Google Scholar]
- Bullmore E, Sporns O. Complex brain networks: graph theoretical analysis of structural and functional systems. Nat Rev Neurosci. 2009;10:186–198. doi: 10.1038/nrn2575. [DOI] [PubMed] [Google Scholar]
- Cisler JM, Elton A, Kennedy AP, Young J, Smitherman S, Andrew James G, Kilts CD. Altered functional connectivity of the insular cortex across prefrontal networks in cocaine addiction. Psychiatry Res. 2013;213:39–46. doi: 10.1016/j.pscychresns.2013.02.007. [DOI] [PMC free article] [PubMed] [Google Scholar]
- Cox RW. AFNI: software for analysis and visualization of functional magnetic resonance neuroimages. Comput Biomed Res. 1996;29:162–173. doi: 10.1006/cbmr.1996.0014. [DOI] [PubMed] [Google Scholar]
- Crossley NA, Mechelli A, Scott J, Carletti F, Fox PT, McGuire P, Bullmore ET. The hubs of the human connectome are generally implicated in the anatomy of brain disorders. Brain. 2014;137:2382–2395. doi: 10.1093/brain/awu132. [DOI] [PMC free article] [PubMed] [Google Scholar]
- Danon L, Diaz-Guilera A, Duch J, Arenas A. Comparing community structure identification. J Stati Mech. 2005;2005:P09008. [Google Scholar]
- de Haan H, Joosten E, Wijdeveld T, Boswinkel P, van der Palen J, De Jong C. Alexithymia is not a stable personality trait in patients with substance use disorders. Psychiatry Res. 2012;198:123–129. doi: 10.1016/j.psychres.2011.09.027. [DOI] [PubMed] [Google Scholar]
- Ding X, Lee SW. Cocaine addiction related reproducible brain regions of abnormal default-mode network functional connectivity: a group ICA study with different model orders. Neurosci Lett. 2013;548:110–114. doi: 10.1016/j.neulet.2013.05.029. [DOI] [PubMed] [Google Scholar]
- Etkin A, Egner T, Peraza DM, Kandel ER, Hirsch J. Resolving emotional conflict: a role for the rostral anterior cingulate cortex in modulating activity in the amygdala. Neuron. 2006;51:871–882. doi: 10.1016/j.neuron.2006.07.029. [DOI] [PubMed] [Google Scholar]
- Everitt BJ, Robbins TW. Neural systems of reinforcement for drug addiction: from actions to habits to compulsion. Nat Neurosci. 2005;8:1481–1489. doi: 10.1038/nn1579. [DOI] [PubMed] [Google Scholar]
- Fortunato S, Barthélemy M. Resolution limit in community detection. Proc Natl Acad Sci U S A. 2007;104:36–41. doi: 10.1073/pnas.0605965104. [DOI] [PMC free article] [PubMed] [Google Scholar]
- Fox MD, Zhang D, Snyder AZ, Raichle ME. The global signal and observed anticorrelated resting state brain networks. J Neurophysiol. 2009;101:3270–3283. doi: 10.1152/jn.90777.2008. [DOI] [PMC free article] [PubMed] [Google Scholar]
- Franklin TR, Acton PD, Maldjian JA, Gray JD, Croft JR, Dackis CA, O'Brien CP, Childress AR. Decreased gray matter concentration in the insular, orbitofrontal, cingulate, and temporal cortices of cocaine patients. Biol Psychiatry. 2002;51:134–142. doi: 10.1016/S0006-3223(01)01269-0. [DOI] [PubMed] [Google Scholar]
- Garavan H, Pankiewicz J, Bloom A, Cho JK, Sperry L, Ross TJ, Salmeron BJ, Risinger R, Kelley D, Stein EA. Cue-induced cocaine craving: neuroanatomical specificity for drug users and drug stimuli. Am J Psychiatry. 2000;157:1789–1798. doi: 10.1176/appi.ajp.157.11.1789. [DOI] [PubMed] [Google Scholar]
- Geng X, Christensen GE, Gu H, Ross TJ, Yang Y. Implicit reference-based group-wise image registration and its application to structural and functional MRI. Neuroimage. 2009;47:1341–1351. doi: 10.1016/j.neuroimage.2009.04.024. [DOI] [PMC free article] [PubMed] [Google Scholar]
- Goerlich-Dobre KS, Bruce L, Martens S, Aleman A, Hooker CI. Distinct associations of insula and cingulate volume with the cognitive and affective dimensions of alexithymia. Neuropsychologia. 2014;53:284–292. doi: 10.1016/j.neuropsychologia.2013.12.006. [DOI] [PubMed] [Google Scholar]
- Goldstein RZ, Volkow ND. Drug addiction and its underlying neurobiological basis: neuroimaging evidence for the involvement of the frontal cortex. Am J Psychiatry. 2002;159:1642–1652. doi: 10.1176/appi.ajp.159.10.1642. [DOI] [PMC free article] [PubMed] [Google Scholar]
- Goldstein RZ, Craig AD, Bechara A, Garavan H, Childress AR, Paulus MP, Volkow ND. The neurocircuitry of impaired insight in drug addiction. Trends Cogn Sci. 2009;13:372–380. doi: 10.1016/j.tics.2009.06.004. [DOI] [PMC free article] [PubMed] [Google Scholar]
- Gu H, Salmeron BJ, Ross TJ, Geng X, Zhan W, Stein EA, Yang Y. Mesocorticolimbic circuits are impaired in chronic cocaine users as demonstrated by resting-state functional connectivity. Neuroimage. 2010;53:593–601. doi: 10.1016/j.neuroimage.2010.06.066. [DOI] [PMC free article] [PubMed] [Google Scholar]
- Guimera R, Amaral L. Cartography of complex networks: modules and universal roles. J Stat Mech. 2005;2005:P02001. doi: 10.1088/1742-5468/2005/02/P02001. [DOI] [PMC free article] [PubMed] [Google Scholar]
- Hagmann P, Cammoun L, Gigandet X, Meuli R, Honey CJ, Wedeen VJ, Sporns O. Mapping the structural core of human cerebral cortex. PLoS Biol. 2008;6:e159. doi: 10.1371/journal.pbio.0060159. [DOI] [PMC free article] [PubMed] [Google Scholar]
- Hampson M, Driesen NR, Skudlarski P, Gore JC, Constable RT. Brain connectivity related to working memory performance. J Neurosci. 2006;26:13338–13343. doi: 10.1523/JNEUROSCI.3408-06.2006. [DOI] [PMC free article] [PubMed] [Google Scholar]
- Hasin D, Hatzenbuehler ML, Keyes K, Ogburn E. Substance use disorders: Diagnostic and Statistical Manual of Mental Disorders, fourth edition (DSM-IV) and International Classification of Diseases, tenth edition (ICD-10) Addiction. 2006;101(Suppl 1):59–75. doi: 10.1111/j.1360-0443.2006.01584.x. [DOI] [PubMed] [Google Scholar]
- Haviland MG, Reise SP. Structure of the twenty-item Toronto Alexithymia Scale. J Pers Assess. 1996;66:116–125. doi: 10.1207/s15327752jpa6601_9. [DOI] [PubMed] [Google Scholar]
- He Y, Wang J, Wang L, Chen ZJ, Yan C, Yang H, Tang H, Zhu C, Gong Q, Zang Y, Evans AC. Uncovering intrinsic modular organization of spontaneous brain activity in humans. PLoS One. 2009;4:e5226. doi: 10.1371/journal.pone.0005226. [DOI] [PMC free article] [PubMed] [Google Scholar]
- Kano M, Hamaguchi T, Itoh M, Yanai K, Fukudo S. Correlation between alexithymia and hypersensitivity to visceral stimulation in human. Pain. 2007;132:252–263. doi: 10.1016/j.pain.2007.01.032. [DOI] [PubMed] [Google Scholar]
- Karlsson H, Näätänen P, Stenman H. Cortical activation in alexithymia as a response to emotional stimuli. Br J Psychiatry. 2008;192:32–38. doi: 10.1192/bjp.bp.106.034728. [DOI] [PubMed] [Google Scholar]
- Kaufman JN, Ross TJ, Stein EA, Garavan H. Cingulate hypoactivity in cocaine users during a GO-NOGO task as revealed by event-related functional magnetic resonance imaging. J Neurosci. 2003;23:7839–7843. doi: 10.1523/JNEUROSCI.23-21-07839.2003. [DOI] [PMC free article] [PubMed] [Google Scholar]
- Konova AB, Moeller SJ, Tomasi D, Volkow ND, Goldstein RZ. Effects of methylphenidate on resting-state functional connectivity of the mesocorticolimbic dopamine pathways in cocaine addiction. JAMA Psychiatry. 2013;70:857–868. doi: 10.1001/jamapsychiatry.2013.1129. [DOI] [PMC free article] [PubMed] [Google Scholar]
- Koob GF, Volkow ND. Neurocircuitry of addiction. Neuropsychopharmacology. 2010;35:217–238. doi: 10.1038/npp.2009.110. [DOI] [PMC free article] [PubMed] [Google Scholar]
- Leech R, Braga R, Sharp DJ. Echoes of the brain within the posterior cingulate cortex. J Neurosci. 2012;32:215–222. doi: 10.1523/JNEUROSCI.3689-11.2012. [DOI] [PMC free article] [PubMed] [Google Scholar]
- Liang X, Zou Q, He Y, Yang Y. Coupling of functional connectivity and regional cerebral blood flow reveals a physiological basis for network hubs of the human brain. Proc Natl Acad Sci U S A. 2013;110:1929–1934. doi: 10.1073/pnas.1214900110. [DOI] [PMC free article] [PubMed] [Google Scholar]
- Li W, Qin W, Liu H, Fan L, Wang J, Jiang T, Yu C. Subregions of the human superior frontal gyrus and their connections. Neuroimage. 2013;78:46–58. doi: 10.1016/j.neuroimage.2013.04.011. [DOI] [PubMed] [Google Scholar]
- Lowe MJ, Mock BJ, Sorenson JA. Functional connectivity in single and multislice echoplanar imaging using resting-state fluctuations. Neuroimage. 1998;7:119–132. doi: 10.1006/nimg.1997.0315. [DOI] [PubMed] [Google Scholar]
- McHugh MJ, Demers CH, Braud J, Briggs R, Adinoff B, Stein EA. Striatal-insula circuits in cocaine addiction: implications for impulsivity and relapse risk. Am J Drug Alcohol Abuse. 2013;39:424–432. doi: 10.3109/00952990.2013.847446. [DOI] [PubMed] [Google Scholar]
- McHugh MJ, Demers CH, Salmeron BJ, Devous MD, Sr, Stein EA, Adinoff B. Cortico-amygdala coupling as a marker of early relapse risk in cocaine-addicted individuals. Front Psychiatry. 2014;5:16. doi: 10.3389/fpsyt.2014.00016. [DOI] [PMC free article] [PubMed] [Google Scholar]
- Meilă M. Comparing clusterings: an information based distance. J Multivariate Analysis. 2007;98:873–895. doi: 10.1016/j.jmva.2006.11.013. [DOI] [Google Scholar]
- Menon V. Large-scale brain networks and psychopathology: a unifying triple network model. Trends Cogn Sci. 2011;15:483–506. doi: 10.1016/j.tics.2011.08.003. [DOI] [PubMed] [Google Scholar]
- Mohanty A, Gitelman DR, Small DM, Mesulam MM. The spatial attention network interacts with limbic and monoaminergic systems to modulate motivation-induced attention shifts. Cereb Cortex. 2008;18:2604–2613. doi: 10.1093/cercor/bhn021. [DOI] [PMC free article] [PubMed] [Google Scholar]
- Murphy K, Birn RM, Handwerker DA, Jones TB, Bandettini PA. The impact of global signal regression on resting state correlations: are anti-correlated networks introduced? Neuroimage. 2009;44:893–905. doi: 10.1016/j.neuroimage.2008.09.036. [DOI] [PMC free article] [PubMed] [Google Scholar]
- Naqvi NH, Rudrauf D, Damasio H, Bechara A. Damage to the insula disrupts addiction to cigarette smoking. Science. 2007;315:531–534. doi: 10.1126/science.1135926. [DOI] [PMC free article] [PubMed] [Google Scholar]
- Nestler EJ. Is there a common molecular pathway for addiction? Nat Neurosci. 2005;8:1445–1449. doi: 10.1038/nn1578. [DOI] [PubMed] [Google Scholar]
- Newman ME. Fast algorithm for detecting community structure in networks. Phys Rev E Stat Nonlin Soft Matter Phys. 2004;69 doi: 10.1103/PhysRevE.69.066133. 066133. [DOI] [PubMed] [Google Scholar]
- Newman ME, Girvan M. Finding and evaluating community structure in networks. Phys Rev E Stat Nonlin Soft Matter Phys. 2004;69 doi: 10.1103/PhysRevE.69.026113. 026113. [DOI] [PubMed] [Google Scholar]
- Oades RD, Halliday GM. Ventral tegmental (A10) system: neurobiology. 1. Anatomy and connectivity. Brain Res. 1987;434:117–165. doi: 10.1016/0165-0173(87)90011-7. [DOI] [PubMed] [Google Scholar]
- Paradiso S, Vaidya JG, McCormick LM, Jones A, Robinson RG. Aging and alexithymia: association with reduced right rostral cingulate volume. Am J Geriatr Psychiatry. 2008;16:760–769. doi: 10.1097/JGP.0b013e31817e73b0. [DOI] [PMC free article] [PubMed] [Google Scholar]
- Parker JD, Keefer KV, Taylor GJ, Bagby RM. Latent structure of the alexithymia construct: a taxometric investigation. Psychol Assess. 2008;20:385–396. doi: 10.1037/a0014262. [DOI] [PubMed] [Google Scholar]
- Picardi A, Toni A, Caroppo E. Stability of alexithymia and its relationships with the “big five” factors, temperament, character, and attachment style. Psychother Psychosom. 2005;74:371–378. doi: 10.1159/000087785. [DOI] [PubMed] [Google Scholar]
- Pons P, Latapy M, Yolum P, Gungor T, Gurgen F, Ozturan C. Computing communities in large networks using random walks. Computer and Information Sciences, Iscis 2005, Proceedings. 2005;3733:284–293. doi: 10.1007/11569596_31. [DOI] [Google Scholar]
- Power JD, Cohen AL, Nelson SM, Wig GS, Barnes KA, Church JA, Vogel AC, Laumann TO, Miezin FM, Schlaggar BL, Petersen SE. Functional network organization of the human brain. Neuron. 2011;72:665–678. doi: 10.1016/j.neuron.2011.09.006. [DOI] [PMC free article] [PubMed] [Google Scholar]
- Power JD, Barnes KA, Snyder AZ, Schlaggar BL, Petersen SE. Spurious but systematic correlations in functional connectivity MRI networks arise from subject motion. Neuroimage. 2012;59:2142–2154. doi: 10.1016/j.neuroimage.2011.10.018. [DOI] [PMC free article] [PubMed] [Google Scholar]
- Raichle ME, MacLeod AM, Snyder AZ, Powers WJ, Gusnard DA, Shulman GL. A default mode of brain function. Proc Natl Acad Sci U S A. 2001;98:676–682. doi: 10.1073/pnas.98.2.676. [DOI] [PMC free article] [PubMed] [Google Scholar]
- Reker M, Ohrmann P, Rauch AV, Kugel H, Bauer J, Dannlowski U, Arolt V, Heindel W, Suslow T. Individual differences in alexithymia and brain response to masked emotion faces. Cortex. 2010;46:658–667. doi: 10.1016/j.cortex.2009.05.008. [DOI] [PubMed] [Google Scholar]
- Saad ZS, Gotts SJ, Murphy K, Chen G, Jo HJ, Martin A, Cox RW. Trouble at rest: how correlation patterns and group differences become distorted after global signal regression. Brain Connect. 2012;2:25–32. doi: 10.1089/brain.2012.0080. [DOI] [PMC free article] [PubMed] [Google Scholar]
- Saladin ME, Santa Ana EJ, LaRowe SD, Simpson AN, Tolliver BK, Price KL, McRae-Clark AL, Brady KT. Does alexithymia explain variation in cue-elicited craving reported by methamphetamine-dependent individuals? Am J Addict. 2012;21:130–135. doi: 10.1111/j.1521-0391.2011.00214.x. [DOI] [PMC free article] [PubMed] [Google Scholar]
- Satterthwaite TD, Wolf DH, Loughead J, Ruparel K, Elliott MA, Hakonarson H, Gur RC, Gur RE. Impact of in-scanner head motion on multiple measures of functional connectivity: relevance for studies of neurodevelopment in youth. Neuroimage. 2012;60:623–632. doi: 10.1016/j.neuroimage.2011.12.063. [DOI] [PMC free article] [PubMed] [Google Scholar]
- Seeley WW, Menon V, Schatzberg AF, Keller J, Glover GH, Kenna H, Reiss AL, Greicius MD. Dissociable intrinsic connectivity networks for salience processing and executive control. J Neurosci. 2007;27:2349–2356. doi: 10.1523/JNEUROSCI.5587-06.2007. [DOI] [PMC free article] [PubMed] [Google Scholar]
- Sporns O. Contributions and challenges for network models in cognitive neuroscience. Nat Neurosci. 2014;17:652–660. doi: 10.1038/nn.3690. [DOI] [PubMed] [Google Scholar]
- Sutherland MT, McHugh MJ, Pariyadath V, Stein EA. Resting state functional connectivity in addiction: lessons learned and a road ahead. Neuroimage. 2012;62:2281–2295. doi: 10.1016/j.neuroimage.2012.01.117. [DOI] [PMC free article] [PubMed] [Google Scholar]
- Sutherland MT, Carroll AJ, Salmeron BJ, Ross TJ, Stein EA. Insula's functional connectivity with ventromedial prefrontal cortex mediates the impact of trait alexithymia on state tobacco craving. Psychopharmacology. 2013;228:143–155. doi: 10.1007/s00213-013-3018-8. [DOI] [PMC free article] [PubMed] [Google Scholar]
- Taylor GJ, Bagby RM. New trends in alexithymia research. Psychother Psychosom. 2004;73:68–77. doi: 10.1159/000075537. [DOI] [PubMed] [Google Scholar]
- Tomasi D, Volkow ND. Functional connectivity density mapping. Proc Natl Acad Sci U S A. 2010;107:9885–9890. doi: 10.1073/pnas.1001414107. [DOI] [PMC free article] [PubMed] [Google Scholar]
- Tomasi D, Volkow ND, Wang R, Carrillo JH, Maloney T, Alia-Klein N, Woicik PA, Telang F, Goldstein RZ. Disrupted functional connectivity with dopaminergic midbrain in cocaine abusers. PLoS One. 2010;5:e10815. doi: 10.1371/journal.pone.0010815. [DOI] [PMC free article] [PubMed] [Google Scholar]
- Van Dijk KR, Sabuncu MR, Buckner RL. The influence of head motion on intrinsic functional connectivity MRI. Neuroimage. 2012;59:431–438. doi: 10.1016/j.neuroimage.2011.07.044. [DOI] [PMC free article] [PubMed] [Google Scholar]
- Walter NT, Montag C, Markett SA, Reuter M. Interaction effect of functional variants of the BDNF and DRD2/ANKK1 gene is associated with alexithymia in healthy human subjects. Psychosom Med. 2011;73:23–28. doi: 10.1097/PSY.0b013e31820037c1. [DOI] [PubMed] [Google Scholar]
- Wang W, Wang YR, Qin W, Yuan K, Tian J, Li Q, Yang LY, Lu L, Guo YM. Changes in functional connectivity of ventral anterior cingulate cortex in heroin abusers. Chin Med J (Engl) 2010;123:1582–1588. [PubMed] [Google Scholar]
- Wisner KM, Patzelt EH, Lim KO, MacDonald AW., 3rd An intrinsic connectivity network approach to insula-derived dysfunctions among cocaine users. Am J Drug Alcohol Abuse. 2013;39:403–413. doi: 10.3109/00952990.2013.848211. [DOI] [PubMed] [Google Scholar]