Abstract
When the human primary visual cortex (V1) is damaged, the dominant geniculo-striate pathway can no longer convey visual information to the occipital cortex. However, many patients with such damage retain some residual visual function that must rely on an alternative pathway directly to extrastriate occipital regions. This residual vision is most robust for moving stimuli, suggesting a role for motion area hMT+. However, residual vision also requires high-contrast stimuli, which is inconsistent with hMT+ sensitivity to contrast in which even low-contrast levels elicit near-maximal neural activation. We sought to investigate this discrepancy by measuring behavioral and neural responses to increasing contrast in patients with V1 damage. Eight patients underwent behavioral testing and functional magnetic resonance imaging to record contrast sensitivity in hMT+ of their damaged hemisphere, using Gabor stimuli with a spatial frequency of 1 cycle/°. The responses from hMT+ of the blind hemisphere were compared with hMT+ and V1 responses in the sighted hemisphere of patients and a group of age-matched controls. Unlike hMT+, neural responses in V1 tend to increase linearly with increasing contrast, likely reflecting a dominant parvocellular channel input. Across all patients, the responses in hMT+ of the blind hemisphere no longer showed early saturation but increased linearly with contrast. Given the spatiotemporal parameters used in this study and the known direct subcortical projections from the koniocellular layers of the lateral geniculate nucleus to hMT+, we propose that this altered contrast sensitivity in hMT+ could be consistent with input from the koniocellular pathway.
Keywords: blindsight, contrast, fMRI, hemianopia, hMT+, V1
Introduction
It is well established that residual vision, or blindsight, after damage to primary visual cortex (V1) is most consistent for moving and high luminance contrast stimuli (Riddoch, 1917; Weiskrantz et al., 1974; Zihl and von Cramon, 1980), with the human motion area hMT+ implicated frequently in functional imaging studies of cortical blindness (Zeki and Ffytche, 1998; Goebel et al., 2001; Nelles et al., 2002; Schoenfeld et al., 2002; Bridge et al., 2010). Such observations are somewhat incongruous with our understanding of normal hMT+ sensitivity to luminance contrast, in which a dominant magnocellular input leads to early saturation such that even very low levels of contrast elicit significant activation above baseline (Tootell et al., 1995). Although receptive field summation is likely to contribute to this effect, high-contrast sensitivity is a feature of all stages of the magnocellular channel (M channel), including magnocellular neurons in the lateral geniculate nucleus (LGN; Derrington and Lennie, 1984). Thus, by investigating the contrast response properties of hMT+ in the absence of V1, it may be possible to understand the pathways by which this residual activity arises in hMT+.
An important approach to understanding neural pathways is the use of diffusion-weighted tractography imaging (DTI), which has been used to investigate a number of visual pathways involved in blindsight (Leh et al., 2006; Bridge et al., 2008). However, the ability to use DTI to track between two brain regions does not provide information about their function. Furthermore, it is not yet possible to perform human DTI at sufficient resolution to distinguish divisions of pathways into subtypes, such as the M, parvocellular (P), or koniocellular (K) channels. In contrast, functional magnetic resonance imaging (fMRI) can be used to measure hMT+ responses when V1 is damaged, allowing a comparison with the known properties of the different subcortical pathways. By comparing these responses with normal hMT+ and V1 activity, we can consider whether contrast sensitivity in hMT+ of patients is likely to be consistent with M- or P-driven responses (Tootell et al., 1995; Boynton et al., 1996).
It is also possible to measure behavioral performance for stimuli presented to the blind hemifield to determine how neural activity relates to blindsight experience, a relatively neglected issue (Sahraie et al., 1997; Zeki and Ffytche, 1998). Furthermore, it may be possible to evaluate whether hMT+ activity correlates more strongly with the basic image properties of a stimulus or with the perceptual experience associated with its detection (Panagiotaropoulos et al., 2012) and to consider how these two components are reflected in blood oxygenation level-dependent (BOLD) signal changes.
Here, we used fMRI in eight patients with unilateral V1 damage to measure visual responses in hMT+ and intact V1 to stimuli of varying contrast. To anticipate our findings, we found that the pattern of BOLD signal changes evoked by different levels of contrast in ipsilesional hMT+ did not show saturation at low contrast. Rather, there was a linear response that persisted across the entire range of contrasts tested.
Materials and Methods
Participants
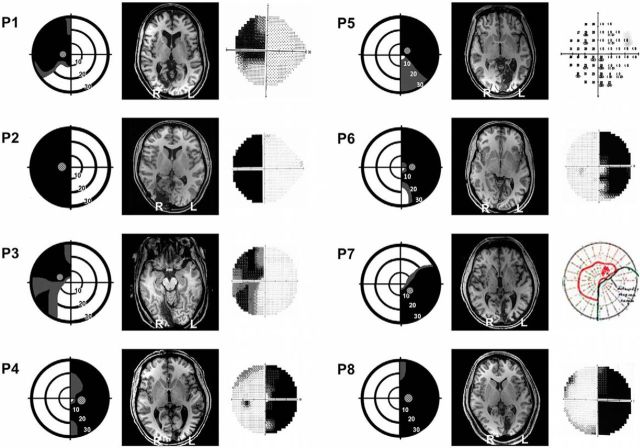
Eight patients (three females) were recruited from ophthalmological or stroke services in three United Kingdom National Health Service centers. Testing was performed at the John Radcliffe Hospital (Oxford, UK). All patients had sustained unilateral damage to V1, causing homonymous visual field loss recorded by Humphrey perimetry or, in one case, Goldmann perimetry [patient 7 (P7)]. Cases with additional visual impairment or additional neurological disease were excluded from participation. Pathological changes had been caused by posterior circulation stroke in seven patients and by benign tumor resection in one patient at least 6 months previously (for axial T1-weighted structural images, see Fig. 1; for details, see Table 1). Average ± SD age at the time of participation was 49.6 ± 15.0 years, and the average time after pathology onset was 42.5 months (range, 6–156 months). Eight age-matched, healthy participants (mean ± SD, aged 53.6 ± 12.2 years, three females) with normal or corrected-to-normal visual acuity and no history of neurological disease served as controls. Written consent was obtained from all participants. Ethical approval was provided by the Oxfordshire Research Ethics Committee (Reference B 08/H0605/156).
Figure 1.
Visual field deficits and structural MRI scans for all patients. Perimetry reports are depicted schematically for each patient, with the location of the target Gabor stimulus superimposed. Dense visual field loss is shown in black (<0.5%) and partial loss in gray (<2%). Stimuli were always restricted to a region of dense visual field loss, a minimum of 3° from fixation. Concentric rings represent increments in retinal position of 10°, spanning the central 30°. Representative MPRAGE T1 structural axial slices demonstrating lesion location are also provided, with radiological convention. Humphrey perimetry maps (Goldmann for P7) are included on the right side. Note that, on the Goldmann map, the red line represents the area in which the patient could detect stimulus of parameters “i2e,” i.e., size i (0.1°), intensity 2e. For P5, this is a screenshot of the raw Humphrey thresholds at each retinal location.
Table 1.
Clinical details and stimulus parameters for eight patients with unilateral striate cortex damage and homonymous visual field deficits (HVFD) who participated in this study
| Patient | Sex | Age (years) | Pathology | Time since pathology (months) | HVFD | Stimulus diameter | Stimulus coordinates (x, y) |
|---|---|---|---|---|---|---|---|
| P1 | F | 67 | Right occipito/temporal hemorrhage | 6 | LUQ | 5 | (−6.5,1) |
| P2 | F | 38 | Right occipital tumor resection | 36 | LHH | 8 | (−7, 0) |
| P3 | M | 69 | Right occipital infarct | 16 | LUQ | 5 | (−7.7, 3.75) |
| P4 | M | 55 | Left occipital and cerebellar infarct | 18 | RHH | 8 | (8.3, −2.55) |
| P5 | F | 42 | Left occipital infarct | 6 | RHH | 5 | (5.5, 3.5) |
| P6 | M | 36 | Left occipital infarct | 6 | RHH | 5 | (7.7, 0) |
| P7 | M | 60 | Left occipital infarct | 96 | RLQ | 5 | (6.5, −3.5) |
| P8 | M | 30 | Left occipital infarct | 156 | RHH | 8 | (7, 0) |
The precise stimulus size and location varied slightly according to each patient's pattern of field loss, with the (x, y) coordinates corresponding to the stimulus center (degrees), mapped from the central fixation cross. For a schematic representation, see Figure 1. LUQ, Left upper quadrant; RLQ, right lower quadrant; RHH, right homonymous hemianopia; LHH, left homonymous hemianopia; F, female; M, male.
Stimuli
Stimuli were generated using MATLAB (MathWorks) and the Psychophysics Toolbox (Brainard, 1997; Kleiner et al., 2007). Visual stimuli consisted of a drifting achromatic Gabor patch of 5° or 8° diameter displayed on a uniform gray background of luminance 50 cd/m−2, which was equal to the mean luminance of all Gabor patches; temporal frequency was 10 Hz, and spatial frequency was 1.3 cycles/°. Five contrast levels were used (1%, 5%, 10%, 50%, and 100%), with stimulus location restricted to the specific location of the scotoma and its corresponding location in the sighted hemifield in each individual patient, a minimum of 3° from fixation (for a schematic representation of the stimulus size and location in all patients and their corresponding visual field deficit, see Fig. 1; for the stimulus coordinates for each patient, see Table 1). For the behavioral experiment, two pure auditory tones of 300 and 1200 Hz were generated using the same software tools. For fMRI testing in the control group, stimulus size and position were matched to the patient group. Individual cases were paired with controls, with stimulus size and position replicated between each matched pair.
Behavioral procedure
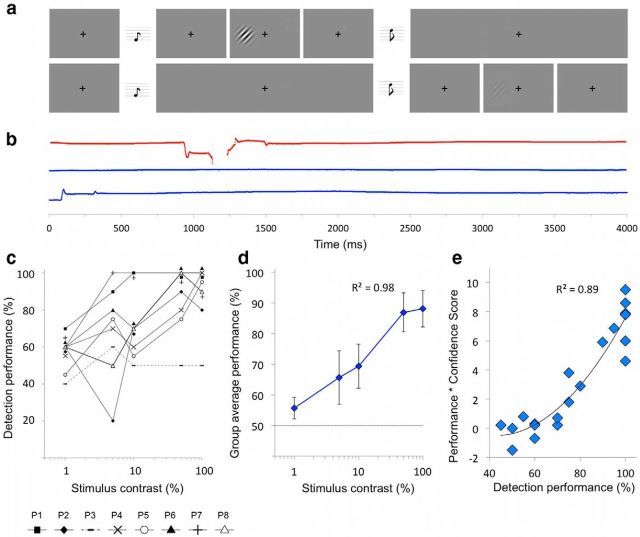
Psychophysical testing was conducted outside the MRI scanner using a 60 Hz cathode ray tube monitor at a distance of 68 cm. Participants were asked to indicate whether a stimulus appeared in the first or second time interval (Fig. 2a) using a two-alternate forced-choice (2AFC) paradigm. If they saw nothing, they were instructed to guess. In a subgroup of four patients, we also collected confidence ratings for their choice with a scale of 1–10. It was explained that a rating of 10 was to be used if they were absolutely certain, whereas 1 was for a complete guess. Onset of each interval was indicated by a 500 ms auditory tone, with 300 Hz marking onset of the first interval and 1200 Hz for the second. Visual stimuli appeared for 500 ms with jittered onset while the participant fixated on a central black cross. Stimulus contrast was altered parametrically between the five levels at random, with 20 trials per condition. The allocated interval (first or second) was also generated at random. Participants additionally performed a run of control testing, with stimuli presented to the equivalent location in their sighted visual field. Fixation was recorded throughout the experiment with an Eyelink 1000 eye tracker (SR Research), and any trials with eye position >1° from fixation were excluded from analysis (for examples, see Fig. 2b). Participants were reminded to maintain fixation, with the investigator observing this in real time. Anyone making even a small eye movement into their damaged hemifield was given specific instruction not to do so, and it was explained that these data would have to be discarded.
Figure 2.
Behavioral protocol and results for all patients. a, Schematic of the 2AFC detection procedure. Participants fixate on a central cross, with the onset of each 1500 ms interval alerted by a low (interval 1) or high (interval 2) pitch tone. The stimulus can appear in either interval, for a period of 500 ms. At the end of the trial, participants are instructed to decide which interval the stimulus appeared, with a subset of patients also asked to rate the confidence of this response. b, Throughout the experiment, fixation was recorded with eye tracking. Example data over three trials are displayed here, with the y-axis representing horizontal gaze position on the screen (amplitude bar for scale). Any trials containing eye movements >1° toward the stimulus were excluded from analysis (red top plot); blue plots (bottom) represent adequate fixation. c, Individual 2AFC detection performance for all individuals. The individual at chance (P3, dotted line) is clearly distinct from other patients. When patients demonstrate identical scores for the same contrast levels, overlapping data points are plotted immediately above and/or below for visualization purposes. d, Average group performance; error bars represent SEM. Detection exhibits a logarithmic relationship with contrast (R2 = 0.98). e, Individual confidence ratings were collected in four patients, plotted here against detection performance. The relationship is described by a nonlinear curve, with confidence increasing the most for higher performance scores (R2 = 0.89; MSE, 1.3).
During the experiment, patients were also asked to describe the stimulus presented to their blind field to the experimenter. This was performed after completing three blocks of testing, i.e., after all five contrast levels had been tested three times in the blind field, but before the sighted hemifield had been tested. Patients were encouraged to be as detailed as possible with their description, which was noted by the experimenter. No feedback was given on the accuracy of their description.
fMRI procedure
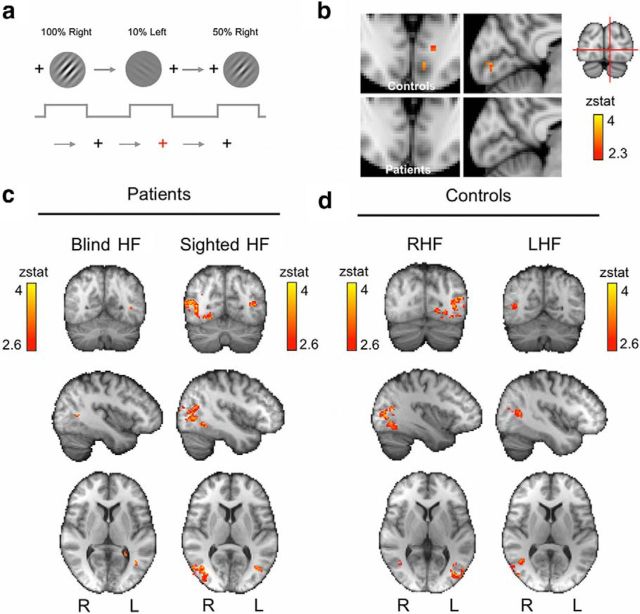
Stimuli during scanning were presented on a 1280 × 1040 resolution monitor at the back of the MRI scanner bore. Participants viewed stimuli via a double mirror mounted on the head coil. When in position, the screen subtended a visual angle of 23° × 13°. The same five contrast levels were presented separately to each hemifield representing a 10-condition block design, with equivalent diameter and screen position to that used in behavioral testing (for illustration, see Fig. 3a). For each block, a Gabor of the same luminance contrast appeared eight times with 2 s duration and interstimulus interval of 500 ms. Angle of drift was allocated randomly in one of two orthogonal directions for each stimulus. A 10 s rest period followed each 20 s block. There were three runs in total, each lasting 300 s. Throughout the experiment (during the condition and rest blocks), participants performed a task to maintain fixation by pressing a button every time a central fixation cross changed color from black to red (Fig. 3a). Color changes occurred at random and lasted 300 ms, and participants were instructed at the start to try not to miss any red crosses. It was emphasized that they must try to maintain fixation throughout and avoid moving their eyes around the screen. All participants scored >90% on the fixation task averaged across all blocks (mean ± SE, 96.8 ± 1.7% in patients and 94.7 ± 2.3% in controls). Run 3 in P1 and P2 was excluded because block performance fell ≤75% (i.e., at least one red cross was missed) during blind hemifield conditions, and this dip in performance was isolated to this one run. This ensured that there was no bias from an unbalanced number of repeats for each condition. Only one other patient (P8) showed any dips in performance, which were in odd blocks across all runs (affecting four blocks in total). Because of the difficulty in removing individual blocks, these data remained within the analysis. An EyeLink 1000 eye tracker (SR Research) was used to confirm central fixation by recording eye position.
Figure 3.
fMRI procedure and activation results for high-contrast motion. a, Simple block design consists of a drifting Gabor presented to the “blind” portion of visual field or its equivalent location in the sighted hemifield during 20 s blocks. Stimulus contrast is altered at random for each block across five contrast levels, representing 10 conditions. A concurrent fixation task requires participants to press a button every time the fixation cross changes color to red. All participants scored >90%. b, V1 activation during 100% contrast motion in the right hemifield of controls and the blind right hemifield of patients. No V1 activity is seen in the patient group, whereas controls show a small cluster of activity corresponding to the stimulus. The small volume reflects the small stimulus size and variation in location between participants, which had been matched to patients (Fig. 1). c, Thresholded activation maps for 100% contrast stimulation comparing the blind (left column) and sighted (right column) hemifields of patients show significant hMT+ activity. d, Equivalent results in control participants. Mixed-effects analysis, p < 0.001 uncorrected for a priori ROIs; elsewhere, cluster corrected, p < 0.05; results are displayed in MNI space. RHF, Right hemifield; LHF, left hemifield.
fMRI acquisition and preprocessing
Scanning took place in a 3T Siemens Verio MRI scanner at the Functional MRI of the Brain (FMRIB) Centre (University of Oxford), using a 32 channel head coil. Four hundred fifty-six functional volumes were acquired in a single session, duration 15 min [T2*-weighted EPI; 34 sequential 3 mm slices; repetition time (TR), 2000 ms; echo time (TE), 30 ms; field of view, 192 mm]. Magnetization was allowed to reach a steady state by discarding the first five volumes, an automated feature of the scanner. A high-resolution (1 × 1 × 1 mm voxels) whole-head T1-weighted MPRAGE anatomical image (TE, 4.68 ms; TR, 2040 ms; field of view, 200 mm; flip angle, 8°) and a field map with dual TE images (TE1, 5.19 ms; TE2, 7.65 ms; whole-brain coverage; voxel size, 2 × 2 × 2 mm) were also acquired for each participant.
Preprocessing and statistical analyses were performed using tools from FSL (FMRIB Software Library, http://www.fmrib.ox.ac.uk/fsl). Non-brain tissue was excluded from analysis using the BET (Brain Extraction Tool; Smith, 2002), motion correction was performed using MCFLIRT (FMRIB Linear Image Restoration Tool with Motion Correction; Jenkinson et al., 2002), images were corrected for distortion using field maps, spatial smoothing used a Gaussian kernel of FWHM of 5 mm, and high-pass temporal filtering (Gaussian-weighted least-squares straight-line fitting, with σ = 13.0 s) was used. Functional images were registered to high-resolution structural scans using FLIRT (FMRIB Linear Image Restoration Tool; Jenkinson and Smith, 2001) and to a standard MNI brain template using FLIRT and FNIRT (FMRIB Nonlinear Image Registration Tool; Andersson et al., 2007).
fMRI analyses
Region of interest analysis.
Each of the 10 fMRI conditions (e.g., left hemifield, 1% contrast) were entered into the general linear model (GLM) as separate explanatory variables and were contrasted against the baseline fixation task to generate contrast of parameter estimates for each condition in every voxel. Parameter estimates modeling signal change were then extracted from regions of interest (ROIs) within functional space for each individual. The percentage signal change was calculated by scaling each contrast by the peak–peak height of the regressor and dividing by the mean over time. These measures were averaged across participants to generate group plots for signal change as a function of stimulus contrast (Fig. 4) and were used in all correlation and regression analyses.
Figure 4.
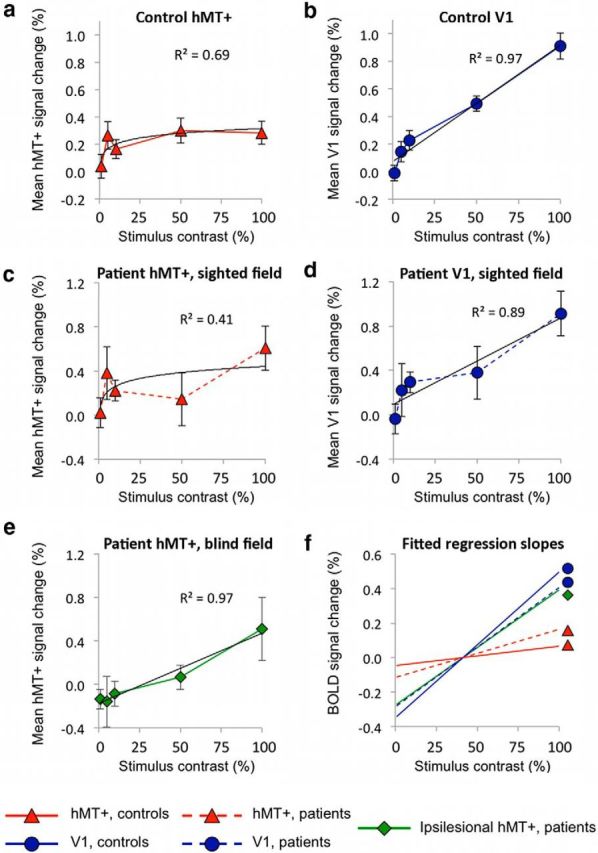
Group plots of signal change versus stimulus contrast within V1 or hMT+ ROIs. a, Control group hMT+ shows an early saturation at low levels of contrast, described by a logarithmic response. b, Control V1 shows a much stronger linear component, with signal change continuing to increase with each rise in stimulus contrast. c, Sighted hMT+ response in patients shows high signal change at 5 and 100% contrast. d, Sighted V1 in the undamaged hemisphere of patients, similar to controls, shows a predominantly linear relationship with increasing contrast. e, Ipsilesional hMT+ in patients is best described by a linear relationship with contrast (MSE, 0.002). f, Normalized linear regression lines between 5 and 100% contrast capture the early plateau of activity in normal hMT+ responses. hMT+ in controls (red triangle) and the sighted hemifield of patients (dotted red, triangle) both show shallow increases in signal change representative of this early saturation in activity. Conversely, V1 of controls (blue circle) and the intact hemisphere of patients (dotted blue, circle) show a comparable, steeper gradient that is notably similar to the regression line for hMT+ during blind field stimulation in patients (green diamond).
Whole-brain GLM group analysis.
Group analyses were also performed to look for brain regions showing significant activation during blind hemifield stimulation. For this purpose, it was necessary to align patient brains to a uniform pathological template, with lesions located in the same “left” hemisphere, corresponding to a “right-sided” visual deficit. This required that the structural and functional images of three patients (P1, P2, and P3) were flipped in the horizontal plane. All activation coordinates are reported in MNI space, and Z statistic images are displayed on mean structural images for the group, which have been transformed to standard space. Mixed-effects analyses were performed for each hemifield separately in the control and patient groups. A statistical threshold of p < 0.001 uncorrected was used to test for significance within V1 and extrastriate cortex, for which we had a priori hypotheses. Elsewhere, correction for multiple comparisons was made using a cluster threshold of p < 0.05 unless stated otherwise.
Whole-brain parametric group analysis.
A parametric group analysis was also performed to assess the specificity of different relationships between fMRI signal change and stimulus contrast throughout the whole brain. The same technique and statistical analyses were used as for the whole-brain GLM analysis, except that normalized integers representing linear and logarithmic models were entered as weights into a group GLM, along with contrast images for all participants.
Whole-brain behavioral group analysis.
A similar technique was also used to look for brain regions demonstrating a direct relationship between fMRI signal change and behavioral 2AFC performance. Only patients showing significant detection above chance were included in this analysis. This was defined as achieving an average score above chance, using a statistical threshold of p < 0.01 and a cumulative binomial distribution. This criterion led to the exclusion of one participant from analysis (P3). Individual detection scores for each contrast level in the seven remaining patients were normalized and entered as weights into a higher-level GLM, along with the corresponding contrast of parameter estimate for the blind hemifield condition. Fixed-effects analyses were performed for the blind hemifield only.
Regions of interest
hMT+ masks were derived from anatomically defined probabilistic maps (Juelich atlas implemented in FSL; Malikovic et al., 2007), nonlinearly transformed into functional space for both patients and controls to ensure consistency between participant groups. In native space, average hMT+ ROI volume was 87.3 ± 30.8 voxels in patients and 99.6 ± 14.3 voxels in controls, with no significant difference between the two groups (t = 1.4, p = 0.16). V1 masks in controls and in the intact hemisphere of patients were defined functionally for each participant so that they corresponded to stimulated regions of calcarine cortex. Average V1 ROI volume was 38.5 ± 37.9 voxels in patients (undamaged hemisphere) and 23.7 ± 20.1 voxels in controls (averaged across hemispheres); the small volume reflective of the small 5° or 8° diameter stimulus used. There was again no significant difference in ROI volume when comparing patients and controls (t = 1.3, p = 0.22).
Results
Of the eight participants with V1 damage, seven performed significantly above chance at detecting a drifting achromatic Gabor within their blind visual field scotoma (Fig. 2c). Such blindsight performance showed a clear positive relationship with stimulus contrast, described by a logarithmic relationship [R2 = 0.98, F = 9.7 log vs linear regression, p = 0.05; Fig. 2d; mean square residual error (MSE), 3.6 vs 34.7]. Throughout all experiments, trials with eye movements were discarded from analysis [for eye-tracker data over three trials, see Fig. 2b; the red (topmost) plot corresponds to a deviation in fixation toward the stimulus and was therefore excluded]. Overall, significant deviation from fixation constituted 1.88% of all trials, which were discarded. Participants performed an identical task for stimuli presented to their sighted hemifield, with average ± SD detection performance of 98.3 ± 1.4% and no significant difference across contrast levels, including the 1% contrast condition.
Optimal performance is associated with a greater increase in confidence
Descriptions of stimuli presented in the blind field varied considerably, with some patients stating that their responses were almost exclusively guesses (P2) or that they were aware of something but were unable to describe it at all (P7). Another patient reported, on occasion, being able to see “something fuzzy/murky, but nothing distinct” (P4). Two patients described seeing movement of some sort, with one unable to appreciate any detail (P8), whereas the other thought that images were black (P5). Interestingly, another patient described their experience as “like an after-image, with dancing colors” (P6) and was able to point to the position on the screen where the stimulus appeared. The most detailed report was of seeing “gray clouds” that became “more bold” at times (P1).
All four patients tested for confidence showed greater confidence for correctly identified versus incorrect trials, but there was wide intersubject variability in their ratings: P1, 7.5 versus 2.6; P4, 2.6 versus 1; P5, 4.3 versus 1.4; and P6, 5.1 versus 3.4. On average, patients mostly used confidence ratings below 5 for correct responses. However, this increased considerably for stimuli at 100% contrast (mean confidence score, 7.0). Individual 2AFC performance correlated well with confidence ratings, with the relationship described by a nonlinear curve (Fig. 2e; MSE, 1.3 vs 1.7 linear), such that confidence increased the most for higher performance scores.
hMT+ responds to high-contrast motion in the blind hemifield
A group-level analysis was performed to measure the effect on BOLD signal change elicited by a high-contrast drifting Gabor (100% contrast) presented within the blind visual field of patients. This was compared with stimulation of the opposite, sighted hemifield (Fig. 3c), as well as a group of age-matched controls (Fig. 3d). As expected, controls showed significant activation throughout the contralateral visual cortex, including V1, with peak activation in hMT+ on the right [Z = 4.0, MNI coordinates (46, −60, 8)] and areas V4 and hMT+ on the left [Z = 4.6, MNI coordinates (−30, −70, −14); Z = 4.3, MNI coordinates (−40, −78, 8)]. Patients showed a similar pattern for their sighted hemifield, although they demonstrated a slightly greater degree of ipsilateral hMT+ activation (i.e., in the ipsilesional hemisphere) compared with controls (Fig. 3c, right column). For stimulation of the blind hemifield (Fig. 3c, left column), a small region in contralateral hMT+ (ipsilesional) demonstrated significant activation above baseline [peak Z = 3.6, MNI coordinates (−40, −62, 6), p < 0.001]. No significant activity was seen in the early visual cortex in which lesions were located, unlike in controls (for a direct comparison, see Fig. 3b), or in the intact ipsilateral hemisphere. The group activity in V1 is weakened in control participants because the stimulus size was small and location varied to match each patient's visual field damage (Table 1); individual activation is considerably greater as can be seen in Figure 8.
Figure 8.
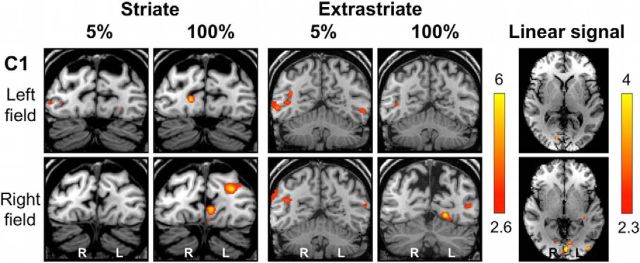
Individual fMRI responses during 5 and 100% contrast in a control participant (C1). Representative coronal slices demonstrating the striate (left column) and extrastriate (middle column) cortices during stimulation of the left (top row) or right (bottom row) hemifield. The far right column depicts activity corresponding significantly to a linear relationship with increasing contrast. Activation is superimposed on representative axial slices, centered on the peak voxel. Mixed-effects analyses, p < 0.001 uncorrected for a priori ROIs; elsewhere, cluster corrected, p < 0.05. Results displayed on T1-weighted structural images.
Blind hMT+ contrast response resembles healthy V1
Responses in control participants are shown in Figure 4, a and b. As expected, contralateral hMT+ (Fig. 4a) showed a large initial increase in signal change for low levels of contrast, with activity remaining fairly constant despite subsequent increases in contrast. This is better described by a logarithmic rather than a linear relationship (MSE, 0.003 vs 0.006); however, this does not fully reflect the steep initial rise in signal change between stimuli of 1 and 5% contrast. The quality of fit is similar but slightly improved with the Naka–Rushton model (MSE, 0.002; Naka and Rushton, 1966). A similar response function is seen in contralateral hMT+ for the sighted hemifield of patients (Fig. 4c). Individual BOLD percentage signal change is shown for 5 and 100% contrast compared with fixation for four patients in Figure 5 (middle column, red triangles), illustrating the similarity in signal at these two contrast levels. In contralateral V1 of controls (Fig. 4b), there is a much more pronounced linear component in the relationship between signal change and stimulus contrast, with a very similar pattern for the sighted hemifield of patients (Fig. 4d). This is also well described by a linear function (MSE, 0.003 vs 0.01 for logarithmic). However, when this linear model is overlaid with the data in Figure 4, b and d, it is possible to appreciate a small slope off in response, which is captured slightly better with a Naka–Rushton model (MSE, 0.002). Individual data in Figure 5 show the response to 5 and 100% contrast in four patients and one control participant. The middle column shows the percentage signal change in sighted hMT+ of patients (triangles), whereas the right column shows the same data for V1 in the sighted hemisphere (circles). The individual responses are likely to be noisy because each condition was only presented for 60 s per participant, but the increase in signal change between 5 and 100% contrast was generally more marked and consistent in V1, with smaller error bars.
Figure 5.
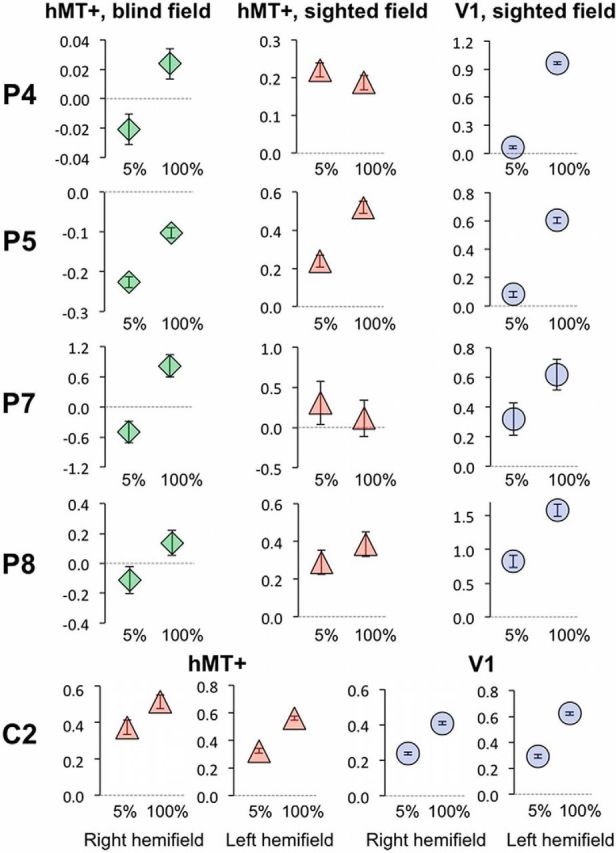
Individual hMT+ and V1 signal change at 5 and 100% contrast. Representative data are shown here for four patients (P4, P5, P7, and P8) and one control (C2). Mean signal change is shown for hMT+ during blind hemifield (left column, green diamonds) or sighted hemifield (middle column, red triangles) stimulation. The right column (blue circles) depicts signal change in V1 of the intact hemisphere during sighted field stimulation. Error bars represent the voxelwise variance estimate across the ROI. Signal change axes are matched for peak and minimum values and always go through zero (dotted gray line).
For stimulation of the blind hemifield (Figs. 4e, 5, green diamonds), BOLD signals in hMT+ increased with stimulus contrast, and this relationship was also well described by a linear regression (R2 = 0.97; MSE, 0.002). In this case, neither a logarithmic nor Naka–Rushton model fit the data as well (MSE, 0.02 for both). A shallow gradient of the regression lines fit across 5–100% contrast should reflect the early plateau of activity seen in normal hMT+. In contrast, in V1, in which signal change continues to increase with stimulus contrast, the gradient will be steeper. Indeed in controls and the sighted hemifield of patients, there is a shallow increase in signal change in hMT+, representative of early saturation in activity (Fig. 4f). Conversely, V1 of controls and the intact hemisphere of patients show a steeper gradient, notably similar to the regression line for hMT+ during blind field stimulation in patients (Fig. 4f). The individual data are consistent with this (Fig. 5, left column, green diamonds) and show a difference in signal change between 5 and 100% contrast, which is much more similar to the sighted fMRI response in V1 (blue circles) than hMT+ (red triangles).
Additionally, we evaluated how well signals in hMT+ during blind hemifield stimulation correlated with either sighted hMT+ activity (Fig. 6d) or intact V1 in patients (Fig. 6c) or the equivalent regions in controls (Fig. 6a,b). Paired within-participant analyses showed a significant correlation between blind field-stimulated hMT+ activity and intact V1 responses to the sighted field, (r = 0.31, p = 0.05) but not with sighted hMT+ response in the undamaged hemisphere (r = 0.19, p = 0.24). Similarly, blind hMT+ activity showed a significant correlation with V1 activity in controls (r = 0.94, p = 0.01; Fig. 6a) but not with control hMT+ responses (r = 0.68, p = 0.2; Fig. 6b).
Figure 6.
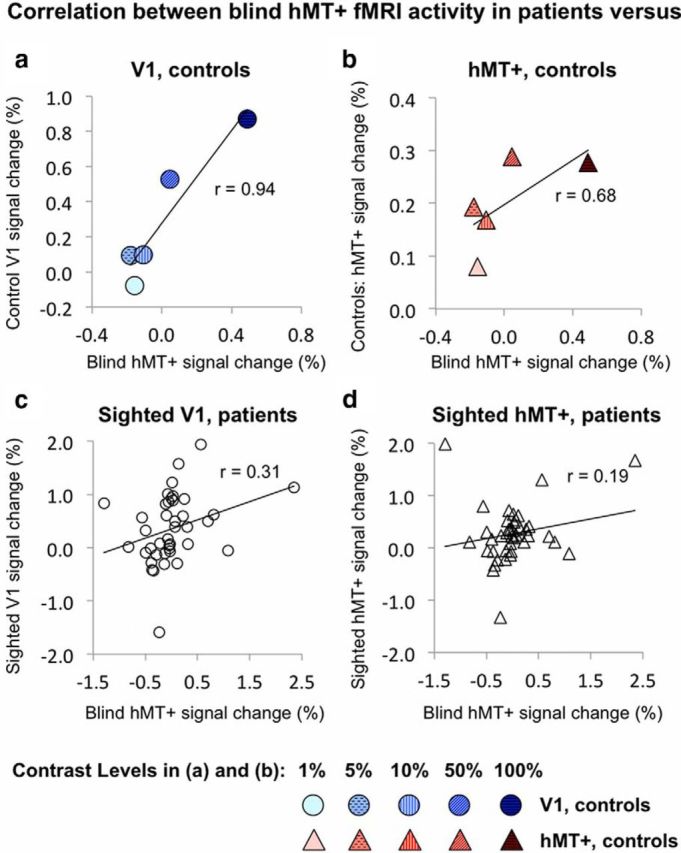
Correlations between hMT+ activity in patients during blind field stimulation versus sighted responses in V1 and hMT+ of patients and controls. Average hMT+ signal change during blind hemifield stimulation in patients correlates well with contrast-related activity in V1 of control participants (a) but not with control hMT+ responses (b). Individual data points represent single contrast levels, depicted using a shaded gradient from 1% (pale) to 100% (dark). c, Blind hMT+ activity also correlates with V1 responses to the sighted hemifield in patients' intact hemisphere. This remains significant when the three most distant outliers are excluded from analysis (r = 0.35, p = 0.03). d, There is no significant correlation with contrast-related hMT+ responses to patients' sighted hemifield, which remains unchanged when the three most prominent outliers are excluded (r = 0.19, p = 0.26).
Blind hMT+ shows activity according to a linear, not logarithmic, model
To determine brain regions in which BOLD signals followed either a logarithmic or linear relationship with increasing stimulus contrast, a higher-level group analysis was performed. These two models were selected because there is no uncertainty regarding unknown and distinct parameters that would arise from using the Naka–Rushton model (Naka and Rushton, 1966; Sclar et al., 1990). Also, the logarithmic model showed a very similar fit for control hMT+ responses (MSE, 0.002 vs 0.003). Using a whole-brain parametric approach does not require predetermined ROIs and thus can identify brain areas in which activation patterns relate significantly to the hypothesized relationships.
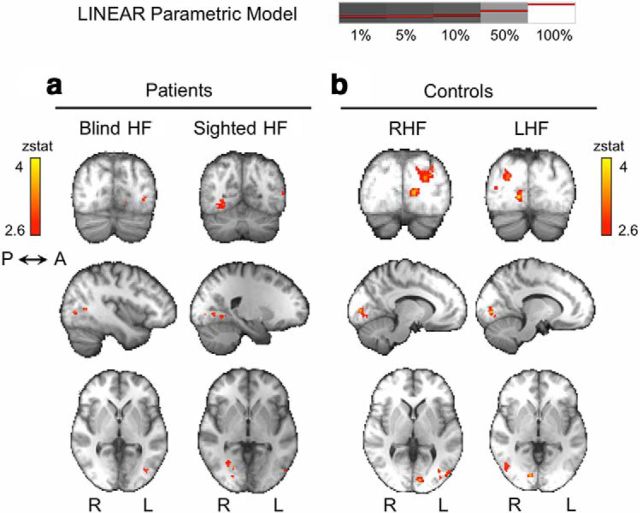
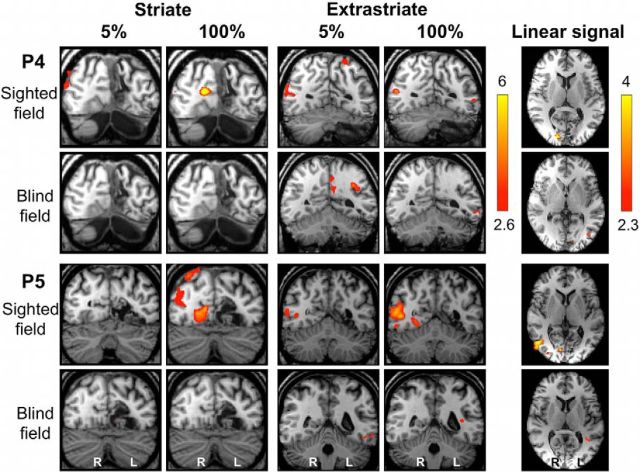
In control participants, the linear model showed a significant fit with responses in a specific region of contralateral V1, V4, and, to a lesser extent, contralateral hMT+ (Fig. 7b, Table 2; Amunts et al., 2000; Malikovic et al., 2007; Rottschy et al., 2007). A similar pattern was seen for the sighted “left” hemifield of patients (Fig. 7a, right column). For the blind hemifield, the only brain region showing a significant fit to the linear model was in left hMT+ in the damaged hemisphere, with a similar Z statistic to intact V1 during sighted hemifield stimulation (Fig. 7a, left column; Table 2). Example individual data for 5 and 100% contrast are depicted in Figures 8 (control) and 9 (patients), as well as regions with a significant linear fit (right column). During sighted field stimulation, activity in the striate cortex is particularly strong at 100% contrast, whereas hMT+ activity is already demonstrable at 5% (Figs. 8, 9). For the blind hemifield, activity is much weaker overall with no activation in the contralateral striate cortex at either contrast, despite extrastriate responses exhibiting linear signal change (Fig. 9).
Figure 7.
Cortical regions demonstrating a significant linear relationship with stimulus contrast. a, In patients, only contralateral hMT+ shows significant activity according to this model during blind hemifield stimulation. For the sighted hemifield (right column) and control participants (b), there is a significant linear relationship with contrast in contralateral V1, V4, and, to a lesser extent, hMT+. Mixed-effects analysis, p < 0.001 uncorrected for a priori ROIs; elsewhere, cluster corrected, p < 0.05. Results displayed on average high-resolution structural scans in MNI space. RHF, Right hemifield; LHF, left hemifield.
Table 2.
Cortical regions demonstrating a significant linear or logarithmic relationship with stimulus contrast
| x | y | z | Z stat | |
|---|---|---|---|---|
| Controls | ||||
| Right hemifield | ||||
| Linear model | ||||
| Left V4 | −24 | −78 | −8 | 4.5 |
| Left V1 | −10 | −88 | 2 | 3.7 |
| Left hMT+ | −44 | −78 | 8 | 3.4 |
| Logarithmic model | ||||
| Left V4 | −24 | −68 | −16 | 4.1 |
| Left hMT+ | −36 | −72 | 8 | 3.6 |
| Left hemifield | ||||
| Linear model | ||||
| Right V1 | 12 | −82 | −2 | 3.8 |
| Right hMT+ | 46 | −66 | 8 | 3.5 |
| Logarithmic model | ||||
| Right hMT+ | 46 | −66 | 6 | 3.6 |
| Right V1/V2 border | 12 | −80 | 0 | 3.3 |
| Patients | ||||
| Blind right hemifield | ||||
| Linear model | ||||
| Left hMT+ | −40 | −62 | 6 | 3.2 |
| Logarithmic model | ||||
| No significant activity | ||||
| Sighted left hemifield | ||||
| Linear model | ||||
| Right V1 | 22 | −84 | −2 | 3.3 |
| Right optic radiation/V1 border | 30 | −62 | 0 | 3.4 |
| Right V4 | 28 | −66 | −8 | 3.2 |
| Left hMT+ | −46 | −72 | 4 | 3.1 |
| Logarithmic model | ||||
| Right paracingulate gyrus | 2 | 32 | 40 | 4.1 |
| Left hMT+ | −40 | −70 | 14 | 3.9 |
| Right hMT+ | 48 | −64 | 16 | 3.6 |
Only the most significant peak within each region of activation is reported, with its corresponding MNI coordinates and Z statistic. A statistical threshold of p < 0.001 uncorrected was used for a priori ROIs; elsewhere, correction for multiple comparisons was made with a cluster threshold of p < 0.05, mixed-effects analysis. Values for hMT+ are shown in bold.
Figure 9.
Individual fMRI responses during 5 and 100% contrast in patients P4 and P5. Representative coronal slices demonstrating the striate (left column) and extrastriate cortex (middle column) in two patients (P4 and P5). Both patients have sustained V1 damage to the left hemisphere. The top row in each case demonstrates stimulation of the sighted field, and blind field responses are shown below. The far right column depicts activity corresponding significantly to a linear relationship with increasing contrast. Activation is superimposed on representative axial slices, centered on the peak voxel. Mixed-effects analyses, p < 0.001 uncorrected for a priori ROIs; elsewhere, cluster corrected, p < 0.05. Results displayed on T1-weighted structural images.
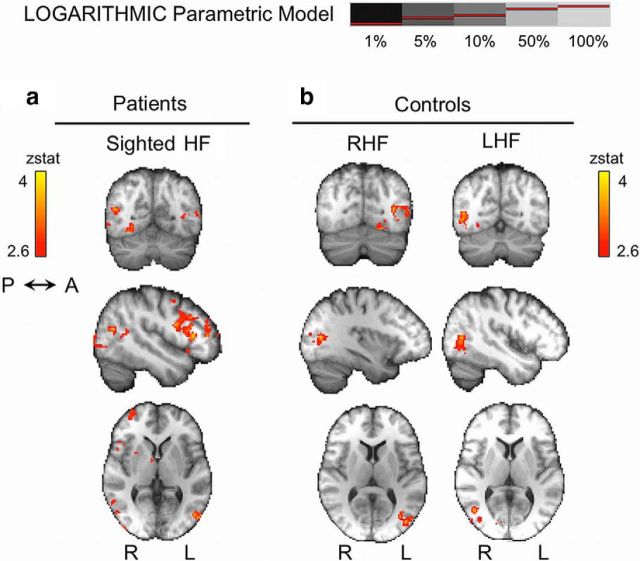
For the sighted hemifield in patients, there was a significant fit with the logarithmic model in regions corresponding to hMT+ bilaterally, as well as the right paracingulate gyrus (for representative brain slices, see Fig. 10a; for full details, see Table 2). In controls, contralateral hMT+ also showed activity according to this model (Fig. 10b), as well as left V4 (during right hemifield stimulation) and an area at the border between right V1 and V2 (left hemifield stimulation; Table 2). For blind hemifield stimulation, no brain regions showed activity with a logarithmic relationship to stimulus contrast.
Figure 10.
Cortical regions demonstrating a significant logarithmic relationship with stimulus contrast. a, In patients, no regions respond logarithmically to contrast in the blind hemifield. In the sighted hemifield and in controls (b), there is a significant logarithmic relationship with contrast in hMT+ and V4 (for details, see Table 2). Mixed-effects analysis, p < 0.001 uncorrected for a priori ROIs; elsewhere, cluster corrected, p < 0.05. Results displayed on average high-resolution structural scans in MNI space. RHF, Right hemifield; LHF, left hemifield.
Is stimulus contrast or blindsight performance a better predictor of hMT+ activity?
It is clear that blindsight performance and fMRI activity in contralateral hMT+ both relate in some way to the strength of stimulus contrast in the blind hemifield. What is not clear is how hMT+ activity specifically relates to 2AFC performance and, indeed, whether it is the low-level features of stimulation inside the blind hemifield (i.e., stimulus contrast) or the ability for patients to detect a stimulus that is the stronger indicator of hMT+ activity.
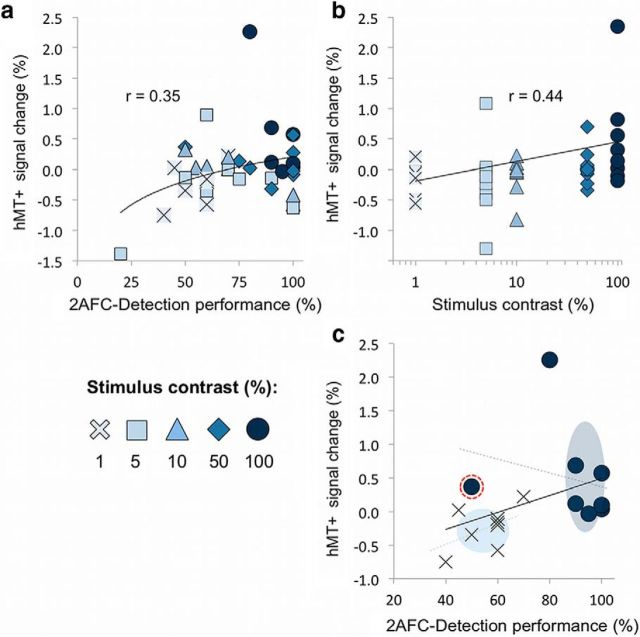
Across all participants, hMT+ activity showed a weak yet significant logarithmic relationship with blindsight performance (r = 0.35, p = 0.03; Fig. 11a). The contribution of stimulus contrast can be appreciated using color scaling and distinct symbols, with an anticipated clustering of higher-contrast stimuli toward the upper end of the performance axis. A comparable analysis (Fig. 11b) reiterates that hMT+ activity related linearly to contrast, exhibiting a stronger correlation coefficient (r = 0.44, p = 0.004).
Figure 11.
The relative influence of contrast and detection performance on hMT+ activity in patients. a, hMT+ shows a significant logarithmic relationship with blindsight performance across all patients, with the contribution of stimulus contrast appreciated using a color scale and distinct symbols. b, As shown previously, hMT+ shows a linear relationship with stimulus contrast. c, Results for only 1 and 100% contrast from a are replotted here. The overall trend line is shown (black line, r = 0.4), as well as individual trend lines for both contrast levels (dotted colored lines). Similar analyses were also performed for 5, 10, and 50% contrast (data not shown). There is clear clustering according to contrast in both the x (performance) and y (signal change) planes, illustrated by colored ellipses representing the mean and SD at each contrast level. The data point highlighted inside the dotted red circle indicates a different contrast–fMRI–performance relationship, which corresponds to results for the blindsight-negative patient (P3).
It is possible to completely remove stimulus contrast as a confound by examining how performance relates to hMT+ activity within identical contrast conditions (Fig. 11c). No contrast levels showed a significant linear relationship between hMT+ activity and performance, with coefficients ranging from −0.74 to 0.56, and the strongest positive correlation for stimuli of 1% contrast (p = 0.2; Fig. 11c, crosses). Interestingly, the patient without blindsight (P3) showed relatively high signal change at 100% contrast despite poor behavioral performance (Fig. 11c, dotted red circle). From this, it may be tempting to infer that fMRI activity can be driven by stimulus attributes, even in the absence of blindsight. However, significant noise in his fMRI responses make this difficult to assess in the absence of additional blindsight-negative patients.
Neural correlates of blindsight performance
Although hMT+ clearly has an important role in the perception of visual motion, it is also worth considering that blindsight performance may reflect activity in distinct brain regions that had not been detected from analyses so far. Group analysis revealed only small regions in the ventral portion of the anterior cingulate cortex and right amygdala that showed a significant linear relationship with behavioral 2AFC performance using an uncorrected analysis, but this was not significant when corrected for multiple voxel analyses [p < 0.001 uncorrected, peak Z = 3.3, MNI coordinates (−6, 32, −12); Z = 3.3, MNI coordinates (28, −4, −16)]. Thus, there were no reliable linear correlates of blindsight performance, including the visual cortex.
Discussion
This study provides new quantitative data on contrast sensitivity and functional neuroimaging in a group of patients with blindsight after cortical damage. The results show that, after V1 is damaged, hMT+ responses to stimulus contrast are changed, with responses now increasing linearly with contrast in a pattern more comparable with that seen in the healthy V1 of controls. Therefore, V1 is essential for the marked contrast sensitivity and early saturation that is typical of normal hMT+ responses. Because the dominant input to hMT+ is likely to involve the M pathway, which passes through V1, visual signals must reach hMT+ via alternative channels in patients with V1 damage.
The relationship between fMRI and neurophysiology in contrast responses
The vast majority of neuronal responses in MT are from the M channel, whereas a greater proportion of V1 neurons show responses of the parvocellular (P) variety (Maunsell et al., 1990; Movshon and Newsome, 1996). Typical neuronal responses reach half their maximum (C50) around levels of 30% contrast in the P channel compared with < = 10% for the M channel in V1 (Hawken and Parker, 1984; Tootell et al., 1988; Sclar et al., 1990). Human imaging studies produce similar results but with a slightly greater contrast sensitivity, with C50 close to 1% in hMT+ and 15% in V1 (Tootell et al., 1995; Boynton et al., 1996). Both measures are consistent with the control data presented here in which C50 is ∼2% in hMT+ and 35% in V1 when a logarithmic contrast scale is used. Small discrepancies may arise because C50 is influenced by stimulus size and eccentricity, because increased size results in greater spatial summation (Sclar et al., 1990). Similarly, sensitivity throughout the visual hierarchy declines with increasing eccentricity (Kaplan and Shapley, 1986; Livingstone and Hubel, 1988; Pointer and Hess, 1989). Therefore, the full-field stimuli used by Boynton et al., (1996) and implied by Tootell et al. (1995) would result in greater summation.
In the current study, specific stimulus parameters were chosen for two main reasons. (1) To allow comparison of the blind and sighted hemifields, stimuli had to be isolated to either hemifield rather than being presented at fixation. (2) The specific combination of size and eccentricity of visual stimuli was dictated by the pattern of field loss in patients, which was matched in controls (Fig. 1). fMRI provides an indirect measure of multiple neuronal responses, and this averaging of highly variable contrast–response functions may alter the overall response slope, accounting for a relatively low V1 C50 in neuroimaging studies compared with neurophysiology recordings (Boynton et al., 1996).
Blindsight performance and hMT+ activity in patients demonstrate a characteristic pattern of contrast sensitivity
fMRI responses in healthy control participants are very different from those when the stimulus is located in the blind hemifield of patients. Equivalent C50 in hMT+ of patients is ∼55%, with average contrast detection threshold (CDT) of 26%.
Even if one were to account for a loss of receptive field summation attributable to V1 damage and compare results with the LGN or normal V1, there are still clear differences because M cells in the LGN have a C50 of 11% contrast (Sclar et al., 1990). Therefore, we would expect any M-driven responses to be considerably more sensitive to contrast.
P-cells have a C50 more comparable with the current results, but even normal V1 and P channel contrast responses differ from the hMT+ results in patients for the following reasons. (1) C50 was higher in patients, i.e., slightly greater than 50%, as opposed to ∼30%. (2) There was no plateau of the hMT+ signal change in patients; rather, the response was linear up to maximum contrast levels. V1 neurons, although predominantly linear in their contrast response, exhibit a degree of response saturation (Albrecht and Hamilton, 1982; Ohzawa et al., 1982; Sclar et al., 1990). Furthermore, the low spatial and higher temporal frequencies of stimuli used here, which are suggested to be “optimal” for blindsight (Barbur et al., 1980; Sahraie et al., 2003, 2008), are somewhat different from typical P channel preferences (Derrington and Lennie, 1984; Foster et al., 1985; Sclar et al., 1990).
Discrepancies in the contrast sensitivity and spatiotemporal properties of hMT+ in the blind hemisphere compared with M and P channels are not surprising if one considers the anatomy of these pathways and the likelihood that both pass through V1 before reaching hMT+ (Hubel and Wiesel, 1972). Even any P channel-derived inputs to hMT+ are likely to be subject to summation and hence will likely saturate at a lower contrast than in V1. The fibers of the P pathway in particular undergo retrograde degeneration after damage to V1 (Dineen et al., 1982; Cowey et al., 1989). Surviving geniculate neurons are sparse and interspersed throughout the LGN with a mean diameter between M and P cell averages (Yukie and Iwai, 1981).
Koniocellular (K) LGN neurons are equivalent in number to M neurons and are located primarily in the interlaminar portions of the LGN (Hendry and Reid, 2000). Dominant input to some K LGN cells is from the S cones via blue ON retinal ganglion cells, and they project to cytochrome oxidase-rich blobs in V1 (Livingstone and Hubel, 1982; Fitzpatrick et al., 1983). However, multiple lines of evidence, including the presence of K cells in nocturnal species lacking S cones (Norton and Casagrande, 1982; Shostak et al., 2002), suggest that the K neurons represent a heterogeneous population that serves distinct roles (Rodman et al., 2001).
The K channel has been implicated in direct geniculate–extrastriate connections, with 70% of MT-projecting neurons in the macaque LGN originating in the interlaminar layers. Furthermore, 63% are defined as koniocellular by their neurochemical profile (Fries 1981; Rodman et al., 2001; Sincich et al., 2004). This anatomical evidence makes it interesting to consider the contrast sensitivity of these neurons. K cells show a range of contrast sensitivities more comparable with the P channel (C50 of 10–60%), whereas spatial frequency preferences are similar to M cells (White et al., 2001; Xu et al., 2001), particularly in K populations that are not driven by blue ON signals. The temporal resolution falls somewhere in between, with a cutoff that is slightly closer to M than P neurons (Xu et al., 2001). Therefore, K neurons represent a highly heterogeneous population, with distinct responses, functions, and innervations (Hendry and Reid, 2000; Szmajda et al., 2008; Warner et al., 2010). Nevertheless, such a pathway could also be consistent with the residual hMT+ activity and behavioral responses presented here.
Intact hemisphere responses for the sighted field are mostly normal
The similarity between blind hMT+ and normal V1 responses (but not normal hMT+) remained consistent regardless of whether comparing with controls or with the intact hemisphere and visual field of patients. Nevertheless, using patients as their own controls can be problematic, because a number of studies have identified impairments in the intact visual field of patients with hemianopia (Rizzo and Robin, 1996). These include impairments in contrast sensitivity (Hess and Pointer, 1989) and more complex procedures, such as perceptual grouping (Schadow et al., 2009). One explanation offered for these findings is an impairment of interhemispheric transfer, which may play a part in normal visual function (Rizzo and Robin, 1996; Perez et al., 2013). Although our patients all performed at ceiling for detection of 1% contrast in their intact visual field, slight differences in fMRI responses compared with controls could reflect impairments in this mechanism. However, the importance of scotoma size (and thus probably lesion size) on the degree of impairment and the lack of any difference when comparing retinotopically equivalent responses with non-equivalent regions in a large group of quadrantanopes (Bola et al., 2013) suggest a more global effect that may reflect additional regions of cortical damage.
hMT+ activity may reflect retinal and perceptual experience
When evaluating whether blindsight performance or stimulus contrast were stronger predictors of fMRI hMT+ activity, the evidence that we found weighed in favor of the low-level features. This may be surprising because hMT+ activity is often closely linked to perception rather than physical attributes (Zeki et al., 1993; Heeger et al., 1999). Indeed, a potential criticism could be that we did not measure behavior during fMRI acquisition, which would have dramatically increased scan time. Instead, stimuli were matched as closely as possible for size, position, and luminance between the two paradigms.
Normal contrast detection is likely to reflect a change in hMT+ signal that is at, or very close to, baseline. A similar mechanism may occur in blindsight patients, in which the 95% confidence interval for CDT corresponds to a range that spans the zero baseline for hMT+ signal change. At a cellular level, MT neurons continue, or even increase, spiking in the presence of non-conscious motion during binocular suppression (Panagiotaropoulos et al., 2012). Indeed, responses of some cells appear to reflect perceptual experience, whereas those of others are dictated by retinal input (Logothetis and Schall, 1989), and this appears to be somewhat dynamic (Maier et al., 2007). Neural responses measured with fMRI reflect a heterogeneous neuronal population that may incorporate both retinal and perceptually driven responses. It is possible that activation above baseline in hMT+ reflects a significant component of perceptually driven neurons, which is sufficient to generate some sort of perceptual experience facilitating detection. This could account for the steep increase and then plateau in 2AFC performance with increasing contrast. However, it is further complicated by the fact that these patients do not experience true conscious vision but show variability in awareness that merits additional investigation.
In conclusion, patients with V1 damage showed a linearly increasing response in hMT+ to increasing contrast. This pattern was very different from the typical early saturating response of hMT+ and showed reduced sensitivity compared with normal V1 and P-driven responses. The residual hMT+ activity could arise from known K projections, although confirmation would benefit from additional investigation into the contrast responses of this neuronal population.
Footnotes
This work was supported by the Wellcome Trust (S.A., G.R.), the Royal Society (H.B.), and the National Institute for Health Research Oxford Biomedical Research Centre based at Oxford University Hospitals National Health Service Trust and the University of Oxford (C.K.). We thank all the participants for taking part in this study.
The authors declare no competing financial interests.
References
- Albrecht DG, Hamilton DB. Striate cortex of monkey and cat: contrast response function. J Neurophysiol. 1982;48:217–237. doi: 10.1152/jn.1982.48.1.217. [DOI] [PubMed] [Google Scholar]
- Amunts K, Malikovic A, Mohlberg H, Schormann T, Zilles K. Brodmann's areas 17 and 18 brought into stereotaxic space-where and how variable? Neuroimage. 2000;11:66–84. doi: 10.1006/nimg.1999.0516. [DOI] [PubMed] [Google Scholar]
- Andersson JLR, Jenkinson M, Smith SM. Functional MRI of the Brain technical report. Oxford, UK: TR07JA1; 2007. Non-linear optimisation. [Google Scholar]
- Barbur JL, Ruddock KH, Waterfield VA. Human visual responses in the absence of the geniculo-calcarine projection. Brain. 1980;103:905–928. doi: 10.1093/brain/103.4.905. [DOI] [PubMed] [Google Scholar]
- Bola M, Gall C, Sabel BA. The second face of blindness: processing speed deficits in the intact visual field after pre- and post-chiasmatic lesions. PLoS One. 2013;8:e63700. doi: 10.1371/journal.pone.0063700. [DOI] [PMC free article] [PubMed] [Google Scholar]
- Boynton GM, Engel SA, Glover GH, Heeger DJ. Linear systems analysis of functional magnetic resonance imaging in human V1. J Neurosci. 1996;16:4207–4221. doi: 10.1523/JNEUROSCI.16-13-04207.1996. [DOI] [PMC free article] [PubMed] [Google Scholar]
- Brainard DH. The Psychophysics Toolbox. Spat Vis. 1997;10:433–436. doi: 10.1163/156856897X00357. [DOI] [PubMed] [Google Scholar]
- Bridge H, Thomas O, Jbabdi S, Cowey A. Changes in connectivity after visual cortical brain damage underlie altered visual function. Brain. 2008;131:1433–1444. doi: 10.1093/brain/awn063. [DOI] [PubMed] [Google Scholar]
- Bridge H, Hicks SL, Xie J, Okell TW, Mannan S, Alexander I, Cowey A, Kennard C. Visual activation of extra-striate cortex in the absence of V1 activation. Neuropsychologia. 2010;48:4148–4154. doi: 10.1016/j.neuropsychologia.2010.10.022. [DOI] [PMC free article] [PubMed] [Google Scholar]
- Cowey A, Stoerig P, Perry VH. Transneuronal retrograde degeneration of retinal ganglion cells after damage to striate cortex in macaque monkeys: selective loss of P beta cells. Neuroscience. 1989;29:65–80. doi: 10.1016/0306-4522(89)90333-3. [DOI] [PubMed] [Google Scholar]
- Derrington AM, Lennie P. Spatial and temporal contrast sensitivities of neurones in lateral geniculate nucleus of macaque. J Physiol. 1984;357:219–240. doi: 10.1113/jphysiol.1984.sp015498. [DOI] [PMC free article] [PubMed] [Google Scholar]
- Dineen J, Hendrickson A, Keating EG. Alterations of retinal inputs following striate cortex removal in adult monkey. Exp Brain Res. 1982;47:446–456. doi: 10.1007/BF00239362. [DOI] [PubMed] [Google Scholar]
- Fitzpatrick D, Itoh K, Diamond IT. The laminar organization of the lateral geniculate body and the striate cortex in the squirrel monkey (Saimiri sciureus) J Neurosci. 1983;3:673–702. doi: 10.1523/JNEUROSCI.03-04-00673.1983. [DOI] [PMC free article] [PubMed] [Google Scholar]
- Foster KH, Gaska JP, Nagler M, Pollen DA. Spatial and temporal frequency selectivity of neurones in visual cortical areas V1 and V2 of the macaque monkey. J Physiol. 1985;365:331–363. doi: 10.1113/jphysiol.1985.sp015776. [DOI] [PMC free article] [PubMed] [Google Scholar]
- Fries W. The projection from the lateral geniculate nucleus to the prestriate cortex of the macaque monkey. Proc R Soc Lond B Biol Sci. 1981;213:73–86. doi: 10.1098/rspb.1981.0054. [DOI] [PubMed] [Google Scholar]
- Goebel R, Muckli L, Zanella FE, Singer W, Stoerig P. Sustained extrastriate cortical activation without visual awareness revealed by fMRI studies of hemianopic patients. Vision Res. 2001;41:1459–1474. doi: 10.1016/S0042-6989(01)00069-4. [DOI] [PubMed] [Google Scholar]
- Hawken MJ, Parker AJ. Contrast sensitivity and orientation selectivity in lamina IV of the striate cortex of Old World monkeys. Exp Brain Res. 1984;54:367–372. doi: 10.1007/BF00236238. [DOI] [PubMed] [Google Scholar]
- Heeger DJ, Boynton GM, Demb JB, Seidemann E, Newsome WT. Motion opponency in visual cortex. J Neurosci. 1999;19:7162–7174. doi: 10.1523/JNEUROSCI.19-16-07162.1999. [DOI] [PMC free article] [PubMed] [Google Scholar]
- Hendry SH, Reid RC. The koniocellular pathway in primate vision. Annu Rev Neurosci. 2000;23:127–153. doi: 10.1146/annurev.neuro.23.1.127. [DOI] [PubMed] [Google Scholar]
- Hess RF, Pointer JS. Spatial and temporal contrast sensitivity in hemianopia. A comparative study of the sighted and blind hemifields. Brain. 1989;112:871–894. doi: 10.1093/brain/112.4.871. [DOI] [PubMed] [Google Scholar]
- Hubel DH, Wiesel TN. Laminar and columnar distribution of geniculo-cortical fibres in macaque monkey. J Comp Neurol. 1972;146:421–450. doi: 10.1002/cne.901460402. [DOI] [PubMed] [Google Scholar]
- Jenkinson M, Smith SM. A global optimisation method for robust affine registration of brain images. Med Image Anal. 2001;5:143–156. doi: 10.1016/S1361-8415(01)00036-6. [DOI] [PubMed] [Google Scholar]
- Jenkinson M, Bannister P, Brady JM, Smith SM. Improved optimisation for the robust and accurate linear registration and motion correction of brain images. Neuroimage. 2002;17:825–841. doi: 10.1006/nimg.2002.1132. [DOI] [PubMed] [Google Scholar]
- Kaplan E, Shapley RM. The primate retina contains two types of ganglion cells, with high and low contrast sensitivity. Proc Natl Acad Sci U S A. 1986;83:2755–2757. doi: 10.1073/pnas.83.8.2755. [DOI] [PMC free article] [PubMed] [Google Scholar]
- Kleiner M, Brainard DH, Pelli D. What's new in Psychtoolbox-3? Perception. 2007;36 ECVP Abstract Supplement. [Google Scholar]
- Leh SE, Johansen-Berg H, Ptito A. Unconscious vision: new insights into the neuronal correlate of blindsight using diffusion tractography. Brain. 2006;129:1822–1832. doi: 10.1093/brain/awl111. [DOI] [PubMed] [Google Scholar]
- Livingstone MS, Hubel DH. Thalamic inputs to cytochrome oxidase-rich regions in monkey visual cortex. Proc Natl Acad Sci U S A. 1982;79:6098–6101. doi: 10.1073/pnas.79.19.6098. [DOI] [PMC free article] [PubMed] [Google Scholar]
- Livingstone MS, Hubel DH. Do the relative mapping densities of the magno- and parvocellular systems vary with eccentricity? J Neurosci. 1988;8:4334–4339. doi: 10.1523/JNEUROSCI.08-11-04334.1988. [DOI] [PMC free article] [PubMed] [Google Scholar]
- Logothetis NK, Schall JD. Neuronal correlates of subjective visual perception. Science. 1989;245:761–763. doi: 10.1126/science.2772635. [DOI] [PubMed] [Google Scholar]
- Maier A, Logothetis NK, Leopold DA. Context-dependent perceptual modulation of single neurons in primate visual cortex. Proc Natl Acad Sci U S A. 2007;104:5620–5625. doi: 10.1073/pnas.0608489104. [DOI] [PMC free article] [PubMed] [Google Scholar]
- Malikovic A, Amunts K, Schleicher A, Mohlberg H, Eickhoff SB, Wilms M, Palomero-Gallagher N, Armstrong E, Zilles K. Cytoarchitectonic analysis of the human extrastriate cortex in the region of V5/MT+: a probabilistic, stereotaxic map of area hOc5. Cereb Cortex. 2007;17:562–574. doi: 10.1093/cercor/bhj181. [DOI] [PubMed] [Google Scholar]
- Maunsell JH, Nealey TA, DePriest DD. Magnocellular and parvocellular contributions to responses in the middle temporal visual area (MT) of the macaque monkey. J Neurosci. 1990;10:3323–3334. doi: 10.1523/JNEUROSCI.10-10-03323.1990. [DOI] [PMC free article] [PubMed] [Google Scholar]
- Movshon JA, Newsome WT. Visual response properties of striate cortical neurons projecting to area MT in macaque monkeys. J Neurosci. 1996;16:7733–7741. doi: 10.1523/JNEUROSCI.16-23-07733.1996. [DOI] [PMC free article] [PubMed] [Google Scholar]
- Naka KI, Rushton WA. S-potentials from luminosity units in the retina of fish (Cyprinidae) J Physiol. 1966;185:587–599. doi: 10.1113/jphysiol.1966.sp008003. [DOI] [PMC free article] [PubMed] [Google Scholar]
- Nelles G, Widman G, de Greiff A, Meistrowitz A, Dimitrova A, Weber J, Forsting M, Esser J, Diener HC. Brain representation of hemifield stimulation in poststroke visual field defects. Stroke. 2002;33:1286–1293. doi: 10.1161/01.STR.0000013685.76973.67. [DOI] [PubMed] [Google Scholar]
- Norton TT, Casagrande VA. Laminar organization of receptive-field properties in lateral geniculate nucleus of bush baby (Galago crassicaudatus) J Neurophysiol. 1982;47:715–741. doi: 10.1152/jn.1982.47.4.715. [DOI] [PubMed] [Google Scholar]
- Ohzawa I, Sclar G, Freeman RD. Contrast gain control in the cat visual cortex. Nature. 1982;298:266–268. doi: 10.1038/298266a0. [DOI] [PubMed] [Google Scholar]
- Panagiotaropoulos TI, Deco G, Kapoor V, Logothetis NK. Neuronal discharges and gamma oscillations explicitly reflect visual consciousness in the lateral prefrontal cortex. Neuron. 2012;74:924–935. doi: 10.1016/j.neuron.2012.04.013. [DOI] [PubMed] [Google Scholar]
- Perez C, Peyrin C, Cavézian C, Coubard O, Caetta F, Raz N, Levin N, Doucet G, Andersson F, Obadia M, Gout O, Héran F, Savatovsky J, Chokron S. An FMRI investigation of the cortical network underlying detection and categorization abilities in hemianopic patients. Brain Topogr. 2013;26:264–277. doi: 10.1007/s10548-012-0244-z. [DOI] [PubMed] [Google Scholar]
- Pointer JS, Hess RF. The contrast sensitivity gradient across the human visual field: with emphasis on the low spatial frequency range. Vision Res. 1989;29:1133–1151. doi: 10.1016/0042-6989(89)90061-8. [DOI] [PubMed] [Google Scholar]
- Riddoch G. On the relative perceptions of movement and a stationary object in certain visual disturbances due to occipital injuries. Proc R Soc Med. 1917;10:13–34. [PMC free article] [PubMed] [Google Scholar]
- Rizzo M, Robin DA. Bilateral effects of unilateral visual cortex lesions in human. Brain. 1996;119:951–963. doi: 10.1093/brain/119.3.951. [DOI] [PubMed] [Google Scholar]
- Rodman HR, Sorenson KM, Shim AJ, Hexter DP. Calbindin immunoreactivity in the geniculo-extrastriate system of the macaque: implications for heterogeneity in the koniocellular pathway and recovery from cortical damage. J Comp Neurol. 2001;431:168–181. doi: 10.1002/1096-9861(20010305)431:2<168::AID-CNE1063>3.0.CO%3B2-N. [DOI] [PubMed] [Google Scholar]
- Rottschy C, Eickhoff SB, Schleicher A, Mohlberg H, Kujovic M, Zilles K, Amunts K. Ventral visual cortex in humans: cytoarchitectonic mapping of two extrastriate areas. Hum Brain Mapp. 2007;28:1045–1059. doi: 10.1002/hbm.20348. [DOI] [PMC free article] [PubMed] [Google Scholar]
- Sahraie A, Weiskrantz L, Barbur JL, Simmons A, Williams SC, Brammer MJ. Pattern of neuronal activity associated with conscious and unconscious processing of visual signals. Proc Natl Acad Sci U S A. 1997;94:9406–9411. doi: 10.1073/pnas.94.17.9406. [DOI] [PMC free article] [PubMed] [Google Scholar]
- Sahraie A, Trevethan CT, Weiskrantz L, Olson J, MacLeod MJ, Murray AD, Dijkhuizen RS, Counsell C, Coleman R. Spatial channels of visual processing in cortical blindness. Eur J Neurosci. 2003;18:1189–1196. doi: 10.1046/j.1460-9568.2003.02853.x. [DOI] [PubMed] [Google Scholar]
- Sahraie A, Trevethan CT, MacLeod MJ. Temporal properties of spatial channel of processing in hemianopia. Neuropsychologia. 2008;46:879–885. doi: 10.1016/j.neuropsychologia.2007.11.008. [DOI] [PubMed] [Google Scholar]
- Schadow J, Dettler N, Paramei GV, Lenz D, Fründ I, Sabel BA, Herrmann CS. Impairments of Gestalt perception in the intact hemifield of hemianopic patients are reflected in gamma-band EEG activity. Neuropsychologia. 2009;47:556–568. doi: 10.1016/j.neuropsychologia.2008.10.012. [DOI] [PubMed] [Google Scholar]
- Schoenfeld MA, Noesselt T, Poggel D, Tempelmann C, Hopf JM, Woldorff MG, Heinze HJ, Hillyard SA. Analysis of pathways mediating preserved vision after striate cortex lesions. Ann Neurol. 2002;52:814–824. doi: 10.1002/ana.10394. [DOI] [PubMed] [Google Scholar]
- Sclar G, Maunsell JH, Lennie P. Coding of image contrast in central visual pathways of the macaque monkey. Vision Res. 1990;30:1–10. doi: 10.1016/0042-6989(90)90123-3. [DOI] [PubMed] [Google Scholar]
- Shostak Y, Ding Y, Mavity-Hudson J, Casagrande VA. Cortical synaptic arrangements of the third visual pathway in three primate species: Macaca mulatta, Saimiri sciureus, and Aotus trivirgatus. J Neurosci. 2002;22:2885–2893. doi: 10.1523/JNEUROSCI.22-07-02885.2002. [DOI] [PMC free article] [PubMed] [Google Scholar]
- Sincich LC, Park KF, Wohlgemuth MJ, Horton JC. Bypassing V1: a direct geniculate input to area MT. Nat Neurosci. 2004;7:1123–1128. doi: 10.1038/nn1318. [DOI] [PubMed] [Google Scholar]
- Smith SM. Fast robust automated brain extraction. Hum Brain Mapp. 2002;17:143–155. doi: 10.1002/hbm.10062. [DOI] [PMC free article] [PubMed] [Google Scholar]
- Szmajda BA, Grünert U, Martin PR. Retinal ganglion cell inputs to the koniocellular pathway. J Comp Neurol. 2008;510:251–268. doi: 10.1002/cne.21783. [DOI] [PubMed] [Google Scholar]
- Tootell RBH, Reppas JB, Kwong KK, Malach R, Born RT, Brady TJ, Rosen BR, Belliveau JW. Functional analysis of human MT and related visual cortical areas using magnetic resonance imaging. J Neurosci. 1995;15:3215–3230. doi: 10.1523/JNEUROSCI.15-04-03215.1995. [DOI] [PMC free article] [PubMed] [Google Scholar]
- Tootell RB, Hamilton SL, Switkes E. Functional anatomy of macaque striate cortex. IV. Contrast and magno-parvo streams. J Neurosci. 1988;8:1594–1609. doi: 10.1523/JNEUROSCI.08-05-01594.1988. [DOI] [PMC free article] [PubMed] [Google Scholar]
- Warner CE, Goldshmit Y, Bourne JA. Retinal afferents synapse with relay cells targeting the middle temporal area in the pulvinar and lateral geniculate nuclei. Front Neuroanat. 2010;4:8. doi: 10.3389/neuro.05.008.2010. [DOI] [PMC free article] [PubMed] [Google Scholar]
- Weiskrantz L, Warrington EK, Sanders MD, Marshall J. Visual capacity in the hemianopic field following a restricted occipital ablation. Brain. 1974;97:709–728. doi: 10.1093/brain/97.1.709. [DOI] [PubMed] [Google Scholar]
- White AJ, Solomon SG, Martin PR. Spatial properties of koniocellular cells in the lateral geniculate nucleus of the marmoset Callithrix jacchus. J Physiol. 2001;533:519–535. doi: 10.1111/j.1469-7793.2001.0519a.x. [DOI] [PMC free article] [PubMed] [Google Scholar]
- Xu X, Ichida JM, Allison JD, Boyd JD, Bonds AB, Casagrande VA. A comparison of koniocellular, magnocellular and parvocellular receptive field properties in the lateral geniculate nucleus of the owl monkey (Aotus trivirgatus) J Physiol. 2001;531:203–218. doi: 10.1111/j.1469-7793.2001.0203j.x. [DOI] [PMC free article] [PubMed] [Google Scholar]
- Yukie M, Iwai E. Direct projection from the dorsal lateral geniculate nucleus to the prestriate cortex in macaque monkeys. J Comp Neurol. 1981;201:81–97. doi: 10.1002/cne.902010107. [DOI] [PubMed] [Google Scholar]
- Zeki S, Ffytche DH. The Riddoch syndrome: insights into the neurobiology of conscious vision. Brain. 1998;121:25–45. doi: 10.1093/brain/121.1.25. [DOI] [PubMed] [Google Scholar]
- Zeki S, Watson JDG, Frackowiak RSJ. Going beyond the information given: the relation of illusory motion to brain activity. Proc Biol Sci. 1993;252:215–222. doi: 10.1098/rspb.1993.0068. [DOI] [PubMed] [Google Scholar]
- Zihl J, von Cramon D. Registration of light stimuli in the cortically blind hemifield and its effect on localization. Behav Brain Res. 1980;1:287–298. doi: 10.1016/0166-4328(80)90022-4. [DOI] [PubMed] [Google Scholar]


