

Summary
Little is known about the physiology of neurons in Caenorhabditis elegans. Using new techniques for in situ patch-clamp recording in C. elegans, we analyzed the electrical properties of an identified sensory neuron (ASER) across four developmental stages and 42 unidentified neurons at one stage. We find that ASER is nearly isopotential and fails to generate classical Na+ action potentials. Rather, ASER displays a high sensitivity to input currents coupled to a depolarization-dependent reduction in sensitivity that may endow ASER with a wide dynamic range. Voltage clamp revealed depolarization-activated K+ and Ca2+ currents that contribute to high sensitivity near the zero-current potential. The depolarization-dependent reduction in sensitivity can be attributed to activation of K+ current at voltages where it dominates the net membrane current. The voltage dependence of membrane current was similar in all neurons examined, suggesting that C. elegans neurons share a common mechanism of sensitivity and dynamic range.
Introduction
The comparative simplicity of the nematode C. elegans invites a comprehensive description of the development, structure, and function of an entire nervous system. The developmental lineage of its 302 neurons has been described completely (Sulston and Horvitz, 1977). Much of the synaptic connectivity in the adult hermaphrodite has been reconstructed from electron micrographs (Albertson and Thomson, 1976; White et al., 1986). To date, the analysis of neuronal function in C. elegans has focused on genetic and molecular methods. More than 350 genes have been shown to affect neuronal function and behavior (Hodgkin et al., 1995). Many of these genes are likely to be involved in essential aspects of neuron function, including synaptic vesicle release (Nonet et al., 1993; Iwasaki et al., 1997), sensory transduction (Driscoll and Chalfie, 1991; Chalfie, 1993; Sengupta et al., 1996), and synaptic integration (Hart et al., 1995; Maricq et al., 1995). Genes that encode vesicular neurotransmitter transporters (Alfonso et al., 1993; McIntire et al., 1997) and ionic channels (Komatsu et al., 1996; Elkes et al., 1997; Johnston et al., 1997) have also been characterized. In C. elegans, therefore, molecular analysis of the function of each of its neurons seems an attainable goal.
The full potential of C. elegans for molecular analysis of neuronal function has not been realized, however, because of the absence of electrophysiological recordings from neurons in this important model system. C. elegans presents some unusual challenges for electrophysiology, since this microscopic worm is protected by a pressurized cuticle that explodes when dissected and its neuronal cell bodies are only 2 μm in diameter. Thus, some of the most basic questions of how C. elegans neurons work remain unanswered. Do C. elegans neurons fire action potentials? What is the electrotonic structure of C. elegans neurons? What ionic currents do they express? And, how do these ionic currents shape the electrical responses of C. elegans neurons? Clearly, these questions must be answered in wild-type neurons before analysis of the cellular basis of nervous system mutations can proceed.
As a first step in this analysis, we developed a method for tight-seal, whole-cell patch-clamp recording from identified C. elegans neurons in situ. We used this method to study wild-type C. elegans neurons in two complementary experiments. First, we analyzed a single, identified chemosensory neuron (ASER) at all stages of larval development (L1–L4). To identify ASER unambiguously, we combined in situ patch clamping with neuron-specific expression of green fluorescent protein (GFP) (Chalfie et al., 1994). Second, we surveyed many unidentified neurons at the earliest stage of larval development (L1). This enabled us to determine whether the electrical properties of ASER are typical of C. elegans neurons in general.
Here, we provide evidence that many neurons in C. elegans are nearly isopotential in the steady state. None of the neurons examined in the present study fired classical, Na+ action potentials in response to current injection, although graded, nonlinear responses were observed. All neurons exhibited an outward potassium current, IK, activated by depolarization. In ASER, this outward current was opposed by an inward current carried by Ca2+ over the voltage range where the effective input resistance was greatest. Membrane resistance was reduced at voltages where IK became the dominant ionic current. We propose, therefore, that IK contributes to both the maintenance and modulation of sensitivity in these neurons. Our results complement existing genetic analyses of neuronal function and provide a new basis for the understanding of how genes affect neuron function and behavior in C. elegans.
Results
Preparation of C. elegans for In Situ Patch Clamping
An approximately synchronous culture of larval C. elegans was obtained as described (Sulston and Hodgkin, 1988) and transferred to the surface of an agarose-coated coverslip that formed the floor of a glass recording chamber. Prior to dissection, individual animals were immobilized with cyanoacrylate glue (see Experimental Procedures). Neurons were exposed for whole-cell patch-clamp recording by nicking the cuticle with a glass dissecting needle, forming a bouquet of 10–20 neuronal cell bodies (Figure 1A). Typically, we recorded from a single neuron in each animal.
Figure 1. In Situ Patch-Clamp Recording of the Chemosensory Neuron ASER.
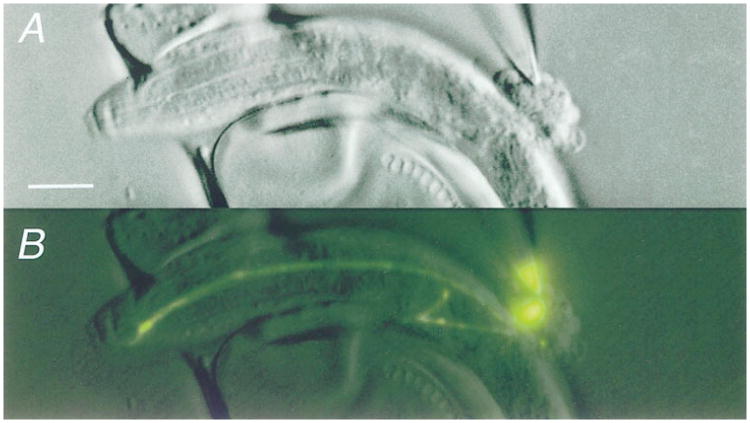
(A) Nomarski-DIC micrograph showing exposed neuronal cell bodies and a recording pipette sealed to ASER. Scale bar is 10 μm, anterior is left.
(B) Fluorescence micrograph of the same field as in (A), showing the GFP label in ASER. In (A) and (B), the intact membrane patch is visible inside the pipette. Micrographs in (A) and (B) were digitally enhanced for clarity.
Two groups of embryonically derived neurons were examined in phenotypically wild-type animals: (1) a single, GFP-labeled neuron (ASER) in the transgenic strain, lin-15(n765ts);gcy-5∷GFP (Yu et al., 1997) (stages L1– L4), and (2) unidentified neurons in the wild-type strain, N2 (stage L1). ASER is a putative chemosensory neuron (Ward et al., 1975; Ware et al., 1975; Bargmann and Horvitz, 1991). It is the only cell in lin-15(n765ts);gcy-5∷GFP animals that expresses GFP (Yu et al., 1997). As shown in Figure 1B, ASER was identified by locating its fluorescent cell body within the bouquet. The adult morphology of ASER is already apparent at hatching: it is an unbranched, bipolar neuron with an amphid neurite that innervates the amphid sense organ and a ring neurite that travels in the circumpharyngeal nerve ring and contains all of ASER's putative synaptic sites (White et al., 1986). Both neurites remained in place and attached to the cell body after it was exposed for electrical recording (Figure 1B). ASER retained the GFP label until the membrane patch was ruptured for whole-cell recording, indicating that the cell remained intact.
The whole-cell capacitance of ASER increased with body length during all four larval stages. This observation could reflect an increase in ASER's surface area, an increase in the spread of voltage along ASER's neurites, or both. To distinguish among these possibilities, we estimated the surface area of each ASER cell, calculated the capacitance expected if ASER were isopotential (Ciso) from the product of the cell surface area and specific membrane capacitance (1 μF/cm2), and compared the result to Cin. Surface area was calculated by assuming that ASER is composed of a pair of cylindrical neurites joined by a spherical soma (see Figure 2A). For each ASER recording, Cin was not significantly different from Ciso (Figure 2B). This analysis shows that a steady-state voltage applied to the soma was sufficient to charge the surface membrane of ASER uniformly and indicates that ASER was well space clamped and electrotonically compact throughout larval development.
Figure 2. ASER Morphology, Capacitance, and Steady-State Voltage Attenuation.
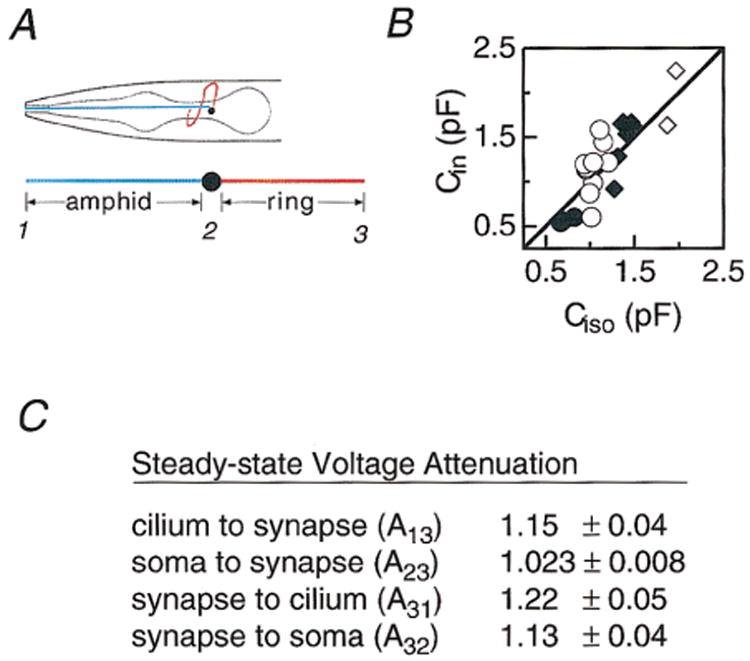
(A) ASER morphology and method for estimating neurite length. Amphid neurite length was defined as the distance between the anterior of the worm and the anterior edge of the terminal bulb of the pharynx; ring neurite length was defined as the circumference of the terminal bulb of the pharynx. Anterior is left (adapted from White et al., 1986).
(B) Input capacitance, Cin, versus the capacitance predicted if ASER were isopotential, Ciso. The straight line is Cin = Ciso. The best-fit line had a slope of 1.07 ± 0.08 (slope ± 95% confidence interval).
(C) Steady-state voltage attenuation. Attenuation was calculated between the numbered points shown in (A) from a passive cable model of ASER. Values are the mean ± SD of 23 ASER cells in L1–L4 worms.
Passive Electrical Signaling in ASER
We next examined voltage attenuation between the distal tips of the neurites in ASER, considering only its passive membrane properties. In the motor neurons of Ascaris suum, a larger, parasitic nematode, passive spread of membrane voltage is believed to be sufficient to mediate electrical signaling (Davis and Stretton, 1989). Is this property shared by C. elegans neurons? Because C. elegans neurons are small, it was not practical to measure voltage attenuation directly by recording from two distant locations in a single neuron. Instead, we computed voltage attenuation from the morphology of ASER and estimates of neurite length constants.
For a uniform cylindrical neurite, the length constant, λ, is given by:
| (1) |
where d is the diameter of the neurite and R is the ratio of Rm, the specific membrane resistance, and Ra, the specific axial resistance. Rather than estimating Rm and Ra separately, we obtained their ratio, R, using a novel approach (see Experimental Procedures). To facilitate comparison of the electrotonic structure of ASER with other neurons, we also computed the electrotonic length, L, the ratio of neurite length to λ. For both amphid and ring neurites, L was substantially less than 1. The average values of L were 0.37 ± 0.3 (n = 23) and 0.21 ± 0.04 (n = 23) for the amphid and ring neurites, respectively.
In addition, we calculated steady-state attenuation between the numbered points indicated in Figure 2A. The computation is described fully in Experimental Procedures. Briefly, we used the standard definition of attenuation, Ajk = Vj/Vk (Koch et al., 1983), where Vj is the voltage at the point where an input is applied and Vk is the voltage at the point where attenuation is being measured. Thus, Ajk ranges from 1 (no attenuation) to ∞ (complete attenuation). The soma did not significantly affect Ajk and was omitted from this calculation. Attenuation along the ring neurite (A23 and A32) was close to 1 for steady-state inputs applied at either end of the neurite (Figure 2C), indicating that the ring neurite is nearly isopotential. A32 was greater than A23 because of the current sink provided by the amphid neurite. Average attenuation along the length of the entire cell (A13 and A31) was only slightly larger for both an afferent signal applied to the amphid tip and monitored at distal synapse (A13) and an efferent signal going in the opposite direction (A31). Because calculation of steady-state attenuation relied on a lower-bound estimate of R (see Experimental Procedures), the true values are likely to be even closer to 1 (no attenuation). Nonetheless, our estimate of the maximum voltage attenuation along the length of ASER (1.2) compares well with attenuations measured in other nonspiking neurons (1.1–1.5; Hudspeth et al., 1977; Cannone and Bush, 1980; Wang-Bennett and Glantz, 1987; van Hateren and Laughlin, 1990) that transmit electrical signals over long distances in vivo.
Nonlinear Potentials in ASER
The foregoing analysis indicates that action potentials are not needed for signal transmission in ASER. Consistent with this view, current injection depolarized ASER (Figure 3), but failed to elicit classical, brief action potentials (n = 9). Spontaneous action potentials were also absent from both on-cell (n = 23) and whole-cell recordings (n = 13). These observations are also consistent with a search of the available C. elegans genomic sequence, covering more than 75% of the protein-coding genes, that found no voltage-gated Na+ channel genes (see Experimental Procedures). Thus, ASER appears to lack classical, Na+ action potentials. Additional support for this idea comes from the observation that inward current in ASER does not require external Na+ (see below). For two reasons, however, we cannot exclude the possibility that ASER is capable of producing Ca2+-dependent action potentials or other Ca2+-dependent regenerative behaviors. First, the pipette seal acts as a substantial shunt to ground, since the seal resistance (∼15 GΩ) is comparable to the input resistance of the cell (see below). Second, the uncompensated pipette capacitance (∼1.2 pF) provides a significant capacitive load, since it is comparable to the whole-cell capacitance (0.5–3 pA). The resistive shunt and capacitive load provided by the recording pipette may have prevented Ca2+ action potentials by increasing the amount of regenerative current needed to produce an action potential.
Figure 3. Voltage Responses to Current Injection.

(A) The response to ±2 pA pulses (0.5 s).
(B) The response to ±4 pA pulses (0.5 s) in the same cell as in (A). The numbered traces indicate the response to the initial (trace 1) and subsequent (traces 2 and 3) presentations of depolarizing voltage pulses. In (A) and (B), the response to hyperpolarizing pulses was stable and the traces overlapped. The time between presentations was 156 s. Brief, depolarizing events (*) were observed near the zero current potential.
Even though no action potentials were observed, the response to current injection was characterized by striking nonlinearities, including an inflection point during the rising phase and a plateau during the falling phase (Figure 3). Steady-state depolarization was graded with stimulus amplitude and showed saturation over a small range of amplitudes (2–10 pA). The apparent input resistance, measured from the response to hyperpolarizing current pulses, varied between 2.0 and 8.4 GΩ (n = 9). The response to depolarizing current was labile, since its rate of rise, steady-state amplitude, and plateau duration declined during whole-cell recordings. For example, a +2 pA current pulse initially evoked a large, complex response (trace 1, Figure 3A) that depolarized ASER by ∼40 mV while the same stimulus applied 156 s later depolarized the cell by only 4 mV (trace 2, Figure 3A). The response to a larger stimulus was less labile, such that each presentation of a +4 pA current pulse depolarized ASER by ∼60 mV. Note that the rate of rise and plateau duration declined with each presentation of a +4 pA current pulse (Figure 3B). The deterioration in the nonlinear voltage response is unlikely to result from a nonspecific decline in the quality of the recording, since the zero-current potential and the response to hyperpolarizing current pulses were unchanged. These observations are consistent with washout of a depolarization-activated ionic current that does not contribute significantly to the maintenance of the zero-current potential. A voltage-dependent Ca2+ current is a likely candidate (see below).
Voltage Noise Near Rest
In nearly all of our ASER recordings, we observed transient voltage events at potentials less than about −45 mV. These events were characterized by an exponential rise and fall (see Figure 3, asterisk). At present, their origin is unknown: they could be miniature postsynaptic potentials or, because the apparent input resistance of ASER is quite high (see above), they could be the result of brief openings of single, nonsynaptic ion channels. We have observed similar events in recordings of unidentified neurons in wild-type (N2) L1 larvae, indicating that this type of voltage noise is a common feature of C. elegans neurons.
Membrane Current in ASER
To identify the ionic currents that underlie the nonlinear voltage response shown in Figure 3, we examined membrane current in ASER in voltage clamp. Figure 4A shows membrane current evoked by a family of voltage pulses between −154 and +46 mV (20 mV increments, Vh = −74 mV) in an L1 and an L3 animal. Net membrane current was qualitatively similar in a total of 22 ASER recordings. The main features were an apparently time-independent inward current activated by hyperpolarization to less than −90 mV and a rapidly activating outward current activated by depolarization. Outward current decayed exponentially with a mean time constant of 18.4 ± 5 ms (n = 22) at +46 mV. A small sustained outward current was apparent at the end of the 80 ms voltage step. Both the transient and sustained currents were blocked by superfusion with 20 mM 4 –aminopyridine (4-AP, n = 3; data not shown) and by substitution of N-methyl-d-glucamine (NMG) for K+ in the recording pipette (n = 20), indicating that both components are K+ currents (Ik).
Figure 4. Net Membrane Current in ASER.

(A) Current evoked by a family of 80 ms voltage pulses between −146 and +46 mV (20 mV increments; holding potential = −74 mV) in an L1 and an L3 animal.
(B) The steady-state I–V curves for four animals of different body lengths. Length (in μm) is indicated to the right of each curve. Steady-state current was defined as the mean of the current flowing in the last 5 ms of the voltage pulse.
To estimate the voltage dependence of IK, we computed chord conductance by dividing the peak outward current activated by depolarization from −94 mV by the driving force for K+ ions (V – Ek). The equilibrium potential, EK, was computed from the Nernst equation and the K+ concentrations of the internal and external saline. On average, chord conductance increased e-fold in 30 mV and was half-maximal at +12 mV (n = 3). The peak amplitude of IK at +46 mV decreased following prepulses to more than about −80 mV, suggesting that outward current decay results from voltage-dependent inactivation. Inactivation was more steeply voltage dependent than activation, increasing e –fold in 12 mV with a half-inactivation voltage of −48 mV.
The steady-state I–V relation showed regions of inward and outward current separated by a flat region of negligible net membrane current between −90 and −30 mV (Figure 4B). This flat region in the I–V relation could signal an absence of ion channel activity between −90 and −30 mV or a balance of inward and outward currents active between −90 and −30 mV. To distinguish between these possibilities, we blocked the outward current by substituting NMG for internal K+. This maneuver revealed a sustained inward current that was activated by depolarization to greater than −50 mV (closed circles, Figure 5A). Thus, in the voltage range between −50 and −30 mV, there must be an equal and opposite K+ current that acts to maintain the flat I–V region observed under more physiological conditions. Despite an increase in the amplitude of outward K+ current with body length, the flat I–V region is maintained throughout development (Figure 4B). This observation suggests that the ratio of Ca2+ to K+ channels is held constant as the animal develops.
Figure 5. Inward Current in ASER.

(A) Average steady-state current evoked by 80 ms voltage pulses from −60 mV (20 mV increments) in the presence of saline containing 1 mM Ca2+ (closed circles, n = 9) and 110 mM Ba2+ (open circles, n = 5). Each point is the mean ± SEM. Smooth lines were fit to the data using the function: I = Gmax(V – Er) (1/[1 + exp([V0 – V]/Vs)]). The parameters were (Gmax, Er, V0, and Vs): 1 mM Ca2+ (0.12 nS, +21 mV, −25 mV, and +8 mV); 110 mM Ba2+ (1.0 nS, +62 mV, −9.5 mV, and +12 mV).
(B) Micro- and macroscopic Ba2+ current. Current evoked by a voltage ramp between −106 and +94 mV (300 ms duration). The holding potential between ramps was −76 mV (2 s duration). The transient current evoked by the initial step to −106 mV was omitted for clarity. The inset is an all-points histogram of conductance between −100 and −60 mV.
(C) Peak Ba2+ current versus time after break-in. Data were normalized to −59 pA, the peak Ba2+ current recorded immediately after break-in. Inward currents were not recorded during the gap. Similar results were obtained in three ASER recordings. The pipette contained NMG in place of K+.
The flat region of the I–V curve implies that ASER behaves as if steady-state membrane resistance, defined as the ratio of voltage to steady-state current, is nearly infinite between −90 and −30 mV. We refer to this part of the steady-state I–V curve as a region of high phenomenological resistance by analogy to the “phenomenological impedance” introduced to explain subthreshold oscillations in the squid giant axon (Mauro et al., 1970). It is maintained between −50 and −30 mV, despite the fact that K+ and Ca2+ channels open with depolarization over this voltage interval and, together, furnish a considerable membrane conductance. How can a neuron behave as if resistance is very high and yet have a considerable membrane conductance? This paradoxical situation occurs when currents with similar voltage dependence and amplitude flow in opposite directions at the same time. In ASER, IK and ICa remain equal and opposite as Vm is depolarized from −50 to −30 mV. Thus, depolarization produces little additional net current, resulting in a high phenomenological resistance. A similar mechanism has been described in vertebrate hair cells, where the opposition of K+ and Ca2+ currents is instrumental in maximizing sensitivity over a narrow range of sound frequencies (see Fettiplace, 1987; Art and Goodman, 1996).
We have identified the inward current as a Ca2+ current (ICa) based on the following characteristics: (1) it reaches a peak near −15 mV (closed circles, Figure 5A); (2) it was unaffected by substitution of NMG for Na+ in the external saline (data not shown); and (3) its amplitude increased when Ba2+ replaced all external divalent cations (6 mM; data not shown) and increased further (∼10-fold) during superfusion with 110 mM Ba2+ (open circles, Figure 5A). All inward currents were measured in L1 animals.
Closer examination of inward current carried by Ba2+ revealed several interesting features. Figure 5B shows the Ba2+ current evoked by a series of voltage ramps. The I–V curve from the response to a voltage ramp (Figure 5B) is similar to the steady-state I–V curve from the response to 80 ms voltage steps (Figure 5A). Thus, the ramp I–V accurately measures the Ba2+ current's steady-state voltage dependence. At hyperpolarized potentials, single channel openings could be resolved, suggesting that the number of Ca2+ channels in ASER is quite small. Plotting peak Ba2+ current against time revealed an exponential decline in the Ba2+ current amplitude during whole-cell recording with a time constant of 85 s (Figure 5C). Assuming a linear single channel conductance with a reversal potential of 70 mV, the maximum conductance just after breaking in, Gmax(0), was 1.27 nS. Addition of Na2ATP to the recording pipette solution did not prevent washout (data not shown, n = 3).
The Number of Calcium Channels in ASER
Barium current was used to estimate single channel conductance (in 110 mM Ba2+) and the maximum number of Ca2+ channels available in ASER. To estimate single channel conductance (γ), the traces in Figure 5B were converted to conductance and used to construct an all-points conductance histogram from the data recorded between −100 and −60 mV (inset, Figure 5B). The single, nonzero peak indicates γ = 40 pS. In order to compute conductance, it was necessary to assume that the single channel i–V relation was linear between −100 and −60 mV. In vertebrate neurons, open channel current recorded from on-cell patches with 110 mM Ba2+ is linear over a large voltage range, departing from linearity only in the vicinity of the reversal potential (Church and Stanley, 1996). Thus, provided that C. elegans Ca2+ channels are similar, the error in our estimate of γ is small. The maximum number of Ca2+ channels available just after breaking in is approximately equal to Gmax(0)/γ or 32. This is a surprisingly small number and raises the possibility that the number of Ca2+ channels expressed by ASER is closely regulated.
Membrane Current in Other C. elegans Neurons
To determine if membrane current in ASER was typical of C. elegans neurons, we surveyed membrane current in 42 unidentified neurons in wild-type, L1 animals. The survey was confined to the lateral, ventral, and dorsal ganglia just anterior to the terminal bulb of the pharynx. This region of the nervous system includes putative sensory neurons, interneurons, and motor neurons (White et al., 1986). Like membrane current in ASER, membrane current in these unidentified neurons was characterized by an inward current activated by hyperpolarization and an outward current activated by depolarization (Figure 6A). Unidentified neurons also had near-zero net membrane current between about −90 and −30 mV, suggesting that most C. elegans neurons have a broad voltage region of high phenomenological resistance and sensitivity. Preliminary pharmacological characterization of outward current in unidentified neurons indicated that it was blocked by 4-AP (5 mM, n = 2), consistent with outward current being carried mostly by voltage-gated K+ channels. However, superfusion with tetraethylammonium ions (100 mM, n = 6) had little effect.
Figure 6. Comparison of Net Membrane Current in ASER and Unidentified Neurons in L1 Animals.

(A) Steady-state I–V relations in ASER (black trace) and 42 unidentified neurons in N2 animals (gray traces). All recordings were from L1 animals. Steady-state current was defined as in Figure 4 and I–V relations were normalized to the current measured at +46 mV.
(B) Time constant of outward current decay in 22 ASER recordings (black) and in the same 42 unidentified neurons as in (A) (gray). Time constants were measured by fitting a single exponential function to the outward current elicited by an 80 ms voltage step to +46 mV from −74 mV in each recording.
In nearly all neurons examined, outward current appeared to inactivate during depolarizing voltage steps. In all cases, the time course of inactivation was well fit by a single exponential function. Figure 6B shows a histogram of decay time constants measured at +46 mV in 42 unidentified neurons in L1 animals and in 22 ASER recordings in L1–L4 animals. The variation in decay rates is greater among unidentified neurons than that observed in ASER recordings, indicating that it reflects differences in the K+ currents expressed by different neurons. The variation in neuronal K+ current kinetics could arise through several mechanisms, including differential expression of K+ channel α subunits. Consistent with this idea, there are a large number (≥38) of predicted K+ channel α subunit genes in the C. elegans genome (Wei et al., 1996). Differential expression of these genes alone or in combination with β subunits could form the basis of functional differences among neurons in C. elegans.
Discussion
To answer fundamental questions about neuronal function in C. elegans, we developed techniques for in situ patch clamping of single, identified neurons. We find that C. elegans neurons can signal effectively without classical, Na+ action potentials and exhibit a high sensitivity to input currents over a wide voltage range. Sensitivity derives, at least in part, from the opposition of two voltage-dependent currents, IK and ICa. It is reduced with depolarization through additional activation of IK. Our results provide new insights into sensory processing and, as discussed below, clarify the interpretation of several mutant phenotypes affecting neuronal function and behavior in C. elegans.
Sensory Integration in ASER
The fact that ASER is nearly isopotential has two main consequences for sensory integration. First, like other chemosensory neurons, ASER makes synapses on interneurons and receives input from other chemosensory neurons and interneurons (White et al., 1986). All of the synaptic sites are located along the ring neurite. Because the ring neurite is nearly isopotential, its synapses cannot be electrically independent. This limits the ability of ASER to send different signals to different postsynaptic neurons. Second, the modest efferent attenuation indicates that postsynaptic potentials (PSPs) spread with little attenuation to the sensory cilium, the presumed site of chemotransduction (Lewis and Hodgkin, 1977; Perkins et al., 1986). Thus, PSPs could affect the voltage at the cilium and thereby alter sensory potentials activated during chemotransduction. This provides a direct and rapid way for other neurons to regulate the response of ASER to the chemical environment.
Active Mechanisms for High Sensitivity
Small current pulses (2–4 pA) are sufficient to depolarize ASER by tens of millivolts (Figure 3), indicating that ASER is extremely sensitive to small changes in membrane current. What is the mechanism of this high sensitivity? In principle, high sensitivity to current inputs can be achieved through high resistance, positive feedback, or both. Our results suggest that both mechanisms operate in ASER. First, a region of high phenomenological resistance is apparent between −90 and −30 mV in all ASER recordings. Between −50 and −30 mV, high phenomenological resistance results from active opposition of ICa and IK. Second, ICa is likely to increase sensitivity by providing positive feedback for depolarization in the voltage range where its steady-state I–V relation exhibits a negative slope (−50 to −15 mV; see Figure 5A). The pronounced inflection point in the rising phase of ASER's voltage response (Figure 3) suggests that positive feedback does indeed occur. The inflection point diminished with a time course similar to the decline in the peak amplitude of ICa, implying that an intact ICa is needed for the production of the normal voltage response. Thus, loss-of-function mutations in the genes encoding Ca2+ channel subunits might impair ASER's sensitivity to chemical stimuli.
Dynamic Range
Chemotaxis assays indicate that C. elegans responds to a range of chemical stimulus concentrations that spans at least three orders of magnitude (Ward, 1973). How is this wide dynamic range achieved? We propose that voltage-dependent regulation of sensitivity in chemosensory neurons prevents the response to strong stimuli from saturating. Our results suggest that sensitivity is regulated by IK in ASER. Above −30 mV, IK dominates the steady-state membrane current (Figure 4). The increase in IK that occurs during depolarization to voltages greater than −30 mV decreases membrane resistance and thereby reduces sensitivity to input currents. The K+ current in ASER seems particularly well suited to this role, since its intrinsic voltage sensitivity is low (30 mV/e–fold change in conductance). In particular, the steady-state activation curve for IK predicts that ∼20% is available at −30 mV and that activation saturates only during depolarization to more than +80 mV. Because activation of IK can decrease membrane resistance in a voltage-dependent manner, current inputs would have progressively smaller effects on membrane potential over a wide voltage range between −30 and +80 mV. Potassium currents in other nonspiking, invertebrate sensory neurons appear to serve a similar function (Hardie, 1991; Weckström et al., 1991). The presence of IK in the other, unidentified neurons we studied suggests that they too maintain a wide dynamic range. Our results do not, however, rule out additional mechanisms for producing a wide dynamic range.
Ion Channel Expression in C. elegans Neurons
The high phenomenological resistance between −90 and −30 mV is preserved throughout larval development in ASER, despite an increase in the amplitude of both hyperpolarization-activated inward current and depolarization-activated outward current. Surprisingly, neither the kinetics nor the voltage dependence of membrane current vary significantly during the course of larval development. Taken together, these observations suggest that the spectrum of ion channel genes expressed by ASER is established at hatching and that the number of ion channels inserted in the membrane is tightly regulated throughout development.
From analysis of Ba2+ currents (Figures 5B and 5C; L1), we estimated that ASER has available at most ∼30 Ca2+ channels. These Ca2+ channels appear to provide positive feedback for depolarization, contribute to a high phenomenological resistance, and probably also regulate the release of neurotransmitter vesicles. ASER has 25 synaptic release sites (White et al., 1986). If all Ca2+ channels in ASER were localized to these synaptic release sites, then, on average, there would be fewer than ∼2 Ca2+ channels per release site. Our estimate is consistent with the idea that a few Ca2+ channels are sufficient to mediate synaptic vesicle release. Additional support for this idea comes from recordings of chick ciliary ganglion neurons that showed that neurotransmitter release persists under conditions in which Ca2+ channels were open one at a time (Stanley, 1993). In contrast, in vertebrate hair cells (Roberts et al., 1990) and the squid giant synapse (Simon and Llinas, 1985; Zucker and Fogelson, 1986), vesicle release is believed to require the near-simultaneous activation of between 80 and 900 channels, respectively.
Significance for Other C. elegans Neurons
Many C. elegans neurons share the simple bipolar morphology of ASER, including 32 chemosensory neurons (White et al., 1986). The ASH chemosensory neurons encode responses to two different modalities: nose touch and high osmotic strength (Kaplan and Horvitz, 1993). The glutamate receptor subunit GLR-1 is required for nose touch avoidance, but not osmotic avoidance, suggesting that ASH signals high osmotic strength to postsynaptic neurons in a different way from nose touch (Hart et al., 1995; Maricq et al., 1995). In principle, there are two general mechanisms by which ASH might produce different outputs. First, high osmolarity might cause a voltage change different in amplitude, time course, or other details from that caused by nose touch. Second, high osmolarity might excite regions of ASH not excited by nose touch, because of different distributions of the respective sensory receptors, for instance. Our results, implying that ASH, like ASER, is nearly isopotential, rule out the second mechanism.
Several chemosensory neurons, including ASE, undergo aberrant patterns of ring neurite outgrowth when the cyclic nucleotide–gated channel β subunit, TAX-2, is mutant (Coburn and Bargmann, 1996). TAX-2 is preferentially expressed in the ring neurite of chemosensory neurons, raising the possibility that outgrowth is influenced by localized electrical signals in the ring neurite. Our results showing that ring neurites in chemosensory neurons are very nearly isopotential make the existence of such signals questionable. Rather, our results favor the idea proposed by Coburn and Bargmann (1996) that TAX-2 provides a localized chemical signal, such as Ca2+ influx.
Comparison of recordings from ASER and other neurons present in L1 animals suggests that the electrical properties of ASER are shared by many C. elegans neurons. The net membrane current of all neurons, including ASER, had a region of high phenomenological resistance between −90 and −30 mV that was flanked by regions of inward and outward current. In all neurons examined, outward current dominated at voltages above −30 mV, suggesting that voltage-dependent regulation of sensitivity is a common feature of C. elegans neurons. Like outward current in ASER, outward current in other neurons appeared to inactivate during sustained depolarization. However, the inactivation rate varied widely among the other neurons examined. This diversity in K+ channel kinetics could fine-tune the time course of voltage responses in C. elegans neurons. Significant heterogeneity in K+ channel inactivation rates has also been observed in identified molluscan neurons (Serrano and Getting, 1989), supporting the idea that cell-to-cell variation in K+ channel kinetics endows each neuron with a unique voltage response. Using the techniques presented here, it should be possible to examine both the source of variation and its functional significance by recording from other identified neurons in C. elegans.
Experimental Procedures
Preparation and Dissection
C. elegans larvae were collected in distilled water from an approximately synchronous culture (Sulston and Hodgkin, 1988) and concentrated by centrifugation (3 min at 3000 rpm). Nematodes were transferred to an agarose-coated coverslip sealed with beeswax over a hole in a glass plate, forming a recording chamber. Nematodes were anesthetized by placing the chamber on the surface of a chilled (4°C), water-filled tissue-culture flask (50 ml, Falcon 3014) on the stage of a dissecting microscope and fixed to the coverslip with cyanoacrylate glue (Nexaband Quick Seal, Veterinary Products Laboratory, Phoenix, AZ). The chamber was rinsed with distilled water to remove unglued animals, filled with extracellular saline, and transferred to the stage of an inverted microscope (Zeiss Axiovert 135). Electrical recordings were made during the first hour after gluing. Dissection proceeded in two steps. First, internal pressure was relieved by puncturing the cuticle at the level of the developing vulva with a glass dissecting needle. Second, cell bodies of neurons in the head were exposed using the needle to open a slit in the cuticle. Neuronal cell bodies emerged through the slit, forming a hemispherical bouquet (Figure 1A).
Electrophysiology
The microscope was equipped with Nomarski-DIC optics and a 63×/1.4 NA oil immersion objective. The headstage was mounted by means of an aluminum interface plate to a piezo-electric manipulator (MP-300, Sutter Instruments, Novato, CA) mounted on the microscope stage. The interface plate included a ceramic pipette clamp to reduce pipette movement. Recording pipettes were pulled from low softening temperature (700°C), soda-lime glass (R6, 0.8 mm inner diameter, 1.2 mm outer diameter, Garner Glass, Claremont, CA) to a tip diameter of 2–4 μm on a micropipette puller (P–2000, Sutter Instruments, Novato, CA), coated with Sylgard 184, and fire polished. Pipettes had a resistance of 5–15 MΩ when filled with normal internal saline.
Membrane current and voltage were amplified with an Axopatch 200A (Axon Instruments, Foster City, CA) with the following customizations for recording from small neurons: (1) the current-clamp sensitivity was reduced to 100 pA/mV; (2) the range of whole-cell capacitance compensation was reduced to 1 pF/turn; (3) the duration and amplitude of the zap circuit was reduced to ∼60 μs and 7.2 V, respectively; and (4) current-clamp speed was increased so that a square command pulse applied across a C. elegans model neuron (input resistance, 5 GΩ; series resistance, 40 MΩ; input capacitance, ∼0.6 pF) yielded a current step that rose to 1/2 its maximum value in 25 μs. The whole-cell recording configuration was achieved by applying strong suction or gentle suction plus a brief voltage pulse (zap). The transition to whole-cell recording coincided with an increase in the amplitude and duration of the transient current elicited by a voltage pulse. To eliminate residual capacity currents, membrane current was calculated as the difference between the current measured in the whole-cell and on-cell recording configurations for the same voltage commands. Whole-cell capacitance and series resistance were measured from the response to a 10 ms, 20 mV voltage pulse from −74 mV. Series resistance had a mean value of 19 ± 9 MΩ (n = 41) and was not compensated since voltage errors were typically less than ∼4 mV. Analog data were filtered at 2–10 kHz and digitized at 10–50 kHz. Voltages were corrected for liquid junction potentials.
The ionic composition of the fluid surrounding C. elegans neurons in vivo is unknown. We used an external saline that supported pharyngeal pumping and normal electropharyngeograms in dissected animals (Avery et al., 1995) and was composed of (in mM): 145 NaCl, 5 KCl, 1 CaCl2, 5 MgCl2, 10 HEPES, and 20 d-glucose (pH 7.2, 320 mOsm). Drugs were added to the external saline at the expense of NaCl. Internal saline contained (in mM): 125 K gluconate, 18 KCl, 0.7 CaCl2, 2 MgCl2,10 K2EGTA, and 10 K HEPES (pH 7.2, 315 mOsm). For the experiments in Figure 5, K+ salts were replaced with NMG salts. In some recordings, Na2ATP (Boehringer-Mannheim, Indianapolis, IN) was added at the expense of NMG-Cl. Unless indicated, chemicals were purchased from Sigma Chemical (St. Louis, MO).
ASER Surface Area and Electron Microscopy
To calculate ASER surface area for capacitance calculations, we estimated neurite lengths after each recording and calculated neurite and soma diameters as described below. Amphid neurite length was estimated as the distance between the nose and the initial swelling of the terminal bulb of the pharynx. Ring neurite length was estimated as πdb, where db is the measured diameter of the terminal bulb (see Figure 2A). The body length of each physiology specimen was also recorded.
Neurite and soma diameters were measured in a separate population of larvae (n =10, L1–L4), fixed, and embedded for electron microscopy (EM) according to standard methods (Hall, 1995). The body length of each EM specimen was estimated as 17.5 times animal width at the excretory pore. Diameters were measured as follows. A planimeter program was used to measure diameter from the perimeter of amphid and ring neurites. Diameters were measured at nine positions along the amphid neurite and three positions along the ring neurite. Transverse sections sometimes yielded oblique sections of ring neurites. In these cases, we applied a stereological correction factor (1.2) to calculate the true diameter from measured perimeters (Weibel, 1979). Data were corrected for 10% shrinkage during fixation and condensed by finding the median neurite diameter in each section and averaging the medians for each neurite in each animal. We assumed the diameter of ASER's amphid neurite was comparable to the median amphid neurite diameter, as shown for adult animals (Ward et al., 1975; Ware et al., 1975). Similarly, we assumed the diameter of ASER's ring neurite was comparable to the median diameter of all neurites in the nerve ring. Neurite and soma diameter (in μm) were linearly related to body length (in μm), B, as follows: (1) amphid neurite diameter, da = 4.2 × 10⁻⁴B + 0.124 (R = 0.76, n = 7); (2) ring neurite diameter, dr = 4.2 × 10⁻⁴B + 0.040 (R = 0.89, n = 8); and (3) soma diameter, ds = 2.6 × 10⁻³B + 0.71 (R = 0.94, n = 5). These relations were used to determine soma and neurite diameter from body length for each ASER recording.
Steady-State Voltage Attenuation
To estimate steady-state voltage attenuation, we modeled each ASER in which whole-cell capacitance was measured (n = 23) as a pair of cylindrical cables (representing the ring and amphid neurites) joined at one end and sealed at the other. Soma and neurite diameters were estimated from the length of each animal as described above. The cables were not assumed to be isopotential. Attenuation, Ajk = Vj/Vk, was computed by solving the cable equation (Rall, 1977) analytically for Vk in response to an input Vj = 1 mV at each location (1, 2, and 3) shown in Figure 2A. To illustrate the method, we give the solutions at position 2 for an input at position 1 (Vk = V1):
| (2) |
where V3 is the voltages at location 2; la, lr, da, and dr are the lengths and diameters of the amphid and ring neurites, respectively; and λa and λr are the length constants of the amphid and ring neurites, respectively. The results are reported in Figure 2C as the mean ± SD for 23 ASER model cells.
Values for λa and λr in Equation 2 were computed from Equation 1, using an estimate of R determined as follows. For each ASER model, i, the theoretical capacitance, Ĉin, was computed as:
| (3) |
| (4) |
| (5) |
| (6) |
where Ĉs,i is soma capacitance; Ĉa,i and Ĉr,i are the capacitance of the ith amphid and ring neurites, respectively; Cm is specific membrane capacitance (1 μF/μm2); da,i and dr,i are the diameter of the ith amphid and ring neurites, respectively; and λa,i and λr,i are the length constants of the ith amphid and ring neurites, respectively. We assumed R was the same for the amphid and ring neurites in all neurons recorded. We found R by minimizing the sum-squared error (SSE) between Ĉin and the experimentally determined whole-cell capacitance, Cin, for the entire data set of 23 ASER recordings. SSEs were not statistically different over a wide range of R values in the vicinity of the best-fit value, Rfit. For our purposes, however, it was sufficient to obtain a lower bound on R, which we defined as the largest value of R less than Rfit that produced an SSE significantly different from the SSE for R = Rfit (P = 0.05, log-likelihood ratio test). The lower bound value of R was 59.5 cm.
There are two classes of error associated with this method of calculating steady-state voltage attenuation. First, there are errors associated with the calculation of whole–cell capacitance and cellular dimensions. There is both direct and indirect evidence that the true value of Cm is closer to 0.7 μF/cm2 (see Major et al., 1994, for a discussion). Using smaller values of Cm in our fitting method would tend to increase R and reduce attenuation. Neurite and soma diameters may be larger than our measurements indicate due to uncertainty in the extent of shrinkage during EM fixation. Errors of this type would also tend to reduce attenuation. Second, there is uncertainty in the value of R, since a wide range of values fit the data adequately (see above). Smaller values of R produce larger values of attenuation. We devised a statistical method for finding a lower bound on R and used this value to compute attenuation. A consequence of all of these uncertainties is that our calculation yields an upper limit on attenuation in ASER; the true values are likely to be closer to 1 (no attenuation).
Acknowledgments
We thank D. Garbers and S. Yu for the gift of lin-15(n765ts);gcy-5∷GFP; T. Ferrée, E. German, S. Owens, E. Martins, M. Lynch, and D. Raizen for assistance; J. J. Art, M. V. L. Bennett, M. Chalfie, V. Dionne, S. Firestein, T. Sejnowski, N. Spitzer, and J. Thomas for comments; and C. Bargmann, C. Loer, and V. Maricq for advice. Supported by the National Science Foundation, the National Institutes of Mental Health, the National Heart, Lung, and Blood Institute, the Office of Naval Research, The Sloan Foundation, and The Searle Scholars Program.
References
- Albertson DG, Thomson JN. The pharynx of Caenorhabditis elegans. Proc R Soc Lond B Biol Sci. 1976;275:299–325. doi: 10.1098/rstb.1976.0085. [DOI] [PubMed] [Google Scholar]
- Alfonso A, Grundahl K, Duerr JS, Han HP, Rand JB. The Caenorhabditis elegans unc-17 gene: a putative vesicular acetylcholine transporter. Science. 1993;261:617–619. doi: 10.1126/science.8342028. [DOI] [PubMed] [Google Scholar]
- Art JJ, Goodman MB. Ionic conductances and hair cell tuning in the turtle cochlea. Ann NY Acad Sci. 1996;781:103–122. doi: 10.1111/j.1749-6632.1996.tb15696.x. [DOI] [PubMed] [Google Scholar]
- Avery L, Raizen D, Lockery SR. Electrophysiological methods. In: Epstein HF, Shakes DC, editors. C elegans: Modern Biological Analysis of an Organism. San Diego, CA: Academic Press; 1995. pp. 251–268. [Google Scholar]
- Bargmann CI, Horvitz HR. Chemosensory neurons with overlapping functions direct chemotaxis to multiple chemicals in C. elegans. Neuron. 1991;7:729–742. doi: 10.1016/0896-6273(91)90276-6. [DOI] [PubMed] [Google Scholar]
- Cannone AJ, Bush BMH. Reflexes mediated by non-impulsive afferent neurones of thoracic-coxal muscle receptor organs in the crab, Carcinus maenas. J Exp Biol. 1980;86:305–331. [Google Scholar]
- Chalfie M. Touch receptor development and function in Caenorhabditis elegans. J Neurobiol. 1993;24:1433–1441. doi: 10.1002/neu.480241013. [DOI] [PubMed] [Google Scholar]
- Chalfie M, Tu Y, Euskirchen G, Ward WW, Prasher DC. Green fluorescent protein as a marker for gene expression. Science. 1994;263:802–805. doi: 10.1126/science.8303295. [DOI] [PubMed] [Google Scholar]
- Church PA, Stanley EF. Single L-type calcium channel conductance with physiological levels of calcium in chick ciliary ganglion neurons. J Physiol (Lond) 1996;496:59–68. doi: 10.1113/jphysiol.1996.sp021665. [DOI] [PMC free article] [PubMed] [Google Scholar]
- Coburn CM, Bargmann CI. A putative cyclic nucleotide–gated channel is required for sensory development and function in C. elegans. Neuron. 1996;17:695–706. doi: 10.1016/s0896-6273(00)80201-9. [DOI] [PubMed] [Google Scholar]
- Davis RE, Stretton AO. Passive membrane properties of motorneurons and their role in long-distance signaling in the nematode Ascaris. J Neurosci. 1989;9:403–414. doi: 10.1523/JNEUROSCI.09-02-00403.1989. [DOI] [PMC free article] [PubMed] [Google Scholar]
- Driscoll M, Chalfie M. The mec-4 gene is a member of a family of Caenorhabditis elegans genes that can mutate to induce neuronal degeneration. Nature. 1991;349:588–593. doi: 10.1038/349588a0. [DOI] [PubMed] [Google Scholar]
- Elkes DA, Cardozo DL, Madison J, Kaplan JM. EGL-36 Shaw channels regulate C.elegans egg-laying muscle activity. Neuron. 1997;19:165–174. doi: 10.1016/s0896-6273(00)80356-6. [DOI] [PubMed] [Google Scholar]
- Fettiplace R. Electrical tuning of hair cells in the inner ear. Trends Neurosci. 1987;10:421–425. [Google Scholar]
- Hall DH. Electron microscopy and 3D image reconstruction. In: Epstein HF, Shakes DC, editors. Caenorhabditis elegans: Modern Biological Analysis of an Organism. San Diego, CA: Academic Press; 1995. pp. 395–436. [Google Scholar]
- Hardie RC. Voltage-sensitive potassium channels in Drosophila photoreceptors. J Neurosci. 1991;11:3079–3095. doi: 10.1523/JNEUROSCI.11-10-03079.1991. [DOI] [PMC free article] [PubMed] [Google Scholar]
- Hart AC, Sims S, Kaplan JM. Synaptic code for sensory modalities revealed by C. elegans GLR-1 glutamate receptor. Nature. 1995;378:82–85. doi: 10.1038/378082a0. [DOI] [PubMed] [Google Scholar]
- Hodgkin J, Plasterk RH, Waterston RH. The nematode Caenorhabditis elegans and its genome. Science. 1995;270:410–414. doi: 10.1126/science.270.5235.410. [DOI] [PubMed] [Google Scholar]
- Hudspeth AJ, Poo MM, Stuart AE. Passive signal propagation and membrane properties in median photoreceptors of the giant barnacle. J Physiol (Lond) 1977;272:25–43. doi: 10.1113/jphysiol.1977.sp012032. [DOI] [PMC free article] [PubMed] [Google Scholar]
- Iwasaki K, Staunton J, Saifee O, Nonet M, Thomas JH. aex-3 encodes a novel regulator of presynaptic activity in C. elegans. Neuron. 1997;18:613–622. doi: 10.1016/s0896-6273(00)80302-5. [DOI] [PubMed] [Google Scholar]
- Johnston DB, Wei A, Butler A, Salkoff L, Thomas JH. Behavioral defects in C. elegans egl-36 mutants result from potassium channels shifted in voltage dependence of activation. Neuron. 1997;19:151–164. doi: 10.1016/s0896-6273(00)80355-4. [DOI] [PubMed] [Google Scholar]
- Kaplan JM, Horvitz HR. A dual mechanosensory and chemosensory neuron in Caenorhabditis elegans. Proc Natl Acad Sci USA. 1993;90:227–231. doi: 10.1073/pnas.90.6.2227. [DOI] [PMC free article] [PubMed] [Google Scholar]
- Koch C, Poggio T, Torre V. Nonlinear interactions in a dendritic tree: localization, timing, and role in information processing. Proc Natl Acad Sci USA. 1983;80:2799–2802. doi: 10.1073/pnas.80.9.2799. [DOI] [PMC free article] [PubMed] [Google Scholar]
- Komatsu J, Mori I, Rhee JS, Akaike N, Ohshima Y. Mutations in a cyclic nucleotide–gated channel lead to abnormal thermosensation and chemosensation in C. elegans. Neuron. 1996;17:707–718. doi: 10.1016/s0896-6273(00)80202-0. [DOI] [PubMed] [Google Scholar]
- Lewis JA, Hodgkin JA. Specific neuroanatomical changes in chemosensory mutants of the nematode Caenorhabditis elegans. J Comp Neurol. 1977;172:489–510. doi: 10.1002/cne.901720306. [DOI] [PubMed] [Google Scholar]
- Major G, Larkman AU, Jonas P, Sakmann B, Jack JJB. Detailed passive cable models of whole-cell recorded CA3 pyramidal neurons in rat hippocampal slices. J Neurosci. 1994;14:4613–4638. doi: 10.1523/JNEUROSCI.14-08-04613.1994. [DOI] [PMC free article] [PubMed] [Google Scholar]
- Maricq AV, Peckol E, Driscoll M, Bargmann CI. Mechanosensory signaling in C. elegans mediated by the GLR-1 glutamate receptor. Nature. 1995;378:78–81. doi: 10.1038/378078a0. [DOI] [PubMed] [Google Scholar]
- Mauro A, Conti F, Dodge R, Schor R. Subthreshold behavior and phenomenological impedance of the squid giant axon. J Gen Physiol. 1970;4:497–523. doi: 10.1085/jgp.55.4.497. [DOI] [PMC free article] [PubMed] [Google Scholar]
- McIntire SL, Reimer RJ, Schuske K, Edwards RH, Jorgensen EM. Identification and characterization of the vesicular GABA transporter. Nature. 1997;389:870–876. doi: 10.1038/39908. [DOI] [PubMed] [Google Scholar]
- Nonet ML, Grundahl K, Meyer BJ, Rand JB. Synaptic function is impaired but not eliminated in C. elegans mutants lacking synaptotagmin. Cell. 1993;73:1291–1305. doi: 10.1016/0092-8674(93)90357-v. [DOI] [PubMed] [Google Scholar]
- Perkins LA, Hedgecock EM, Thomson JN, Culotti JG. Mutant sensory cilia in the nematode Caenorhabditis elegans. Dev Biol. 1986;117:456–487. doi: 10.1016/0012-1606(86)90314-3. [DOI] [PubMed] [Google Scholar]
- Rall W. Core conductor theory and cable properties of neurons. In: Kandel ER, editor. Handbook of Physiology. Bethesda, MD: American Physiological Society; 1977. pp. 39–98. [Google Scholar]
- Roberts WM, Jacobs RA, Hudspeth AJ. Colocalization of ion channels involved in frequency selectivity and synaptic transmission at presynaptic active zones of hair cells. J Neurosci. 1990;10:3664–3684. doi: 10.1523/JNEUROSCI.10-11-03664.1990. [DOI] [PMC free article] [PubMed] [Google Scholar]
- Sengupta P, Chou JH, Bargmann CI. odr-10 encodes a seven transmembrane domain olfactory receptor required for responses to the odorant diacetyl. Cell. 1996;84:899–909. doi: 10.1016/s0092-8674(00)81068-5. [DOI] [PubMed] [Google Scholar]
- Serrano EE, Getting PA. Diversity of the transient outward potassium current in somata of identified molluscan neurons. J Neurosci. 1989;9:4021–4032. doi: 10.1523/JNEUROSCI.09-11-04021.1989. [DOI] [PMC free article] [PubMed] [Google Scholar]
- Simon SM, Llinas R. Compartmentalization of the submembrane calcium activity during calcium influx and its significance in transmitter release. Biophys J. 1985;48:485–498. doi: 10.1016/S0006-3495(85)83804-2. [DOI] [PMC free article] [PubMed] [Google Scholar]
- Stanley EF. Single calcium channels and acetylcholine release at a presynaptic nerve terminal. Neuron. 1993;11:1007–1011. doi: 10.1016/0896-6273(93)90214-c. [DOI] [PubMed] [Google Scholar]
- Sulston J, Hodgkin J. Methods. In: Wood WB, editor. The Nematode Caenorhabditis elegans. Plainview, NY: Cold Spring Harbor Press; 1988. pp. 587–605. [Google Scholar]
- Sulston JE, Horvitz HR. Post-embryonic cell lineages of the nematode Caenorhabditis elegans. Dev Biol. 1977;56:110–156. doi: 10.1016/0012-1606(77)90158-0. [DOI] [PubMed] [Google Scholar]
- van Hateren JH, Laughlin SB. Membrane parameters, signal transmission, and the design of a graded potential neuron. J Comp Physiol. 1990;166:437–448. doi: 10.1007/BF00192015. A. [DOI] [PubMed] [Google Scholar]
- Wang-Bennett LT, Glantz RM. The functional organization of the crayfish lamina ganglionaris. I Nonspiking monopolar cells. J Comp Physiol. 1987;161:131–145. doi: 10.1007/BF00609461. A. [DOI] [PubMed] [Google Scholar]
- Ward S. Chemotaxis by the nematode Caenorhabditis elegans: identification of attractants and analysis of the response by use of mutants. Proc Natl Acad Science USA. 1973;70:817–821. doi: 10.1073/pnas.70.3.817. [DOI] [PMC free article] [PubMed] [Google Scholar]
- Ward S, Thomson N, White JG, Brenner S. Electron microscopical reconstruction ofthe anterior sensory anatomy of the nematode Caenorhabditis elegans. J Comp Neurol. 1975;160:313–338. doi: 10.1002/cne.901600305. [DOI] [PubMed] [Google Scholar]
- Ware RW, Clark D, Crossland K, Russell RL. The nerve ring of the nematode Caenorhabditis elegans: sensory input and motor output. J Comp Neurol. 1975;162:71–100. [Google Scholar]
- Weckström M, Hardie RC, Laughlin SB. Voltage-activated potassium channels in blowfly photoreceptors and their role in light adaptation. J Physiol (Lond) 1991;440:635–657. doi: 10.1113/jphysiol.1991.sp018729. [DOI] [PMC free article] [PubMed] [Google Scholar]
- Wei A, Jegla T, Salkoff L. Eight potassium channel families revealed by the C. elegans genome project. Neuropharmacology. 1996;35:805–829. doi: 10.1016/0028-3908(96)00126-8. [DOI] [PubMed] [Google Scholar]
- Weibel ER. Stereological Methods. Vol. 1. New York: Academic Press; 1979. [Google Scholar]
- White JG, Southgate E, Thomson JN, Brenner S. The structure of the nervous system of the nematode Caenorhabditis elegans. Philos Trans R Soc Lond B Biol Sci. 1986;314:1–340. doi: 10.1098/rstb.1986.0056. [DOI] [PubMed] [Google Scholar]
- Yu S, Avery L, Baude E, Garbers DL. Guanylyl cyclase expression in specific sensory neurons: a new family of chemosensory receptors. Proc Natl Acad Sci USA. 1997;94:3384–3387. doi: 10.1073/pnas.94.7.3384. [DOI] [PMC free article] [PubMed] [Google Scholar]
- Zucker RS, Fogelson AL. Relationship between transmitter release and presynaptic calcium influx when calcium enters through discrete channels. Proc Natl Acad Sci USA. 1986;83:3032–3036. doi: 10.1073/pnas.83.9.3032. [DOI] [PMC free article] [PubMed] [Google Scholar]