

Abstract
BACKGROUND AND OBJECTIVE:
There is a paucity of prospective evidence examining the links between sedentary time (ST) and cardiometabolic outcomes in youth. We examined the associations between objectively assessed ST and moderate to vigorous physical activity (MVPA) in childhood with cardiometabolic risk in adolescence.
METHODS:
The study included 4639 children (47% male) aged 11 to 12 years at baseline whose mothers were enrolled in ALSPAC (Avon Longitudinal Study of Parents and Children) during their pregnancy in the early 1990s. A total of 2963 children had valid blood samples at age 15 to 16 years. Associations with baseline ST and MVPA were examined for BMI, waist circumference, body fat mass, lean body mass, systolic and diastolic blood pressure, fasting triglycerides, total cholesterol, low-density lipoprotein and high-density lipoprotein (HDL) cholesterol, glucose, insulin, C-reactive protein, and a clustered standardized cardiometabolic risk score (CMscore).
RESULTS:
Baseline ST was not associated deleteriously with any cardiometabolic markers. MVPA was beneficially associated with the 3 adiposity indicators, lean body mass, systolic blood pressure, triglycerides, C-reactive protein, insulin, HDL cholesterol, and CMscore; once the models were adjusted for baseline levels of these markers, these associations remained for body fat mass (mean difference per 10 minutes of MVPA: –0.320 [95% confidence interval (CI): –0.438 to –0.203]; P < .001), HDL cholesterol (0.006 logged mmol/L [95% CI: 0.001 to 0.011]; P = .028), insulin (–0.024 logged IU/L [95% CI: –0.036 to –0.013]; P < .001), and CMscore (–0.014 [95% CI: –0.025 to –0.004]; P = .009).
CONCLUSIONS:
We found no evidence linking ST in late childhood with adverse cardiometabolic outcomes in adolescence. Baseline MVPA was beneficially linked to broad cardiometabolic health in adolescence.
What’s Known on This Subject:
Evidence on the cardiometabolic consequences of sedentary behavior in youth is inconsistent and mostly relies on cross-sectional studies. Studies with objective measures of sedentary time have found limited evidence of cross-sectional associations with adiposity markers but no other outcomes.
What This Study Adds:
Objectively assessed daily sedentary time was not prospectively associated with cardiometabolic outcomes. Moderate to vigorous physical activity was beneficially associated with body fat mass, insulin, high-density lipoprotein cholesterol, and clustered cardiometabolic score.
Physically active children and adolescents have better cardiometabolic risk factor profiles than their inactive peers1,2 and are more likely to be active as adults.3 Recent epidemiologic studies in adults have found that sedentary time (ST), defined as low-energy-expenditure activities ≤1.5 metabolic equivalents in a sitting or reclining posture (eg, computer use, watching television4), is associated with increased all-cause5–7 and cardiovascular5,8 mortality risk independently of moderate to vigorous physical activity (MVPA). Cross-sectional studies have consistently shown that television viewing (but no other screen time) is associated with adverse levels of a range of cardiometabolic risk markers in youth.9–13 However, the relevance of these results to the sitting behavior overall may be limited because television viewing is a poor marker of overall ST.13
Two of the largest studies that have used an objective (accelerometer) assessment of time spent in ST reported null findings.14,15 The first study, which was a cross-sectional analysis of >5000 participants, found no independent association between time spent in MVPA and potential confounders of ST with adiposity.15 The second study was a pooled cross-sectional analysis of 14 accelerometry studies involving >20 000 children and adolescents aged 4 to 18 years. This study found no association of ST with waist circumference, blood pressure, insulin, triglycerides, or high-density lipoprotein cholesterol (HDL-C).14 This study also examined prospective associations with waist circumference in a subsample of ∼6500 participants and found no association between baseline ST and waist circumference at follow-up (mean follow-up: 2.1 years), although baseline waist circumference was associated with greater ST at follow-up. In both of these large cross-sectional studies,13,14 greater time spent in MVPA was beneficially associated with most outcomes.14,15 To our knowledge, there is only 1 small (n = 723) short-term (<7 months of follow-up) prospective study16 of young subjects that assessed objectively measured ST in relation to a range of cardiometabolic outcomes. This study, similar to the cross-sectional evidence described earlier, casts doubt on the idea that sitting warrants attention as a target for behavioral interventions in young people (separate from MVPA). This topic needs further exploration in larger prospective studies, particularly because there is evidence that children in Western populations spend considerable periods in ST; for example, the average daily accelerometry derived estimates of ST of 5- to 15-year-olds in England is 7 to 8 hours.17
The aim of the present study was to examine the prospective associations between accelerometer-measured ST and MVPA at age 11 to 12 years and a broad range of cardiometabolic risk markers in adolescence (age 15–16 years).
Methods
An unabridged Methods section can be found in the Supplemental Appendix. The following paragraphs offer a summary of the study procedures (Fig 1).
FIGURE 1.

ALSPAC cohort and study sample size.
Study Sample
We used data from ALSPAC (Avon Longitudinal Study of Parents and Children), a population-based birth cohort that recruited 14 541 pregnant women with expected delivery dates between April 1, 1991, and December 31, 1992 (www.alspac.bris.ac.uk).18 In the present analysis, the association between accelerometer data collected at age 11 to 12 years and biomarker data collected in clinics when the children were aged 15 to 16 years were examined. Ethics approval for the study was granted from the ALSPAC law and ethics committee and the local research ethics committees.19
Measures of ST and Physical Activity
Participants attending a clinic at ages 11 to 12 years and 13 to 14 years were asked to wear an accelerometer for 7 consecutive days during their waking hours (models CSA7164, 2.2, and GTM1; ActiGraph LLC, Fort Walton Beach, FL). The full accelerometry protocols have been described in detail previously20,21 and can be found in the Supplemental Appendix. ST was defined as time spent at <200 cpm,21,22 and MVPA was defined by using the internally derived ALSPAC-specific cutoff of 3600 cpm.20 Participants who wore accelerometers were aged 11 to 12 years (mean ± SD age: 11.8 ± 0.24 years) and 13 to 14 years (mean age: 13.9 ± 0.20 years) on the first day of accelerometer wear. A total of 5593 participants provided accelerometer data at age 11 to 12 years. Of those participants who did not provide accelerometer data at age 11 years, 876 provided accelerometer data at 13 to 14 years of age. For these participants, data at age 13 years were used instead of data at age 11 years; thus, there were 6469 total participants with accelerometer data at age 11 or 13 years. Because the majority of accelerometer data was generated from age 11 to 12 years, we refer to the baseline as “age 11 years” from this point on.
Outcome Measures
Among the 6469 participants who provided accelerometer data at age 11 years, biometric data were collect on 99.6% (n = 6446) at baseline and 4639 (72%) at follow-up at age 15 to 16 years (mean age: 15.4 ± 0.29 years [from this point forward referred to as “age 15 years”]) during which outcome measures were assessed. Of these, 3368 (73% of the 4639 who attended the 15-year clinic) had complete data on non–blood-based outcomes and 2963 (64%) had complete data on blood-based outcomes. The eligible sample for this study was defined as the 4639 participants with accelerometer data who attended the clinic before being issued an accelerometer and who also attended the clinic at age 15 years; the main analysis samples included 4639 subjects for non–blood-based outcomes (with imputation used to estimate outcomes for the 27% with missing data) and 2963 subjects for blood-based outcomes.
Measurement of the outcomes has been described in detail in a previous publication23 and can also be found in the Supplemental Appendix. Weight was measured to the nearest 0.1 kg by using Tanita scales, and height to the nearest 0.1 cm was measured with a stadiometer. A flexible tape was used to measure waist circumference to the nearest 1 mm at the mid-point between the lower ribs and the iliac crest.
Covariables
Potential confounding factors accounted for in the analyses included: gender; birth weight (kilograms); maternal BMI; paternal occupational social class (professional, managerial, skilled [manual], skilled [nonmanual], partly skilled, and unskilled); total energy intake at age 10 years (kcal/d), measured by using 3-day dietary records completed by the participants (with parental assistance as needed)24; Tanner puberty stage at age 11 years and age (months) at Tanner measurement; age (months) at the time of assessment of cardiometabolic and adiposity markers; accelerometer wear time (minutes/d) at age 11 years; time in months between accelerometry at age 11 years and measurement of cardiometabolic and adiposity outcomes at age 15 years; baseline adiposity (BMI), body fat mass (%), and waist circumference (centimeters); and systolic blood pressure (SBP) and diastolic blood pressure (DBP) (in millimeters of mercury) at age 11 years.
Dealing With Missing Data
Participants had varying amounts of missing data for covariables within the 2 main analysis samples. Taking into account only those children with complete data on all covariables, the complete case sample sizes were 1075 for the non–blood-based outcomes (20% of the 4639 eligible subjects for those outcomes) and 944 for the blood-based outcomes (35% of the 2967 eligible subjects for those outcomes) (Fig 1).
To minimize selection bias, missing values of all outcomes and covariates were imputed, with the exclusion of blood-based outcomes. For non–blood-based outcomes, the main analysis sample comprised respondents who provided accelerometry data at age 11 years and also attended the clinics at ages 11 and 15 years (n = 4639). Within this sample, missing values in all outcomes and covariates were imputed (accelerometer-measured sedentary/MVPA time had no missing values). For blood-based outcomes, the main analysis sample was further limited to the 2963 subjects who provided a blood sample. Missing values were imputed by using the multiple imputation procedure in SPSS version 21 (IBM SPSS Statistics, IBM Corporation, Armonk, NY), with linear regression as the type of imputation and the generation of 20 imputation data sets. All outcome, exposure, and covariate data were included as predictors in the imputation procedure. Further details of the imputation procedure, as well as key results from the observed (nonimputed) data set, are included in the Supplemental Appendix.
Data Handling and Statistical Analysis
Several outcome variables were logged to improve normality of residuals (waist circumference, triglycerides, HDL-C, C-reactive protein, glucose, and insulin). Due to the range of ages at which height and weight were measured, BMI was converted to an age- and gender-specific SD score (SDS) based on the Cole formula we used recently10 and is detailed elsewhere.25 Because we found no evidence of an interaction between gender and ST or MVPA in terms of the outcomes, analyses were adjusted for gender but were not gender-specific.
Multiple linear regression was used to examine associations between ST and MVPA and cardiometabolic and adiposity outcomes, adjusting for covariables. Cardiometabolic and adiposity outcomes consisted of BMI SDS, waist circumference, body fat mass, DBP and SBP (non–blood-based sample) and fasting triglycerides, HDL-C, total cholesterol, low-density lipoprotein cholesterol (LDL-C), C-reactive protein, glucose, and insulin (blood-based sample). Results were expressed as mean differences per 10 minutes/d in either ST or MVPA.
Models were checked for collinearity, and variance inflation factors in all models were all <2. Residual plots and statistics were checked for normality, heteroscedasticity, and independence.
In a subsample with valid accelerometry data at both 11 and 15 years of age, we examined whether baseline adiposity was associated with ST at follow-up by using multiple linear regression with BMI SDS (n = 2067), body fat mass (n = 1358), and waist circumference (n = 1789) at age 11 years as exposures and ST at age 15 years as the outcome.
A standardized continuous clustered cardiometabolic score (CMscore) was also calculated by using existing methods.10,26 The score comprised 10 of the cardiometabolic risk outcome variables (body fat mass, SBP, DBP, triglycerides, HDL-C, C-reactive protein, glucose, insulin, total cholesterol, and LDL-C). After log-transformation of triglycerides, HDL-C, C-reactive protein, glucose, and insulin, and taking the mean of SBP and DBP, z scores were computed for each component (z = [participant value – sample mean]/sample SD), and the sum of these z scores was divided by the number of components to compile the CMscore with units of SD. For HDL-C, the z score was multiplied by –1.
Because multiple linear regression is sensitive to the distribution of included variables, we also ran a set of sensitivity analyses by using general linear models with tertiles of accelerometer-measured ST and MVPA as the main exposure. Multivariable-adjusted coefficients and 95% confidence intervals (CIs) were calculated for each outcome with reference to the ST or MVPA tertile, and we present the results of these sensitivity analyses as estimated marginal means. SPSS version 21 was used for all analyses.
Results
Supplemental Table 6 presents characteristics of the nonimputed data set according to ST tertile at the corresponding age. ST tertiles were directly associated with baseline SBP and DBP, baseline levels of the 3 adiposity markers, and follow-up levels of BMI and body fat mass and were inversely associated with baseline MVPA, VPA, and lean body mass.
Tables 1 and 2 present the results of the multiple linear regression models describing the associations between (continuous) ST and MVPA, with each cardiometabolic risk marker and CMscore. There was evidence of a direct association between baseline ST and adiposity (BMI, waist, and body fat mass) at follow-up, but these associations were not independent of MVPA (model 3 in Table 1). When further adjusting for baseline adiposity (model 4), BMI and waist circumference were associated with ST, but this association was not in the expected direction. The inverse association between ST and lean mass was independent of MVPA (model 3) but not of baseline lean body mass (model 4). We found no evidence of an association between baseline ST and any blood markers or the clustered CMscore. As Table 2 (model 2) illustrates, there was evidence of an inverse association between baseline MVPA and all 3 adiposity indicators, SBP, triglycerides, C-reactive protein, insulin, and CMscore and a direct association with HDL-C and lean body mass. When further adjusting for baseline risk markers (model 3), these associations persisted for body fat mass, HDL-C, insulin, and CMscore, whereas there was a tendency for the associations with BMI and waist circumference to be inverted in the opposite expected direction. Further adjustments of the MVPA analyses for ST, which is common practice in the ST literature14 despite its questionable appropriateness,27 attenuated the associations with BMI and waist circumference to the null but had virtually no influence on the magnitude or direction of all other observed associations (data available on request).
TABLE 1.
Multivariable-Adjusted Associations Between Time Spent Sedentary at Age 11 Years and Cardiometabolic Risk Markers at Age 15 Years
| Variable | Non–Blood-Based Sample Outcomes (n = 4639) | |||
|---|---|---|---|---|
| Model 1a | Model 2b | Model 3c | Model 4d | |
| BMI SDS | 0.005 (0.000 to 0.010) | 0.005 (0.000 to 0.009) | 0.000 (–0.005 to 0.005) | −0.004 (–0.007 to –0.001) |
| Body fat mass, % | 0.057 | 0.059 | 0.006 | −0.005 |
| Lean body mass, % | −0.142 (–0.178 to –0.105) | −0.146 (–0.185 to –0.107) | −0.070 (–0.111 to –0.029) | 0.000 (–0.026 to 0.027) |
| Waist, cme | 0.001 (0.000 to 0.001) | 0.001 (0.000 to 0.001) | 0.000 (0.000 to 0.001) | −0.001 (–0.001 to 0.000) |
| SBP, mm Hg | 0.032 (–0.014 to 0.079) | 0.019 (–0.029 to 0.067) | −0.001 (–0.053 to 0.050) | −0.011 (–0.060 to 0.037) |
| DBP, mm Hg | 0.027 (–0.012 to 0.066) | 0.015 (–0.026 to 0.056) | 0.015 (–0.028 to 0.059) | 0.002 (–0.040 to 0.045) |
| Blood-Based Sample Outcomes (n = 2963) | ||||
| Model 1a | Model 2b | Model 3c | Model 4d | |
| Triglycerides, mmol/Le | 0.002 (0.000 to 0.004) | 0.002 (0.000 to 0.004) | 0.001 (–0.001 to 0.004) | 0.001 (–0.001 to 0.004) |
| HDL-C, mmol/Le | 0.000 (–0.001 to 0.001) | 0.000 (–0.002 to 0.001) | 0.000 (–0.001 to 0.002) | 0.000 (–0.001 to 0.002) |
| C-reactive protein, mg/Le | 0.001 (–0.005 to 0.007) | 0.001 (–0.005 to 0.008) | −0.002 (–0.009 to 0.004) | −0.003 (–0.010 to 0.003) |
| Glucose, mmol/Le | 0.000 (–0.001 to 0.000) | 0.000 (–0.001 to 0.000) | 0.000 (–0.001 to 0.000) | 0.000 (–0.001 to 0.000) |
| Insulin, IU/Le | 0.001 (–0.001 to 0.004) | 0.001 (–0.001 to 0.004) | −0.001 (–0.004 to 0.001) | −0.002 (–0.005 to 0.001) |
| Total cholesterol, mmol/L | −0.001 (–0.004 to 0.003) | −0.001 (–0.004 to 0.003) | 0.000 (–0.004 to 0.004) | 0.000 (–0.004 to 0.004) |
| LDL-C, mmol/L | −0.001 (–0.004 to 0.002) | −0.001 (–0.004 to 0.002) | −0.001 (–0.004 to 0.002) | −0.001 (–0.005 to 0.002) |
| CMscore, SDf | 0.001 (–0.001 to 0.004) | 0.001 (–0.001 to 0.004) | −0.001 (–0.004 to 0.002) | −0.002 (–0.004 to 0.001) |
Coefficients represent the mean difference in the cardiometabolic risk indicator per 10-minute greater time spent in sedentary behavior. Accelerometry, baseline cardiometabolic risk indicator, and Tanner stage data at age 13 years used for subjects with no accelerometry data at age 11 years.
Adjusted for gender, wear time at age 11 years, and age at measurement of cardiometabolic risk indicator.
Also adjusted for time between accelerometry data collection and measurement of cardiometabolic risk factors, paternal social class, birth weight, maternal BMI, Tanner stage at age 11 years, age at measurement of Tanner stage, and total energy intake at age 10 years.
Also adjusted for time spent in MVPA at age 11 years.
Also adjusted for baseline cardiometabolic risk indicator at age 11 years (BMI used for all blood-based outcomes).
These variables were log-transformed before analysis.
A composite z score compiled from 10 of the outcome variables.
TABLE 2.
Multivariable-Adjusted Associations Between Time Spent in MVPA at Age 11 Years and Adiposity and Cardiometabolic Risk Markers at Age 15 Years
| Variable | Non–Blood-Based Sample Outcomes (n = 4639) | ||
|---|---|---|---|
| Model 1a | Model 2b | Model 3c | |
| BMI SDS | −0.074 (–0.096 to –0.053) | −0.062 (–0.083 to –0.041) | 0.016 (0.004 to 0.028) |
| Body fat mass, % | −0.756 (–0.901 to –0.612) | −0.679 (–0.822 to –0.536) | −0.320 (–0.438 to –0.203) |
| Lean body mass, % | 1.150 (0.983 to 1.317) | 1.065 (0.899 to 1.231) | 0.082 (–0.29 to 0.192) |
| Waist, cmd | −0.008 (–0.010 to –0.005) | −0.007 (–0.009 to –0.004) | 0.002 (0.000 to 0.003) |
| SBP, mm Hg | −0.276 (–0.490 to –0.061) | −0.253 (–0.467 to 0.038) | −0.043 (–0.244 to 0.158) |
| DBP, mm Hg | −0.032 (–0.210 to 0.147) | −0.019 (–0.199 to 0.161) | 0.095 (–0.080 to 0.270) |
| Blood-Based Sample Outcomes (n = 2963) | |||
| Model 1a | Model 2b | Model 3c | |
| Triglycerides, mmol/Ld | −0.012 (–0.021 to –0.002) | −0.011 (–0.020 to –0.001) | −0.007 (–0.017 to 0.002) |
| HDL-C, mmol/Ld | 0.010 (0.005 to 0.015) | 0.009 (0.004 to 0.015) | 0.006 (0.001 to 0.011) |
| C-reactive protein, mg/Ld | −0.045 (–0.072 to –0.018) | −0.043 (–0.070 to –0.016) | −0.019 (–0.045 to 0.008) |
| Glucose, mmol/Ld | 0.000 (–0.002 to 0.002) | 0.000 (–0.002 to 0.002) | 0.000 (–0.002 to 0.002) |
| Insulin, IU/Ld | −0.034 (–0.046 to –0.022) | −0.032 (–0.044 to –0.021) | −0.024 (–0.036 to –0.013) |
| Total cholesterol, mmol/L | 0.006 (–0.010 to 0.021) | 0.006 (–0.010 to 0.021) | 0.007 (–0.008 to 0.023) |
| LDL-C, mmol/L | −0.002 (–0.016 to 0.011) | −0.002 (–0.015 to 0.012) | 0.002 (–0.011 to 0.016) |
| CMscore, SDe | −0.029 (–0.041 to –0.018) | −0.027 (–0.038 to –0.016) | −0.014 (–0.025 to –0.004) |
Coefficients represent the mean difference in the cardiometabolic risk indicator per 10-minute greater time spent in MVPA at age 11 years. Accelerometry, baseline cardiometabolic risk indicator, and Tanner stage data at age 13 years used for subjects with no accelerometry data at age 11 years.
Adjusted for gender, wear time at age 11 years, and age at measurement of cardiometabolic risk indicator.
Also adjusted for time between accelerometry data collection and measurement of cardiometabolic risk factors, paternal social class, birth weight, maternal BMI, Tanner stage at age 11 years, age at measurement of Tanner stage, and total energy intake at age 10 years.
Also adjusted for baseline cardiometabolic risk indicator at age 11 years (BMI used for blood-based outcomes).
These variables were log-transformed before analysis.
A composite z score compiled from 10 of the outcome variables.
Sensitivity Analyses
Figures 2 and 3 show the multivariable-adjusted (including for baseline BMI and MVPA) estimated marginal means and 95% CIs for each cardiometabolic outcome according to tertiles of ST and MVPA, respectively (first tertile represents low ST/MVPA, and the third tertile represents highest ST/MVPA; data for DBP are available on request). As with the analysis using continuous ST (Table 1), once analyses were adjusted for baseline levels of the risk markers, there was only evidence of an inverse association of ST tertiles with BMI and waist circumference (Fig 2). Results from the corresponding MVPA sensitivity analysis were also in close agreement with the main analyses presented in Table 2. Repeating the multiple linear regression analyses by using the observed (nonimputed) data set found that ST was associated with none of the outcomes (Supplemental Table 7). In the nonimputed data set (model 2 of Supplemental Table 8), MVPA was inversely associated with BMI, body fat mass, waist circumference, SBP, C-reactive protein, insulin, and CMscore and directly associated with lean body mass and HDL-C. However, additional adjustments for baseline risk (model 3 of Supplemental Table 8) attenuated all these associations materially, with the exception of fat mass and C-reactive protein, although the effect sizes for the CMscore, insulin, and HDL-C were not different in magnitude to the imputed analyses. We found no evidence for prospective associations between baseline BMI or waist circumference at age 11 years and accelerometer-measured ST at age 15 years (Supplemental Table 9).
FIGURE 2.
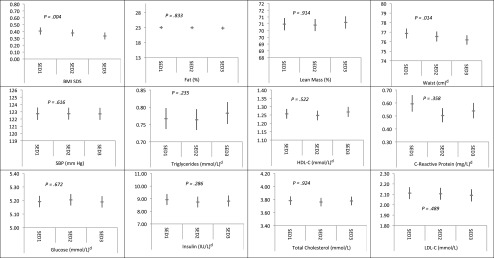
Multivariable-adjusted associations between ST tertilea,b at age 11 yearsc and cardiometabolic risk factors at age 15 years; n = 4639 for adiposity and SBP exposures, n = 2963 for blood exposures. aSED1: bottom tertile; SED2: middle tertile; SED3: top tertile. bCoefficients and associated 95% CIs represent the estimated marginal mean of each cardiovascular risk factor. Adjusted for gender, baseline cardiometabolic risk indicator at age 11 years (BMI used for blood-based outcomes), accelerometer wear time at age 11 years, age at measurement of outcome, time between accelerometry data collection and measurement of cardiometabolic risk factors, paternal social class, birth weight, maternal BMI, Tanner stage at age 11 years, age at measurement of Tanner stage, total energy intake at age 10 years, and MVPA time at age 11 years. cAccelerometry, baseline cardiometabolic risk indicator, and Tanner stage data at age 13 years used for subjects with no accelerometry data at age 11 years. dThese variables were log-transformed by using the natural log and have been back-transformed by exponentiation.
FIGURE 3.
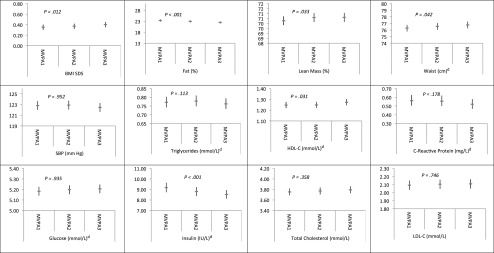
Multivariable-adjusted associations between MVPA time tertilea,b at age 11 yearsc and cardiometabolic risk factors at age 15 years; n = 4639 for adiposity and SBP exposures, n = 2963 for blood-based exposures. aSED1: bottom tertile; SED3: top tertile. bCoefficients and associated 95% CIs represent the estimated marginal mean of each cardiovascular risk factor. Adjusted for gender, baseline cardiometabolic risk indicator at age 11 years (BMI used for blood-based outcomes), accelerometer wear time at age 11 years, age at measurement of outcome, time between accelerometry data collection and measurement of cardiometabolic risk factors, paternal social class, birth weight, maternal BMI, Tanner stage at age 11 years, age at measurement of Tanner stage, and total energy intake at age 10 years. cAccelerometry, baseline cardiometabolic risk indicator, and Tanner stage data at age 13 years used for subjects with no accelerometry data at age 11 years. dThese variables were log-transformed by using the natural log and have been back-transformed by exponentiation.
Discussion
The evidence base examining the health implications of sedentary lifestyles in adulthood is rapidly expanding, but there is a paucity of such evidence in children and adolescents. To our knowledge, the present study is the first to prospectively examine the associations of accelerometer-assessed ST time with such a broad range of adiposity and biochemical cardiometabolic risk markers. We found no evidence of a direct association between ST at age 11 years and cardiometabolic risk at age 15 years. The surprising inverse associations between ST and BMI and waist circumference may be due to the high correlation between baseline and follow-up levels of these outcomes: when the baseline levels were removed from the models, these associations were attenuated to the null (Table 1, model 3). Other likely explanations of this paradoxical finding include reasons related to the structure of the data,28 regression of BMI/waist circumference to the mean as participants grew older, and possible reverse causation between accelerometry counts (that determine ST time) and BMI or body fat mass.29 Accelerometer-assessed ST was not associated with adiposity in earlier cross-sectional analyses,16 although greater waist circumference14 and greater body fat mass30 at baseline have been associated with longitudinal increases of ST14 in other studies, a finding we did not confirm.
The discrepancy between adult studies that show ST is associated with increased cardiovascular disease and mortality risk5,8,31 and the present study could be due to the natural trajectory and timing of cardiometabolic disease. In middle-aged adults, for example, the cardiometabolic damage associated with a chronic sedentary lifestyle will have accumulated over several decades and will follow a sequence of natural disease progression stages (ie, a subclinical [increased biological risk factors with no symptoms] to clinical [diagnosed disease through an event] to a fatal event trajectory). In children and adolescents, any lifestyle-related exposure, even if it has been initiated, may not have existed long enough to progress to subclinical and clinical expressions of the disease. If this lifetime risk accumulation assumption is proved to be correct, interventions targeting ST in childhood/adolescence would still be important despite the null findings that we and others have reported. Nevertheless, this assumption can only be tested by using long-term life-course studies with repeated measures of objectively assessed ST and MVPA. Other possibilities for the discrepancy include that the associations between ST cardiometabolic outcomes in the adult studies are not true or are exaggerated by reverse causality and poor control of dietary confounding and that the measurement of ST in children contains larger measurement errors than in adults due to greater day-to-day variation.
In the same lifetime exposure context, the modest MVPA coefficients (per 10 minutes/d) we reported (eg, insulin: –0.024 mmol/l; HDL-C: 0.006 mmol) might not seem particularly important from a clinical point of view but could signal the initiation of a long-term cumulative process. Conversely, we speculate that both the MVPA and the ST coefficients we observed may be an underestimate because of the well-documented reductions in physical activity and increases in ST from childhood to adolescence in the ALSPAC cohort.21 In terms of MVPA specifically, it has been estimated that the measurement error associated with the within-participant variability that might not be captured by 7 days of accelerometry measurements could reduce the strength of these associations by ∼50%.14
Consistent with results of a prospective recent study with a short follow-up period (<7 months),16 we found that MVPA was associated beneficially with overall CMscore, insulin, HDL-C, and body fat mass. In terms of the latter outcome, our study is in agreement with another recent accelerometry study, which found that MVPA (but not ST time or breaks from ST) was associated with body fat mass in a sample of 554 children who were measured 4 times between the ages of 8 and 15 years.32 We postulate that the prospective associations between MVPA and nonadiposity outcomes we observed are likely to be causal because they are supported by results from physical activity interventions; these interventions, which effectively increase MVPA, have also been shown to improve insulin sensitivity33,34 in youth.
Our study has numerous strengths, including its longitudinal design, the availability of information on objectively assessed ST and MVPA, the large sample size, the broad range of cardiometabolic outcomes, and the longest follow-up period among similar pediatric studies of ST.14,16 The intensity cutoff for MVPA we used (ie, 3600 cpm) is somewhat higher than the cutoffs used in other studies1,14 but has the advantage of being internally derived in the ALSPAC cohort.20 For consistency with previous ALSPAC analyses15,21 and others,22 we used a cutoff of <200 cpm to denote ST, although other studies14 have used a 100-cpm threshold. Previous research,35 however, indicates that the choice of ST threshold does not affect the associations between ST and cardiometabolic outcomes. Using a 1-minute epoch to classify physical activity intensity may have concealed short bursts of vigorous activity and added some imprecision in the MVPA analyses. Finally, although the ST and MVPA patterns at follow-up may be partially responsible for our findings, we were not able to include accelerometry data at age 15 to 16 years because it would have led to a dramatic reduction in the analytical sample size due to missing accelerometry data at age 15 years.21
Conclusions
We found no evidence linking ST in late childhood to cardiometabolic risk in adolescence. MVPA time was beneficially associated with clustered cardiometabolic risk, insulin, HDL-C, and body fat mass in adolescence. Our results highlight the importance of encouraging MVPA among young people as a means of improving cardiometabolic health in youth. If the associations of ST with cardiovascular events in adulthood are because of a progressive lifetime accumulation model, however, then promoting reduced ST in youth may also be important.
Supplementary Material
Acknowledgments
We are extremely grateful to all the families who took part in this study, the midwives for their help in recruiting the families, and the entire ALSPAC team, which includes interviewers, computer and laboratory technicians, clerical workers, research scientists, volunteers, managers, receptionists, and nurses.
Footnotes
Dr Stamatakis conceptualized and designed the study, drafted the initial manuscript, and revised the text of the manuscript several times after previous submissions and reviews; Dr Coombs conducted the initial analyses, drafted parts of the methods section, repeated the analyses several times after previous submissions and reviews, and reviewed and revised the manuscript; Dr Tiling drafted parts of the statistical analyses section, contributed to the idea and design, and reviewed and revised the manuscript; Dr Mattocks drafted parts of the physical analyses section and reviewed and revised the manuscript; Dr Cooper acquired the physical activity data and reviewed and revised the manuscript; Dr Hardy contributed to the idea and reviewed and revised the manuscript; Dr Lawlor acquired the biochemical data, contributed to the idea and design, and reviewed and revised the manuscript; and all authors approved the final manuscript as submitted.
The views expressed in this article are those of the authors and not necessarily those of the National Health Service, the National Institute for Health Research, the Department of Health, or the other study funders.
FINANCIAL DISCLOSURE: The authors have indicated they have no financial relationships relevant to this article to disclose.
FUNDING: The UK Medical Research Council and Wellcome Trust (092731), together with the University of Bristol, provide core support for ALSPAC (Avon Longitudinal Study of Parents and Children). Dr Cooper is supported by the National Institute for Health Research Bristol Nutrition Biomedical Research Unit based at University Hospitals Bristol NHS Foundation Trust and the University of Bristol. Drs Lawlor and Tiling are supported by the UK Medical Research Council (MC_UU_12013/5 and MC_UU_12013/9), and Dr Lawlor is supported by a UK National Institutes of Health Research Senior Investigator Award (NF-SI-0611-10196). The research in this article was specifically funded by grants from the National Heart, Lung and Blood Institute (R01HL071248-01A1), the National Institute of Diabetes and Digestive and Kidney Diseases (R01 DK077659), and the Wellcome Trust (GR068049MA) and a National Institute for Health Research Career Development Fellowship award to Dr Stamatakis. Funded by the National Institutes of Health (NIH).
POTENTIAL CONFLICT OF INTEREST: The authors have indicated they have no potential conflicts of interest to disclose.
References
- 1.Steele RM, van Sluijs EM, Cassidy A, Griffin SJ, Ekelund U. Targeting sedentary time or moderate- and vigorous-intensity activity: independent relations with adiposity in a population-based sample of 10-y-old British children. Am J Clin Nutr. 2009;90(5):1185–1192 [DOI] [PubMed] [Google Scholar]
- 2.Ekelund U, Anderssen SA, Froberg K, Sardinha LB, Andersen LB, Brage S, European Youth Heart Study Group . Independent associations of physical activity and cardiorespiratory fitness with metabolic risk factors in children: the European Youth Heart Study. Diabetologia. 2007;50(9):1832–1840 [DOI] [PubMed] [Google Scholar]
- 3.Telama R, Yang X, Viikari J, Välimäki I, Wanne O, Raitakari O. Physical activity from childhood to adulthood: a 21-year tracking study. Am J Prev Med. 2005;28(3):267–273 [DOI] [PubMed] [Google Scholar]
- 4.Tremblay M, Sedentary Behaviour Research Network . Letter to the editor: standardized use of the terms “sedentary” and “sedentary behaviours.” Appl Physiol Nutr Metab. 2012;37(3):540–542 [DOI] [PubMed] [Google Scholar]
- 5.Katzmarzyk PT, Church TS, Craig CL, Bouchard C. Sitting time and mortality from all causes, cardiovascular disease, and cancer. Med Sci Sports Exerc. 2009;41(5):998–1005 [DOI] [PubMed] [Google Scholar]
- 6.Patel AV, Bernstein L, Deka A, et al. Leisure time spent sitting in relation to total mortality in a prospective cohort of US adults. Am J Epidemiol. 2010;172(4):419–429 [DOI] [PMC free article] [PubMed] [Google Scholar]
- 7.van der Ploeg HP, Chey T, Korda RJ, Banks E, Bauman A. Sitting time and all-cause mortality risk in 222 497 Australian adults. Arch Intern Med. 2012;172(6):494–500 [DOI] [PubMed] [Google Scholar]
- 8.Chomistek AK, Manson JE, Stefanick ML, et al. Relationship of sedentary behavior and physical activity to incident cardiovascular disease: results from the Women’s Health Initiative. J Am Coll Cardiol. 2013;61(23):2346–2354 [DOI] [PMC free article] [PubMed] [Google Scholar]
- 9.Stamatakis E, Coombs N, Jago R, et al. Type-specific screen time associations with cardiovascular risk markers in children. Am J Prev Med. 2013;44(5):481–488 [DOI] [PubMed] [Google Scholar]
- 10.Stamatakis E, Coombs N, Jago R, et al. Associations between indicators of screen time and adiposity indices in Portuguese children. Prev Med. 2013;56(5):299–303 [DOI] [PubMed] [Google Scholar]
- 11.Ekelund U, Brage S, Froberg K, et al. TV viewing and physical activity are independently associated with metabolic risk in children: the European Youth Heart Study. PLoS Med. 2006;3(12):e488. [DOI] [PMC free article] [PubMed] [Google Scholar]
- 12.Hardy LL, Denney-Wilson E, Thrift AP, Okely AD, Baur LA. Screen time and metabolic risk factors among adolescents. Arch Pediatr Adolesc Med. 2010;164(7):643–649 [DOI] [PubMed] [Google Scholar]
- 13.Martinez-Gomez D, Eisenmann JC, Healy GN, et al; AFINOS Study Group. Sedentary behaviors and emerging cardiometabolic biomarkers in adolescents. J Pediatr. 2012;160(1):104–110.e2 [DOI] [PubMed]
- 14.Ekelund U, Luan J, Sherar LB, Esliger DW, Griew P, Cooper A, International Children’s Accelerometry Database (ICAD) Collaborators . Moderate to vigorous physical activity and sedentary time and cardiometabolic risk factors in children and adolescents [published correction appears in JAMA. 2012;307(18):1915]. JAMA. 2012;307(7):704–712 [DOI] [PMC free article] [PubMed] [Google Scholar]
- 15.Mitchell JA, Mattocks C, Ness AR, et al. Sedentary behavior and obesity in a large cohort of children. Obesity. 2009;17(8):1596–1602 [DOI] [PMC free article] [PubMed] [Google Scholar]
- 16.Hjorth MF, Chaput JP, Damsgaard CT, et al. Low physical activity level and short sleep duration are associated with an increased cardio-metabolic risk profile: a longitudinal study in 8-11 year old Danish children. PLoS One. 2014;9(8):e104677. [DOI] [PMC free article] [PubMed] [Google Scholar]
- 17.Coombs N, Shelton N, Rowlands A, Stamatakis E. Children’s and adolescents’ sedentary behaviour in relation to socioeconomic position. J Epidemiol Community Health. 2013;67(10):868–874 [DOI] [PMC free article] [PubMed] [Google Scholar]
- 18.Fraser A, Macdonald-Wallis C, Tilling K, et al. Cohort profile: the Avon Longitudinal Study of Parents and Children: ALSPAC mothers cohort. Int J Epidemiol. 2013;42(1):97–110 [DOI] [PMC free article] [PubMed] [Google Scholar]
- 19.ALSPAC. Data dictionary. Available at: www.bris.ac.uk/alspac/researchers/data-access/data-dictionary/. Accessed April 7, 2015
- 20.Mattocks C, Leary S, Ness A, et al. Calibration of an accelerometer during free-living activities in children. Int J Pediatr Obes. 2007;2(4):218–226 [DOI] [PubMed] [Google Scholar]
- 21.Mitchell JA, Pate RR, Dowda M, et al. A prospective study of sedentary behavior in a large cohort of youth. Med Sci Sports Exerc. 2012;44(6):1081–1087 [DOI] [PMC free article] [PubMed] [Google Scholar]
- 22.van Sluijs EM, Page A, Ommundsen Y, Griffin SJ. Behavioural and social correlates of sedentary time in young people. Br J Sports Med. 2010;44(10):747–755 [DOI] [PubMed] [Google Scholar]
- 23.Lawlor DA, Benfield L, Logue J, et al. Association between general and central adiposity in childhood, and change in these, with cardiovascular risk factors in adolescence: prospective cohort study. BMJ. 2010;341:c6224. [DOI] [PMC free article] [PubMed] [Google Scholar]
- 24.Bigornia SJ, LaValley MP, Moore LL, et al. Dairy intakes at age 10 years do not adversely affect risk of excess adiposity at 13 years. J Nutr. 2014;144(7):1081–1090 [DOI] [PMC free article] [PubMed] [Google Scholar]
- 25.Vidmar S, Carlin J, Hesketh K. Standardizing anthropometric measures in children and adolescents with new functions for egen. Stata J. 2004;4(1):50–55 [Google Scholar]
- 26.Stamatakis E, Hamer M, Mishra GD. Early adulthood television viewing and cardiometabolic risk profiles in early middle age: results from a population, prospective cohort study. Diabetologia. 2012;55(2):311–320 [DOI] [PubMed] [Google Scholar]
- 27.Westreich D, Greenland S. The table 2 fallacy: presenting and interpreting confounder and modifier coefficients. Am J Epidemiol. 2013;177(4):292–298 [DOI] [PMC free article] [PubMed] [Google Scholar]
- 28.Glymour MM, Weuve J, Berkman LF, Kawachi I, Robins JM. When is baseline adjustment useful in analyses of change? An example with education and cognitive change. Am J Epidemiol. 2005;162(3):267–278 [DOI] [PubMed] [Google Scholar]
- 29.Richmond RC, Davey Smith G, Ness AR, den Hoed M, McMahon G, Timpson NJ. Assessing causality in the association between child adiposity and physical activity levels: a Mendelian randomization analysis. PLoS Med. 2014;11(3):e1001618. [DOI] [PMC free article] [PubMed] [Google Scholar]
- 30.Hjorth MF, Chaput JP, Ritz C, et al. Fatness predicts decreased physical activity and increased sedentary time, but not vice versa: support from a longitudinal study in 8- to 11-year-old children. Int J Obes (Lond). 2014;38(7):959–965 [DOI] [PubMed] [Google Scholar]
- 31.Stamatakis E, Hamer M, Dunstan DW. Screen-based entertainment time, all-cause mortality, and cardiovascular events: population-based study with ongoing mortality and hospital events follow-up. J Am Coll Cardiol. 2011;57(3):292–299 [DOI] [PubMed] [Google Scholar]
- 32.Kwon S, Burns TL, Levy SM, Janz KF. Which contributes more to childhood adiposity-high levels of sedentarism or low levels of moderate-through-vigorous physical activity? The Iowa Bone Development Study. J Pediatr. 2013;162(6):1169–1174 [DOI] [PMC free article] [PubMed] [Google Scholar]
- 33.Nassis GP, Papantakou K, Skenderi K, et al. Aerobic exercise training improves insulin sensitivity without changes in body weight, body fat, adiponectin, and inflammatory markers in overweight and obese girls. Metabolism. 2005;54(11):1472–1479 [DOI] [PubMed] [Google Scholar]
- 34.Carrel AL, Clark RR, Peterson SE, Nemeth BA, Sullivan J, Allen DB. Improvement of fitness, body composition, and insulin sensitivity in overweight children in a school-based exercise program: a randomized, controlled study. Arch Pediatr Adolesc Med. 2005;159(10):963–968 [DOI] [PubMed] [Google Scholar]
- 35.Stamatakis E, Davis M, Stathi A, Hamer M. Associations between multiple indicators of objectively-measured and self-reported sedentary behaviour and cardiometabolic risk in older adults. Prev Med. 2012;54(1):82–87 [DOI] [PubMed] [Google Scholar]
- 36.Rubin DB. Multiple Imputation for Nonresponse in Surveys. New York, NY: Wiley Interscience; 1987 [Google Scholar]
- 37.Mackinnon A. The use and reporting of multiple imputation in medical research - a review. J Intern Med. 2010;268(6):586–593 [DOI] [PubMed] [Google Scholar]
Associated Data
This section collects any data citations, data availability statements, or supplementary materials included in this article.