Abstract
Cortical surface atlases play an increasingly important role for analysis, visualization, and comparison of results across different neuroimaging studies. As the first two years of life is the most dynamic period of postnatal structural and functional development of the highly-folded cerebral cortex, longitudinal (4D) cortical surface atlases for the infant brains during this period is highly desired yet still lacking for early brain development studies. In this paper, we construct the first longitudinal (4D) cortical surface atlases for the dynamic developing infant cortical structures at 1, 3, 6, 9, 12, 18 and 24 months of age, based on 202 serial MRI scans from 35 healthy infants. To ensure longitudinal consistency and unbiasedness of the 4D infant cortical surface atlases, we first compute the within-subject mean cortical folding geometries by groupwise registration of longitudinal surfaces of each infant. Then we establish inter-subject cortical correspondences by groupwise registration of the within-subject mean cortical folding geometries of all infants. More importantly, for the first time, we further parcellate the 4D infant surface atlases into developmentally and functionally distinctive regions based solely on the dynamic developmental trajectories of the cortical thickness, by using the spectral clustering method. Specifically, to deal with the problem that each infant has different number of scans, we first compute the within-subject affinity matrix of vertices' cortical thickness trajectories of each infant, and then we use the averaged affinity matrix of all infants for parcellation. Our constructed 4D infant cortical surface atlases with developmental trajectories based parcellation will greatly facilitate the surface-based analysis of dynamic brain development in infants.
Keywords: Infant, cortical surface, atlas construction, surface parcellation
1 Introduction
A brain atlas is a representation of anatomical structures and other reference information in a spatial framework, providing a useful repository of knowledge and also facilitating the analysis of spatially-localized experimental data [1]. In neuroimaging studies, brain atlases play an increasingly important role for analysis, visualization, and comparison of results across different studies [1]. Cortical surface-based analysis is particularly suitable for studying the highly folded cerebral cortex, as this type of methods respects the topology of the cortex and facilitates registration, analysis, and visualization of buried sulci [1, 2]. Moreover, cortical surface based measurements, e.g., cortical thickness, surface area, and gyrification, provide very detailed aspects of the cortex. Accordingly, several cortical surface atlases have been developed [1-3]. For example, FreeSurfer surface atlas is built by landmark-free registration of spherical surfaces of 40 adult brains based on the cortical folding geometries [2]. PALS-B12 and PALS-term12 surface atlases are built by using the sulcal-gyral landmarks constrained registration of 12 adult brains and 12 neonatal brains [3], respectively.
The first two years of life is an exceptionally dynamic period for the structural and functional development of the cerebral cortex [4]. For cortical surface-based analysis of early brain development [3-6], longitudinal (4D) cortical surface atlases for characterizing the dynamic developing infant cortical structures are highly desired yet still lacking. Meanwhile, the existing parcellation in cortical surface atlases is typically defined based on the sulcal-gyral landmarks [7], which, however, are problematic for reliable and precise localization of functional regions. This is because sulcal-gyral patterns are extremely variable and poorly match with the microstructurally defined borders [8]. The microstructures, reflecting the molecular organization and functional principles of the cortex, and their connectivity jointly determine the functional role of a cortex region [8]. Therefore, the microstructurally derived surface atlas parcellation is more ideally for studying the cortex. For example, the well-known Brodmann's map and the recent JuBrain atlas are all defined based on cytoarchitecture [8]. Though the current MRI cannot reveal the cytoarchitecture, parcellation of the surface atlas based on the genetic correlations of cortical thickness has been developed using the MRI of adult twins, reflecting the genetic influences on cortical regionalization [9].
Motivated by these works, in this paper, we construct the first longitudinal (4D) cortical surface atlases to characterize the dynamic developing cortical structures at 1, 3, 6, 9, 12, 18 and 24 months of age, based on 202 serial MRI scans from 35 healthy infants. Meanwhile, the dynamic cortical developmental trajectories in infants reflect the underlying cytoarchitectonic changes of the cortex (e.g., increases in dendritic arborization, axonal elongation and thickening, synaptogenesis and glial proliferation [5]), and thus can help better define the microstructurally distinctive cortical regions than using sulcal-gyral landmarks. Therefore, for the first time, we further parcellate the 4D cortical surface atlases into developmentally and functionally distinctive regions based solely on the developmental trajectories of cortical thickness in infants.
2 Methods
2.1 Data Acquisition and Image Processing
Serial T1-, T2-, and diffusion-weighted MR images of 35 healthy infants (18 males/17 females) were acquired using a Siemens 3T MR scanner. Each infant was scheduled to be scanned at every 3 months in the first year and then every 6 months in the second year. Due to insufficient-quality and uncompleted scans, each infant has different number of scans, ranging from 4 to 7 in the first two years. In total, 202 quality scans from 35 infants were acquired, with each infant having 5.8 scans on average. The numbers of scans were 35 at 1 month, 28 at 3 months, 31 at 6 months, 27 at 9 months, 29 at 12 months, 31 at 18 months, and 21 at 24 months, respectively.
T1 images (144 sagittal slices) were acquired with the imaging parameters: TR/TE = 1900/4.38 ms, flip angle = 7, resolution = 1 × 1 × 1 mm3. T2 images (64 axial slices) were acquired with the parameters: TR/TE = 7380/119 ms, flip angle = 150, resolution = 1.25 × 1.25 × 1.95 mm3. Diffusion-weighted images (DWI) (60 axial slices) were acquired with the parameters: TR/TE = 7680/82 ms, resolution = 2×2×2 mm3, 42 non-collinear diffusion gradients, and diffusion weighting b=1000s/mm2.
T2 images and fractional anisotropy (FA) images, derived from distortion corrected DWI, were rigidly aligned onto their T1 images and further resampled to 1 × 1 × 1 mm3. After removing non-cerebral tissues, tissue segmentation was performed using a 4D level-set method, which integrates the multimodal information of T1, T2 and FA images [10]. Non-cortical structures were filled, and each brain was separated into left and right hemispheres. For each hemisphere, inner and outer cortical surfaces were reconstructed with the following steps: (1) performing topology correction of white matter (WM); (2) tessellating the boundary of the corrected WM as an explicit triangular mesh representation; (3) applying a deformable surface method to obtain the refined inner and outer surfaces [4]. The cortical thickness of each vertex was computed as the mean of the minimum distance from inner to outer surfaces and that from outer to inner surfaces. The inner surface was further mapped to a standard sphere [2].
2.2 Constructing 4D Infant Cortical Surface Atlases
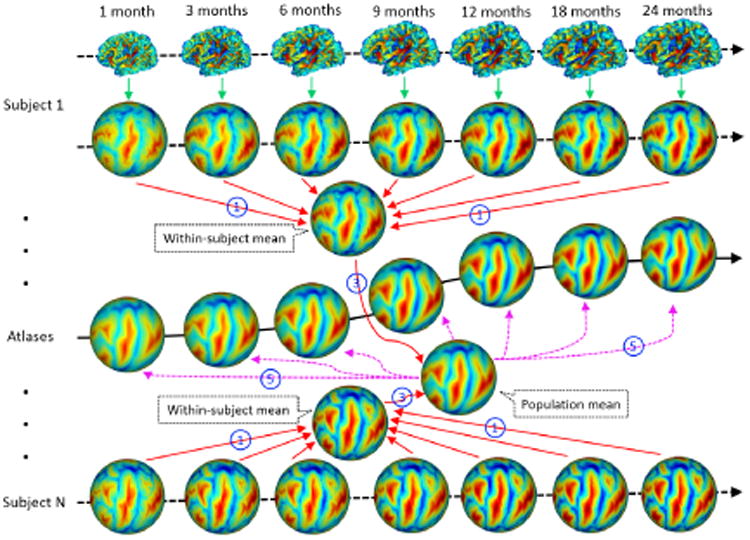
One solution for 4D cortical surface atlases construction is to independently align the spherical surfaces of all infants at each age with groupwise registration. However, this ignores the within-subject longitudinal constraints and thus could lead to temporally inconsistent atlases. To ensure longitudinal consistency and unbiasedness of 4D infant cortical surface atlases, the proposed method makes use of the within-subject longitudinal constraints and consists of the following 5 steps, as shown in Fig. 1. First, for each hemisphere, all longitudinal spherical surfaces of the same infant were groupwisely aligned using Spherical Demons [11], to establish the unbiased within-subject cortical correspondences (step 1 in Fig. 1). Second, for each infant, the within-subject mean cortical folding geometries were computed based on their cortical correspondences. As major cortical folding were present at term birth and were preserved during postnatal development [3, 4], the within-subject mean cortical folding geometries are sharp and contain detailed information of cortical folding. Third, the within-subject mean cortical folding geometries of all infants were groupwisely aligned using Spherical Demons, to establish unbiased inter-subject cortical correspondences (step 3 in Fig. 1). Fourth, for each age, the inter-subject cortical correspondences were established based on the correspondences defined by their within-subject mean cortical folding geometries, and each surface was resampled to a standard-mesh tessellation, leading to the consistent inter-subject cortical correspondences across all ages. Finally, for each age, a surface atlas consisting of the mean and variance of cortical folding geometries, e.g., mean curvature, average convexity, and mean curvature of inflated surfaces [2], across all infants at this age was constructed on the spherical surface (step 5 in Fig. 1). Thus, the 4D infant surface atlases capture both the longitudinally-consistent changes and inter-subject variability of cortical folding.
Fig. 1. Illustration of the proposed method for 4D infant cortical surface atlas construction.
2.3 Parcellation of 4D Surface Atlases Using Developmental Trajectories
As mentioned, the dynamic cortical developmental trajectories in infants reflect the underlying microstructural changes of the cortex [4], and thus could help better define the microstructurally and functionally distinctive regions than using sulcal-gyral landmarks. Accordingly, we proposed to parcellate 4D surface atlases based solely on the dynamic developmental trajectories of cortical thickness, which is well correlated with cognitive functions. Before performing parcellation, for each time point of each infant, the cortical thickness map was smoothed and normalized by the mean cortical thickness of the cortical surface to account for dynamic cortex changes in infants.
We adopted the spectral clustering method [12] for 4D surface atlases parcellation. First, for each infant, we defined the subject-specific affinity matrix of the developmental trajectories of cortical thickness between each pair of vertices using Pearson's correlation, to address the problem that each infant had different number of scans and regional variations of cortical thickness. Specifically, for an infant subject s with ns time points, at a vertex i, its cortical thickness trajectory was denoted as , t ∈ {1, …,ns}. For two vertices i and j, Pearson's correlation coefficient was computed as: . Thus, for each infant, an affinity matrix As can be computed, with its element . The range of is between 0 and 2, indicating that two vertices are very different or very similar. Note that was defined for each pair of vertices and relied solely on the developmental trajectories.
Then, we computed the mean affinity matrix A by averaging the corresponding elements of affinity matrices of all infants. Next, we normalized the affinity matrix A as L = D-1/2AD-1/2, where D was a diagonal matrix with Di,i = Σj Ai, j. The data was then represented in an eigenspace using top 30 eigenvectors of D, which better captured the distributions of the original data points. Finally, we used Gaussian mixture models, which was initialized by k-means method, to cluster the data into different groups using the new data representation in the eigenspace.
3 Results
We utilize 35 healthy infants with 202 MRI scans in total, for construction of 4D infant cortical surface atlases. Fig. 2 shows means and variations of the average convexity and mean curvature on the spherical spaces of the constructed 4D infant cortical surface atlases for the left hemisphere at 1, 3, 6, 9, 12, 18 and 24 months of age. The mean curvature reflects the fine-scale geometry of the cortical folding, while the average convexity, which records the accumulated movement for each vertex during surface inflation, reflects the large-scale geometry of the cortical folding [2]. As we can see, major cortical folding patterns are temporally quite consistent for both average convexity and mean curvature in the first 24 months. However, the magnitude of the average convexity increases considerably, though the mean curvature changes relatively subtly. The central sulcus consistently exhibits small inter-subject variations of cortical folding geometries, while the prefrontal and parietal cortices show large inter-subject variations.
Fig. 2.
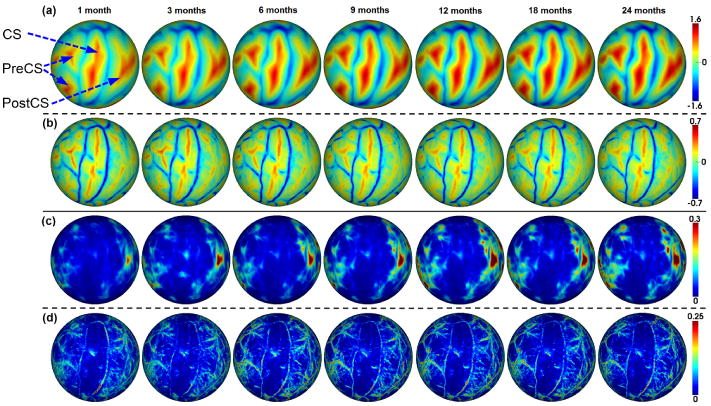
Longitudinal (4D) infant cortical surface atlases at 1, 3, 6, 9, 12, 18 and 24 months of age. (a) Average convexity. (b) Mean curvature. Blue color indicates gyri, and red color indicates sulci. CS=central sulcus, PreCS=precentral sulcus, PostCS=postcentral sulcus. (c) Variations of average convexity. (d) Variations of mean curvature.
To demonstrate the advantage of the proposed method for 4D infant cortical surface atlas construction, we compare it with the conventional case of constructing the 4D surface atlases by independent groupwise registration of all surfaces at each time point. Fig. 3 provides a representative example of the close-up view of the mean curvatures on 4D cortical surface atlases constructed by two different methods. As we can see, the proposed method generates longitudinally more consistent 4D cortical surface atlases, along with much shaper cortical folding patterns, than the counterpart method that uses independent groupwise registration of surfaces for each time point.
Fig. 3. Comparisons of 4D surface atlases (color-coded by the mean curvature), constructed by (a) the proposed method and (b) groupwise surface registration at each age independently.
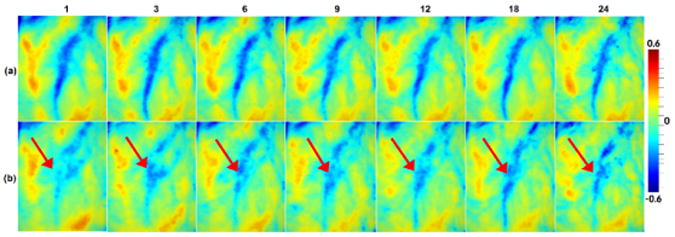
Fig. 4 shows the average Pearson's correlation maps of the developmental trajectories of cortical thickness between each vertex and all other vertices of 12 randomly selected infants, along with the mean correlation maps of all 35 infants. Individual variations of correlation patterns may come from inherent inter-subject variability or different number of scans. However, the global correlation patterns (positive vs nega-tive correlations) of individuals are quite similar with those of the averaged patterns of all infants. The motor, somatosensory, and visual cortices have strong positive correlations (large similarity) with other regions, while temporal and prefrontal asso-ciation cortices have strong negative correlations (small similarity) with other regions in their trajectories. Of note, the mean correlation map may potentially be confounded by regional variations of surface alignment errors, e.g., association cortices with more variable folding may have lower surface alignment accuracies than unimodal cortices.
Fig. 4.

Average Pearson's correlation map of the developmental trajectories of the cortical thickness between each vertex and all other vertices. (a)-(b) Correlation maps of 12 randomly selected infants. (c)-(d) Mean correlation maps of 35 infants.
Fig. 5 shows the parcellation of the surface atlas of the left hemisphere with 2 and 12 clusters, respectively, based on the developmental trajectories of cortical thickness, in order to compare with the recent surface atlas parcellation based on the genetic correlation of cortical thickness derived from MRI of adult twins [9]. In the 2-cluster parcellation, the motor, somatosensory and visual cortices are grouped into a cluster, while the prefrontal and temporal association cortices are grouped into the other clus-ter, indicating distinct developmental trajectories between high-order association cor-tices and unimodal cortices. In the 12-cluster parcellation, all clusters correspond closely to the functionally meaningful regions, including: 1, sensorimotor cortex; 2, superior parietal cortex; 3, inferior parietal cortex; 4, perisylvian region; 5, occipital cortex; 6, cingulate cortex; 7, orbitofrontal cortex; 8, insula cortex; 9, medial temporal cortex; 10, lateral temporal cortex; 11, dorsolateral prefrontal cortex; 12, medial frontal cortex. Notably, boundaries of many clusters do not follow sulcal-gyral land-marks, suggesting that they may not be borders for the microstructural development. To further confirm the surface atlas parcellation, Fig. 6 show seeds (25 different seeds) based analysis of mean correlation maps of the cortical thickness trajectories. At each seed location on the large (grey) cortical surface, its correlations with all other vertices are shown by a respective color-coded small surface map. High correlations are always observed in the region closest to each seed, while the seeds in the same cluster yield largely the similar correlation patterns. Meanwhile, the boundaries of positive and negative correlations are largely similar, regardless of the seed position. In addition, as shown in Fig. 5, several clusters in our parcellation and the parcellation based on genetic correlation of adult cortical thickness [9] look similar, e.g., perisylvian region (cluster 4), dorsolateral prefrontal cortex (cluster 11) and medial temporal cortex (cluster 9), which, however, needs further quantitative comparison.
Fig. 5. Cortical surface atlas parcellations based on infant trajectories of cortical thickness, compared with the parcellations based on adult genetic correlation of cortical thickness [9].
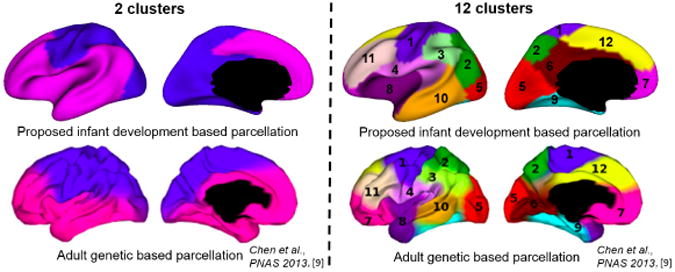
Fig. 6.
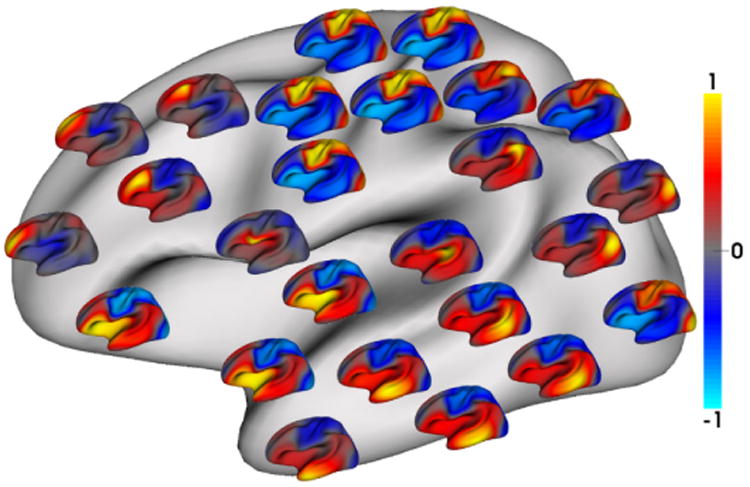
Seed-based analysis of group averaged correlation patterns of cortical thickness trajecto-ries from 35 infants, for confirming the parcellation in Fig. 5. For each of 25 seeds, its correla-tions with all other vertices are shown as a respective color-coded small surface map.
4 Conclusion
Our contribution in this paper is threefold. First, we proposed a new method for building longitudinally-consistent 4D cortical surface atlases. Second, we constructed the first 4D infant cortical surface atlases for characterizing the dynamic developing cortex at 1, 3, 6, 9, 12, 18 and 24 months of age. Third, for the first time, we parcellated the 4D infant surface atlases into developmentally and functionally distinctive regions based solely on the dynamic trajectories of the cortical thickness. In our future work, we will also consider using the developmental trajectories of the local surface area and local gyrification for parcellation. We will make our 4D infant cortical surface atlases publically available for facilitating early brain development studies.
References
- 1.Van Essen DC, Dierker DL. Surface-based and probabilistic atlases of primate cerebral cortex. Neuron. 2007;56:209–225. doi: 10.1016/j.neuron.2007.10.015. [DOI] [PubMed] [Google Scholar]
- 2.Fischl B, Sereno MI, Tootell RH, Dale AM. High-resolution intersubject averaging and a coordinate system for the cortical surface. Human Brain Mapping. 1999;8:272–284. doi: 10.1002/(SICI)1097-0193(1999)8:4<272::AID-HBM10>3.0.CO;2-4. [DOI] [PMC free article] [PubMed] [Google Scholar]
- 3.Hill J, Dierker D, Neil J, Inder T, Knutsen A, Harwell J, Coalson T, Van Essen D. A surface-based analysis of hemispheric asymmetries and folding of cerebral cortex in term-born human infants. J Neurosci. 2010;30:2268–2276. doi: 10.1523/JNEUROSCI.4682-09.2010. [DOI] [PMC free article] [PubMed] [Google Scholar]
- 4.Li G, Nie J, Wang L, Shi F, Lin W, Gilmore JH, Shen D. Mapping region-specific longitudinal cortical surface expansion from birth to 2 years of age. Cereb Cortex. 2013;23:2724–2733. doi: 10.1093/cercor/bhs265. [DOI] [PMC free article] [PubMed] [Google Scholar]
- 5.Rodriguez-Carranza CE, Mukherjee P, Vigneron D, Barkovich J, Studholme C. A framework for in vivo quantification of regional brain folding in premature neonates. Neuroimage. 2008;41:462–478. doi: 10.1016/j.neuroimage.2008.01.008. [DOI] [PMC free article] [PubMed] [Google Scholar]
- 6.Xue H, Srinivasan L, Jiang S, Rutherford M, Edwards AD, Rueckert D, Hajnal JV. Automatic segmentation and reconstruction of the cortex from neonatal MRI. Neuroimage. 2007;38:461–477. doi: 10.1016/j.neuroimage.2007.07.030. [DOI] [PubMed] [Google Scholar]
- 7.Desikan RS, Segonne F, Fischl B, Quinn BT, Dickerson BC, Blacker D, Buck-ner RL, Dale AM, Maguire RP, Hyman BT, Albert MS, Killiany RJ. An automated labeling system for subdividing the human cerebral cortex on MRI scans into gyral based regions of interest. Neuroimage. 2006;31:968–980. doi: 10.1016/j.neuroimage.2006.01.021. [DOI] [PubMed] [Google Scholar]
- 8.Zilles K, Amunts K. TIMELINE Centenary of Brodmann's map - conception and fate. Nature Reviews Neuroscience. 2010;11:139–145. doi: 10.1038/nrn2776. [DOI] [PubMed] [Google Scholar]
- 9.Chen CH, Fiecas M, Gutierrez ED, Panizzon MS, Eyler LT, Vuoksimaa E, Thompson WK, Fennema-Notestine C, Hagler DJ, Jr, Jernigan TL, Neale MC, Franz CE, Lyons MJ, Fischl B, Tsuang MT, Dale AM, Kremen WS. Genetic topography of brain morphology. Proc Natl Acad Sci U S A. 2013;110:17089–17094. doi: 10.1073/pnas.1308091110. [DOI] [PMC free article] [PubMed] [Google Scholar]
- 10.Wang L, Shi F, Yap PT, Gilmore JH, Lin W, Shen D. 4D multi-modality tissue segmentation of serial infant images. PLoS One. 2012;7:e44596. doi: 10.1371/journal.pone.0044596. [DOI] [PMC free article] [PubMed] [Google Scholar]
- 11.Yeo BT, Sabuncu MR, Vercauteren T, Ayache N, Fischl B, Golland P. Spherical demons: fast diffeomorphic landmark-free surface registration. IEEE Trans Med Imaging. 2010;29:650–668. doi: 10.1109/TMI.2009.2030797. [DOI] [PMC free article] [PubMed] [Google Scholar]
- 12.Ng AY, Jordan MI, Weiss Y. On spectral clustering: Analysis and an algorithm. Adv Neur In. 2002;14:849–856. [Google Scholar]


